© 2016, IRJET ISO 9001:2008 Certified Journal
Page 1810
Analysis of the influence of waste polymer on soil subgrade
Feroz Hanif Khan
11
Assistant Professor, Dept. Of Civil Engineering, PRMCEAM, Badnera, Maharashtra, India.
---***---Abstract -
This project is an attempt to understandthe strength of subgrade in terms of CBR values and the corresponding variation in moisture content and to demonstrate the potential of high density polyethylene waste plastic fibres (HDPE) as soil reinforcement for improving engineering performance of subgrade soil. With this, a series of California Bearing Ratio (CBR) tests were carried out randomly reinforced soil in which the percentage of waste plastic fibres with different lengths and proportions (0 to 6 %) were carried on. The Indian Road Congress (IRC) encodes the exact design strategies of the pavement layers based upon the subgrade strength which is primarily dependent on CBR value for a laboratory. The results and conclusions were made which shows that use of waste plastic fibres in soil in an appropriate amount really aids in improving the strength of soil and also helps in modification of soil properties. The reinforcement benefit increased with an increase in waste plastic fibre content and waste plastic fibre length. The proposed technique can be used to advantage in embankment/road construction. The material can be used in base courses in constructing rural roads over saturated clay, thereby leading to safe disposal of these waste plastic materials in an environment friendly manner.
Key Words: CBR, Shear stress, Soil, Sub-grade, Waste polymer (or Waste plastic fibres i.e. WPF)
1.INTRODUCTION:
With the growth of cities and industrial areas, the availability of land for construction with sufficient bearing capacity and settlement within permissible limit becomes depleted. The geotechnical engineers have been forced to construct at given site with given soil condition. Most developed and developing countries all over the world have huge resources of waste materials such as waste plastic. The growing interest in utilizing waste materials in civil engineering applications has opened the possibility of constructing reinforced soil structure with unconventional backfills, such as waste plastics fibres. Many highway agencies, private organizations and researchers are doing extensive studies on waste materials and research projects concerning the feasibility and environmental suitability. Commonly, gravel is considered to be suitable for road construction. However, in the latest MORTH specifications, several types of gravel are found to beunsuitable for road construction in view of higher finer fraction and excessive plasticity properties. In recent years applications of nontraditional materials either natural or waste products have been tried in road construction in many developing countries.
Preliminary experiments show that addition of plastic waste fibres lead to an improvement in strength response and there is a need to do detailed studies in this direction. Randomly reinforcing the soil by using waste plastic fibres obtained from waste plastic bottles and polymer fibre may provide an easy and an economical means to improve the engineering performance of existing soil. Therefore, in the present investigation an attempt has been made to demonstrate the potential of waste plastic fibres as soil reinforcement for improving the subgrade soils. It is the fact that we can reuse the plastic and make it usable for number of times so that its wastage will be reduced remarkably. So it can be used for the alternative method where its important will be counted and stabilization of soil is the best place where this material can be used up. Therefore, the quantity of waste plastic fibre that is being currently reused or recycled is only a fraction of the total volume produced every year. A treated or stronger subgrade soils shall require relatively thinner section of a flexible pavement as compared to that of an untreated and weaker sub-grade resulting in significant cost advantage. However; in certain cases; especially for low cost embankment/road construction, their cost becomes a prohibitive factor for their wide spread use.
Towards this end; randomly reinforcing the soil by using high density polyethylene waste plastic fibres obtained from waste plastic containers may provide an easy and sometimes an economical means to improve the engineering performance of subgrade soils. On the other hand, they are otherwise considered unsuitable and if found effective can also reduce the problem of disposal of this non biodegradable waste causing environmental hazards. Hence focus has been given to strength improvement of soil Sub-grade and effective disposal of waste plastic materials.
2. LITERATURE REVIEW :
© 2016, IRJET ISO 9001:2008 Certified Journal
Page 1811
study on the effect of plastic granules on the properties ofsoil. Utilizing the waste plastic as granules in the soil solves the problem of disposing the waste and it does not show any considerable reduction in the strength of soil. Experiments were done by taking an available weak soil as sample. These tests are conducted on soil with varying percentage of plastic granules and without adding it and comparing those results. Data presented includes dry density, shear strength, CBR value, permeability. The experiment reveals that properties of soil does not change considerably. The proposed technique can be used as an effective method to dispose the waste plastic.
‘Effects of Waste Plastic Fibres on Compaction and Consolidation Behavior of Reinforced Soil’, Arpan Laskar and Dr. Sujit Kumar Pal [2], in this paper a laboratory investigation has been carried out to evaluate the effect of waste plastic fibre on compaction and consolidation behaviours of reinforced soil. The initial stage of the experimental programme includes the study of the effect of plastic fibre (as reinforcement material) on maximum dry density (MDD) and optimum moisture content (OMC) with different sizes and contents. In this experimental study, raw plastic bottle fibres has been used in three different aspect ratios (AR), i.e. 2 (size=10mm Χ 5 mm), 4 (size=10mm Χ 2.5mm) and 8 (size=10 mm Χ 1.25 mm). These different sizes of plastic strips have been mixed with local sandy-silt soil with clay (Fine Sand = 40.15%, Silt = 30.90%, and Clay = 28.95%) in four different percentages 0.00, 0.25, 0.50 and 1.00% by dry weight of the soil. From the experimental study on remolded fibre reinforced soils, it has found that, compression index (Cc) and coefficient of volume change (mv) values decreases with the increase of fibres in soil from upto 0.50%, but values increases with further increase of plastic fibres upto 1.00% in soil. 90% of total compression takes place within 96 seconds for 800 kN/m2 load with the inclusion of the plastic fibres in soil with aspect ratio 8 and fibre content of 1.00%.
3.
MATERIALS AND METHODOLOGY
The materials which are used in the construction of pavement are of intense interest to the highway engineer. This requires not only a thorough understanding of the soil properties which affect pavement stability and durability, but also the binding materials which may be added to improve these pavement features. The materials which were considered in this project work are as follows:
a) Soil Subgrade,
b) The waste plastic fibre which are being added in certain proportion and the sample so formed were tested.
A.
Sub grade soil :
Soil is an accumulation or deposit of earth material, derived naturally from the disintegration of rocks or decay of vegetation that can be excavated readily with power equipment in the field or disintegrated by gentle mechanical means in the laboratory. The supporting soil beneath pavement and its special under courses is called sub grade. Undisturbed soil beneath the pavement is called natural sub-grade. Compacted sub grade is the soil compacted by controlled movement of heavy compactors.Desirable properties of soil subgrade :
The desirable properties of sub grade soil as a highway material are
• Stability • Permanency of strength • Incompressibility • Good drainage • Ease of compaction, and
• Minimum changes in volume and stability under adverse conditions of weather and ground water.
B.
Waste plastic fibre
: Waste plastic fibres are
used as a reinforcement material to improve the strength of soil-Subgrade. There are various Plastic fibre used in this project work. These waste plastic fibre, their general properties and their aspect ratio are described below. Waste a plastic bottle fibre which is basically a high density polyethylene (HDPE) type of plastic. See figure 3.2.These were cut into lengths of 12mm [Aspect Ratio (AR) =1], 24mm (AR=2) and 36mm (AR=3), as shown in figures 3.1. It is important to ensure that mould diameter remains at least 4 times the maximum waste plastic fibre length, which will ensure that there is sufficient room for the waste plastic fibres to deform freely and independent of mould confinement.
© 2016, IRJET ISO 9001:2008 Certified Journal
Page 1812
The waste plastic fibres to be added to the soil wereconsidered a part of the solid fraction in the void solid matrix of the soil. The content of the waste plastic fibre is defined herein as the ratio of weight of waste plastic fibres to the weight of dry sand. The tests were conducted at various waste plastic fibre contents of 0%, 1%, 2%, 3%, 4%, 5% and 6%. In the absence of standards for testing waste plastic fibres, the standard used for wide width tensile strength test (ASTM D 4885) for geo-synthetics were used. The tensile strength of 100mm long waste plastic fibre was determined at a deformation rate of 10mm/min in a computer controlled House field machine. The average ultimate tensile strength of this waste plastic fibre was 0.36kN and percent elongation at failure was 23%. The plastic waste used for the experiments is the leftover of processed plastic waste and cannot be recycled. The test was carried on the basis of various content of the waste plastic fibres in percentage then the conclusions were done as per the test.
C.
Sample preparation and designation of soil
waste mix:
The various tests were conducted as per IS codes in the laboratory, by using different percentages of waste plastic fibres mixed with dry weight of soil subgrade and compacted to maximum dry density and optimum moisture content with a view to find the optimum percentage of waste plastics.“Figure 3.2 Showing sample preparation”
The different soil waste samples were prepared by thoroughly mixing weighed amount of soil and waste plastic fibre in the proportion as under:
0% waste plastic content = 100% Soil-Subgrade + 0% Waste plastic fibre content,
1% = 99% Soil-Subgrade + 1% Waste plastic fibre content, 2% = 98% Soil-Subgrade + 2% Waste plastic fibre content, 3% = 97% Soil-Subgrade + 3% Waste plastic fibre content, 4% = 96% Soil-Subgrade + 4% Waste plastic fibre content, 5% = 95% Soil-Subgrade + 5% Waste plastic fibre content, 6% = 94% Soil-Subgrade + 6% Waste plastic fibre content.
D.
Experimental work/investigations:
A brief description of the materials and methods [as per IS-2720-Part-XVI (1987)] used in this investigation is given in the following paragraphs:
Soil: Soil for the work was locally available and collected from the area near Trimurti nagar square, Nagpur. Tests were carried out to determine the various properties of soil and results are tabulated in table 3.1 given below:
“Table 3.1Showing Properties of soil”
Sr.
No.
Laboratory Test
Result
Relevant IS
Codes
1
Grain Size
Distribution
74.69%
fine
IS 2720 Part IV
2
Specific Gravity
(G)
2.65
IS 2720 Part III
3
Water Content
(Natural) (w)
9.29%
IS 2720 Part II
4
Liquid Limit
(WL)
56.50%
IS 2720 Part V
5
Plastic Limit
(WP)
29.10%
IS 2720 Part V
6
Plasticity Index
(IP or P.I)
27.40%
IS 2720 Part V
7
Free Swell Index
(F.S.I)
30
IS 2720 Part XI
8
Optimum
Moisture
Content(O.M.C.)
20.02%
IS 2720 Part VIII
9
Maximum Dry
Density
(M.D.D.)
1.63
gm/cc
IS 2720 Part VIII
10 C.B.R. 2.33% IS 2720 Part XVI
11 U.C.S. at OMC 2.69 Kg/cm2
© 2016, IRJET ISO 9001:2008 Certified Journal
Page 1813
Properties of reinforcement:
“Table 3.2 Showing Properties of WPF (Test results)”
Length (mm)
12, 24, and 36Width (mm)
12Thickness (mm)
0.40Specific gravity
1.33II.
LABORATORY EXPERIMENTATION
Sub grade soil is an integral part of the road pavement structure as it provides the support to the pavement from beneath. The sub grade soil and its properties are important in the design of pavement structure. The main function of the sub grade is to give adequate support to the pavement and for this the sub grade should possess sufficient stability under adverse climatic and loading conditions. Therefore, it is very essential to evaluate the sub grade by conducting tests.
The tests used to evaluate the strength properties of soils may be broadly divided into three groups:
• Shear tests • Bearing tests • Penetration tests
Shear tests are usually carried out on relatively small soil samples in the laboratory. In order to find out the strength properties of soil, a number of representative samples from different locations are tested. Some of the commonly known shear tests are direct shear test, triaxial compression test, and unconfined compression test.
Bearing tests are loading tests carried out on sub grade soils in-situ with a load bearing area. The results of the bearing tests are influenced by variations in the soil properties within the stressed soil mass underneath and hence the overall stability of the part of the soil mass stressed could be studied. Commonly used bearing test is known as California bearing ratio (CBR) test.
Penetration tests may be considered as small scale bearing tests in which the size of the loaded area is relatively much smaller and ratio of the penetration to the size of the loaded area is much greater than the ratios in bearing tests. The penetration tests are carried out in the field or in the laboratory.
A. Tests conducted
1. Grain size analysis for soil sample 2. CBR 3. Standard proctor test 4. Direct shear test
RESULTS AND ANALYSIS
This chapter presents the results of various tests conducted in previous chapter and are analyzed below in the following points
A.
CBR test results:
The most important engineering parameter to evaluate a sub-grade or sub-base materials for pavement design is the CBR value. Deformation of the soil specimen or sample being predominantly shear in nature, the CBR value can be regarded as an indirect measure of strength. The CBR value of the soil samples for various percentages of plastic wastes was determined. From the load penetration curve, the CBR value corresponding to the 2.5 mm and 5mm penetration was determined.
The load-penetration curves obtained from the CBR tests for un-reinforced and randomly reinforced system with waste plastic fibre contents ranged from 1% to 5 % for different aspect ratios (AR=1 to 3) are shown in Figures below. It can be observed from these figures that mixing of randomly distributed waste plastic fibres in soil-subgrade increased the piston load at a given penetration considerably. The figures further reveals that the initial slope of the load-penetration curve is significantly improved due to the incorporation of waste plastic fibres in soil-subgrade. It is also evident from these figures that inclusion of waste plastic increased the CBR value significantly. CBR test results for AR = 1 are tabulated below:
0 2 4 6 8 10 12
0 1 2 4 7.5 12.5
LOA
D
(
K
N)
PENETRATION (mm)
AR = 1
0%
1%
2%
3%
4%
5%
© 2016, IRJET ISO 9001:2008 Certified Journal
Page 1814
02 4 6 8 10 12
0
0.
5 1
1.
5 2
2.
5 4 5
7.
5 10
12
.5
LO
A
D
(
K
N
)
PENETRATION (mm)
AR = 2
0%
1%
2%
3%
4%
5%
6%
“Figure 5.2 Showing Load penetration curve having AR = 2”
0 2 4 6 8 10 12 14 16 18
0 1 2 4 7.5 12.5
LO
A
D
(
K
N
)
PENETRATION (mm)
AR = 3
0%
1%
2%
3%
4%
5%
6%
“Figure 5.3 Showing Load penetration curve having AR = 3”
From the load-penetration curves, it is clear that the penetration resistance of soil increases substantially on addition of plastic waste. The increase in resistance was observed to be greater for higher percentages of plastic waste. This increase in strength can be more clearly characterized by computing and comparing the CBR values, as mentioned in the following section. The CBR value corresponding to the penetrations for different percentage of plastic are shown in the table below.
Effect of % of WPF on CBR values
: The CBR of plain sand was found to be 2.33, which increased to2.43 for 1% plastic waste, 2.69 for 2% plastic waste, 3.01 for 3%, 3.36 for 4%, 3.89 for 5% and 5.1 for 6%.
1.5 2 2.5 3 3.5 4 4.5 5 5.5
0 1 2 3 4 5 6
C
B
R
f
or
2
.5
m
m
a
nd
5
m
m
pe
ne
tr
at
ion
Percentage of Waste plastic fibre
CBR for 2.5 mm penetrat…
“Figure 5.4 Graph showingCBR value Vs % of WPF”
Again the increase in CBR value due to the presence of waste plastic fibre content has been expressed by a dimensionless term California bearing ratio index (CBRI) and has been defined as the ratio of the CBR value of reinforced soil (CBRr) to the CBR value of unreinforced soil (CBRu). It can be expressed as :
CBRI = CBRr/CBRu
Following figures show the variation of CBRI with waste plastic fibre content at different aspect ratio (AR 1 to 3) and similar trend was also observed for strip length
© 2016, IRJET ISO 9001:2008 Certified Journal
Page 1815
1.52 2.5 3 3.5 4 4.5 5 5.5
12 24 36
C
BR
(
%
)
STRIP LENGTH (mm)
O %
1%
2%
3%
4%
5%
6%
“Figure 5.6 Graph showing variation of CBR with strip length”
Effect of % of WPF on Secant modulus
The variation in secant modulus (defined as the ratio of load in KN at a penetration of 2.5 mm to the penetration of 0.0025 m) of reinforced soil subgrade with waste plastic fibre content and strip length is shown in Figure 5.7.As expected, the increase in secant modulus is again noticeably attributed to waste plastic fibre inclusion in the soil subgrade. It is also clear that secant modulus value beyond 5% decreases.
20 30 40 50 60
12 24 36
Se
ca
n
t
m
od
u
lu
s
(N
/m
m
2)
Strip length (mm)
O %
1%
2%
3%
4%
5%
6%
“Figure 5.7 Graph showing Secant modulus Vs strip length”
B.
Standard proctor test results
The optimum moisture content and the maximum dry density of the soil samples for various percentage of plastic wastes (0 %, 1 %, 2 %, 3 %, 4 %, 5 % and 6 %) were determined by performing the Standard Proctor’s test. The dry density and the optimum moisture were determined and plotted against the percentage of waste plastic fibre content.
The values of OMC and MDD for various % of plastic wastes fibres are as shown and their results are tabulated in table 5.12.
“Table 5.1Showing Values of OMC and MDD (test results)”
% plastic waste fibre added to soil
OMC (%) Max dry
density ( g/cc)
0 20.02 1.63
1 19.83 1.48
2 19.57 1.36
3 18.72 1.23
4 18.45 1.18
5 17.91 1.12
6 17.82 1.06
10 12.5 15 17.5 20 22.5
0 1 2 3 4 5 6
O
M
C
(
w
%
)
Percentage of Plastic wastes (%)
“Figure 5.8 Graph showing OMC and MDD for WPF’
1 1.1 1.2 1.3 1.4 1.5 1.6 1.7 1.8
0 1 2 3 4 5 6
M
D
D
(
g/
m
m
)
Percentage of waste plastic (%)
© 2016, IRJET ISO 9001:2008 Certified Journal
Page 1816
From the graph,OMC = 20.02 % and MDD = 1.63 gm/cc
C.
Direct shear test results:
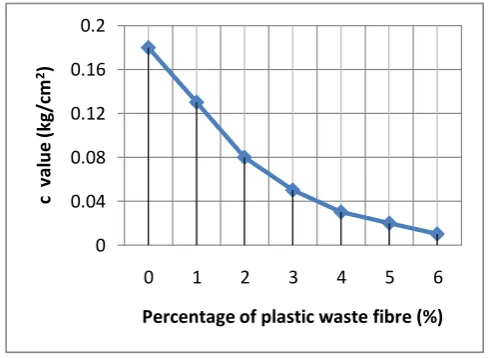
The test was conducted on the soil sample with various percentages of plastic wastes (0%, 1%, 2%, 3%, 4%, 5% and 6%). The values of cohesion, angle of internal friction and Maximum shear stress for various percentage of plastic are tabulated in Table 5.14.
“Table 5.2 Showing Direct shear test results”
% of plastic added
Cohesion
(kg/cm2) Angle of internal friction (Φ )
Maximum shear stress (kg/cm2)
0 0.18 21.61 0.413
1 0.13 22.42 0.489
2 0.08 24.78 0.452
3 0.05 26.45 0.503
4 0.03 28.35 0.526
5 0.02 29.03 0.648
6 0.01 28.72 0.630
The following figures 5.10, 5.11 and 5.12 shows the variation of Cohesion, angle of internal friction and Maximum shear stress for various percentage of plastic.
0 0.04 0.08 0.12 0.16 0.2
0 1 2 3 4 5 6
c
v
al
ue
(kg
/cm
2)
Percentage of plastic waste fibre (%)
“Figure 5.10 Graph showing C value Vs % WPF”’
21 23 25 27 29 31
0 1 2 3 4 5 6
Φ
V
al
u
e
Percentage of plastic waste fibre (%)
“Figure 5.11 Graph showing Φ value Vs % WPF”
0.2 0.3 0.4 0.5 0.6 0.7 0.8
0 1 2 3 4 5 6
M
ax
s
h
e
ar
s
tr
e
ss
(k
g/
cm
2)
Percentage of waste plastic fibre (%)
[image:7.595.37.283.531.710.2]“Figure 5.12Graph showing Max shear stress Vs % WPF”
Figure shows that maximum shear stress is for 5 % waste plastic fibre content and then it decreases. Hence from the figures it is clear that for 6 % plastic waste fibre, cohesion value, internal friction and Maximum shear stress decreases.
III.
DISCUSSIONS ON RESULTS
Based on the results presented in previous chapter, discussions have been made in this section. While testing due considerations were taken care of minimum fault due to instrument and environment was also taken into consideration. When the test was over then dismantle of the sample was done and waste plastic fibre condition was examined which showed that the waste plastic fibre were elongated and the impression of soil particles were very distinct to that waste plastic fibre. The various discussions made are discussed below.
A.
Discussions on CBR test results
© 2016, IRJET ISO 9001:2008 Certified Journal
Page 1817
in nature. The load penetration curves so obtained was doneby taking the varying aspect ratio as 1, 2, and 3 and also at different waste plastic fibre content as 0%, 1%, 2%, 3%, 4%, 5% and 6%.
From the experiment figures and observations, various conclusions can be drawn. It can be seen that the waste plastic reinforced helps to increase the CBR value. There is a major increase in the CBR value when the soil sample of unreinforced is taken with that of reinforced one which is also clear in the figures. It is also clear that when the aspect value is further increased by definite proportion then in such a case CBR values improvement is remarkable. The CBR value keeps on increasing when the aspect ratio is increased to some particular value. It is also clear that the gradual increase in CBR value indicated that use to plastic waste plastic fibre can modify the soil characteristics and helps to provide the strength to the soil.
B.
Discussions on Standard proctor test
results:
Based on results, discussions have been made in this section. Effect of plastic content on compaction properties, Optimum moisture content (OMC) and maximum dry density (MDD) relations from standard proctor compaction tests for soil alone and soil mixed with waste plastic fibres are shown. From the results it is clear that as the applied compaction energy was identical, the change of the maximum dry density of reinforced soil was the result of changing fibre content in soil. For given compaction energy, the presence of the reinforcement provides higher resistance to the compaction and so a less dense packing (low MDD) is obtained once the quantity of fibre is increased (Dutta and Rao 2007). With the increase of the fibre content in soil, energy absorption capacity of reinforced soil is increased.
C.
Discussion on Direct shear test results:
From the test results it was observed that soil reinforced with waste plastic fibres has given comparatively higher values of shear strength parameters in comparison with unreinforced soil. From the direct shear test results, it is observed that for waste plastics, the maximum shear stress and angle of internal friction values are increased and beyond 5% decreased.IV.
CONCLUSIONS
The influence of waste plastic fibre on soil samples were studied by conducting tests with various percentages of waste plastic fibres and the following conclusions were drawn.
1. It is very much clear that mixing of waste plastic fibre in soil subgrade can increase the strength of soil because the soil sample without the waste plastic fibre is having less strength than that of the one with waste plastic fibre.
2. The effect of waste plastic fibre on soil is influenced by various factors such as aspect ratio (i.e. size of waste plastic fibre) and plastic waste content. 3. The angle of internal friction (Ф) increases
considerably with inclusion of different percentages of waste plastic fibre in the soil but the percentage of increase in the angle of internal friction for more than 5 % i.e. for 6 % of waste plastic fibre is decreased.
4. The maximum shear stress also increases upto 5% and then it is decreased. Hence it is maximum for 5% of waste plastic fibre.
5. CBR value is increased when percentage content of waste plastic fibre is added and is maximum for 5% with aspect ratio 3 and it is about two times the value at 0% waste plastic fibre content. For 6% waste plastic content, CBR value is identical to 5%. 6. The addition of waste plastic fibres beyond 5% does not improve the CBR or secant modulus appreciably.
7. The waste plastic fibre decreases the maximum dry unit weight of soil-subgrade and optimum moisture content (OMC).
8. Overall it can be concluded that fibre reinforced soil can be considered to be good ground improvement technique specially in engineering projects on weak soils where also the expected strength gain due to the presence of plastic waste is likely lead to savings in the road construction material.
9. This method is much effective in stabilization and it can be used as an effective method in disposing of waste plastic materials upto some extent.