© 2015, IRJET ISO 9001:2008 Certified Journal
Page
837
Designing of an Analog Sallen Key Band Pass filter using Ant Colony
Optimization
Mohammad Akram(M.Tech), Electronics Circuit & System, Integral University, Uttar Pradesh, India
Mohammad AsifIqbal(M.Tech), Electronics Circuit & System, Integral University, Uttar Pradesh, India
Abstract
:-In this project, an analogSallen Key band-pass filter is designed and simulated. The filter is designed for the given specifications of center frequency of 15 kHz. The architecture that will be used is the Sallen-Key. Analog filters depend upon the values of discrete components (Resistors and Capacitors) which are selected from the series following constant values chosen. It is very exhaustive to search on all possible combinations of value choices for an optimized design. Several Optimization techniques like Ant Colony Optimization have proved a capacity to treat suchproblem effectively. In this work, Ant Colony
Optimization (ACO) technique is applied to the Second Order Sallen Key Band Pass Filter Design.MATLAB simulations are used to validate the obtained result/performances.
Keywords: Band-pass filter, Quality factor, Center Frequency, MATLAB
1 INTRODUCTION:
―A filter is a device that passes electric signals at certain frequencies or frequency ranges while preventing the passage of others‖— Webster. Filters are widely used in variety of application like in the field of telecommunication, band-pass filters are used in the audio frequency range (0 kHz to 20 kHz) for modems and speech processing. High-frequency band-pass filters (several hundred MHz) are used for channel selection in telephone central offices. Data acquisition systems usually require anti-aliasing low-pass filters as well as low-pass noise filters in their preceding signal conditioning stages. System power supplies often use band-rejection filters to suppress the 60-Hz line frequency and high frequency transients. In addition, there are filters that do not filter any frequencies of a
complex input signal, but just add a linear phase shift to each frequency component, thus contributing to a constant time delay. These are called all-pass filters. At high frequencies (> 1 MHz), all of these filters usually consist of passive components such as inductors (L), resistors (R), and capacitors (C). They are then called LRC filters. In the lower frequency range (1 Hz to 1 MHz), however, the inductor value becomes very large and the inductor itself gets quite bulky, making economical production difficult. In these cases, active filters become important. Active filters are circuits that use an operational amplifier (op amp) as the active device in combination with some resistors and capacitors to provide an LRC-like filter performance at low frequencies. They are very much inexpensive in comparison to passive filters due to variety of cheaper op-amp and absence of costly inductors. In this paper, an analog Sallen Key Band Pass filter is designed using Ant Colony Optimization.
2.1 ANT COLONY OPTIMIZATION:
Ant colony algorithm is the probabilistic technique to compute the computational problem. This algorithm is based on the food finding technique of ant. Ant is seeking for path between their colony and food so ant searching for the food and search which food is nearer to their colony then establish shortest path between colony and food.
With the help of pheromones trial, the inspiring source of ACO is the foraging behavior of real ants.
2.2 The Double Bridge Experiment:
© 2015, IRJET ISO 9001:2008 Certified Journal
Page
838
Therefore, if the ground has not been explored yet, they willjust wander and take random decision at each crossroads. After a while, the places around the nest will be all explored. The ants will get to know that by the marking done by the previous ants. Indeed, they will leave behind them the famous pheromones and inform the other ants that the way is already explored.
Fig.1: Ants & Pheromones [11]
The concentration of pheromones depends on the number of ants who took the way, the more ants taking the way, the more pheromones. The configuration is as shown in figure 1: the nest of a colony of ants is connected to the food via two bridges of the same length. In such a setting, ants start to explore the surroundings of the nest and eventually reach the food source. Along their path between food source and nest, ants deposit pheromones. Initially, each ant randomly chooses one of the two bridges. However, due to random fluctuations, after some time one of the two bridges presents a higher concentration of pheromones than the other and, therefore, attracts more ants. This brings a further amount of pheromone on that bridge making it more attractive with the result that after some time the whole colony converges toward the use of the same bridge.
Fig.2: The Double Bridge Experiment [11]
The second experimentation, figure 2gives also two paths to the food source, but one of them is twice longer than the other one. Here again the ants will start to move randomly and explore the ground. Probabilistically, 50% of the ants will take the short way while the 50% others will take the long way, as they have no clue about the ground configuration
Fig.3: Ants coming back to the nest [11]
© 2015, IRJET ISO 9001:2008 Certified Journal
Page
839
pheromones, the path will therefore become more attractive forothers. The ants who took the long way will have more probability to come back using the shortest way, and after some time, they will all converge toward using it. Consequently, the ants will find the shortest path by themselves, without having a global view of the ground. By taking decision at each cross according to the pheromones amount, they will manage to explore, find the food, and bring it back to the nest, in an optimized way.
ACO was initially used to solve graph related problems, such as the traveling salesman problem (TSP), vehicle routing problem, For solving such problems, ants randomly select the vertex to be visited. When ant k is in vertex i, the probability of going to vertex j is given by expression (1)
Where Ji k
is the set of neighbors of vertex i of the kthant, τijis the amount of pheromone trail on edge(i, j), α and β are weightings that control the pheromone trail and the visibility value, i.e. ƞij which expression is given by (2)
dijis the vertices between i and j. The pheromone values are updated each iteration by all the m ants that have built a solution in the iteration itself. The pheromone τij, which is associated with the edge joining vertices i and j, is updated as follows:
where ρ is the evaporation rate, m is the number of ants and Δτijk(t) is the quantity of pheromone laid on edge (i, j) by ant k:
Q is a constant and Lk is the length of the tour constructed by ant k.
The pseudo code of the ACO procedure is as follows: Random initialization of the pheromone value Do
For each iteration
For each ant
Compute of the probability P according to (1) Determine the P max
End
Compute OF End
Deduce the best OF
Update pheromone values according to (3) End
Report the best solution END
Algorithm1. Pseudo code of ACO
3 Application to the Optimal Design of the Sallen Key Band
Pass Filter:
© 2015, IRJET ISO 9001:2008 Certified Journal
Page
840
Fig.4: Second Order Sallen-Key Band-pass filter with Gain(A) >1 [1]
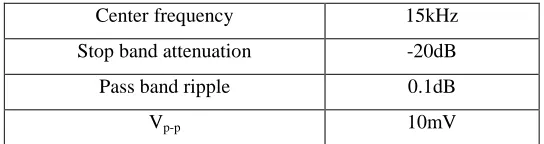
[image:4.612.24.296.417.489.2]Table 1 illustrates the specifications for the desired band-pass filter. By using the following filter paramete rs, the required filter characteristic is simulated with MATLAB
Table 1: Sallen key band pass Filter specifications:
Center frequency 15kHz
Stop band attenuation -20dB
Pass band ripple 0.1dB
Vp-p 10mV
The general transfer function of a second order band pass filter is given as:
H(s) = (5)
The transfer function of the second order Sallen-Key band pass filter in Fig. 4 is:
H(s) =
The above equation can be simplified by setting R1 = R2 = R, R5 = 2R, C1 = C2 = C this is known as the equal component Sallen-Key band-pass filter
H(s) = (6)
Resonant frequency: fo =1/2πCR; or ωo = 1/CR Bandwidth: β = fo/Q;
Op-amp gain: G = 1 + R4/R3; Gain at ωo: A = G/ (3-G); Quality factor: Q = 1/ (3-G);
The poles of the transfer function are:
S1,2= [ (G – 3)/RC ± √{((3 – G)/RC)2 + 4(1/RC)2}] / 2
From equation (5) it can be seen that the quality factor is governed by the term G (op-amp gain). Hence, the quality factor (Q) can be varied via the inner gain (G) without modifying the center frequency. A drawback is, however, that Q and A (gain at center frequency) cannot be adjusted independently. When G approaches the value of 3, A and Q tend to infinitely increase and cause the circuit to oscillate. As G grows greater than 3, Q becomes negative and consequently, A becomes negative too, thus from equation (5), the s – coefficient is equal to zero indicating that H(s) has right half-plane poles . This problem can be solved by adding an input buffer that gives a gain adjustment so as to just compensate for a Q adjustment with a change in the input gain. This will increase the number of components used for design and construction thereby raising the cost of the circuit. Substituting, the above transfer function can be written in standard form as:
H(s) = (7)
Let the design components be:
C = 10nF, R3 = 10k, R4 = 10k, fo= 15kHz
R = 1/ (2*π*15000 * 10 x 10-9
© 2015, IRJET ISO 9001:2008 Certified Journal
Page
841
G = 1 + (10/10) = 2A = 2/ (3 - 2) = 2
Q = 1/ (3 – 2) = 1
Bandwidth = fo/Q = 15 kHz/ 1 = 15 kHz
The transfer function:
H(s) =
[image:5.612.26.295.382.430.2]The Quality factor can be varied by varying the gain G through the resistor R4 or R3. In this paper, R3 is chosen to be constant at 10k, while R4 is chosen as the resistor to be varied. Thus, the different values of Q will be obtained for R4 = 10k, 16k, 17.5k, 18.75k, 19k, 19.9k from the table below:
Table 2: Values of R4 and respective Q
R4 (kΩ)
10 16 17.5 18.75 19 19.9
Q 1.0 2.5 4 8 10 100
By using the transfer function, the frequency response of the filter at varying Q’s can be plotted using MATLAB to verify the design.
The cutoff frequency (ωL, ωH) and the selectivity factor (Q1, Q2) of filter, which depend only on the values of the passives components
For comparison reasons, the specification chosen here is: Q1=0.7654
Q2=1.8478
The values of the resistors and capacitors to choose must be able to generate ωL, ωH, Q1and Q2 approaching the specified values. For this, define the Total Error (TE) which expresses the offset values, of the cut-off frequency and the selectivity factor, compared to the desired values, by:
TE = αΔω + βΔQ (8)
Where Δω=
ΔQ =|Q1- | + |Q2- | (9)
The objective function considered is the Total Error which is calculated for the different values of α and β. The decision variables are the resistors and capacitors forming the circuit. 4 SIMULATIONS & RESULTS:
In this section ACO algorithm is applied to perform optimization of a second order Sallen-Key band pass filter. The optimal values of resistors and capacitors forming the considered filter and the performance.
[image:5.612.314.604.395.592.2]Associated with these values for the different series are shown in Table 3 :
Table 3: Values of components and related filter
performances
Alpha Beta C(pf) R4(K) FL
(KHz )
FH(K
Hz) B.W. (KHz)
Q Fo(
KH z)
ACO 1
0.985 0.015 393.07 18.693 14.02
0 15.98
0
1.9598 7.653
8 15.
0 ACO
2
0.99 0.01 139.35 18.945 14.20
9 15.79
1
1.5829 9.476
2 15.
0 ACO
3
0.981 0.009 223.92 18.995 14.24
6 15.75
4
1.5075 9.950
0 15.
0 ACO
4
0.9999 0.000
1
850.75 19.899 14.92
5 15.07
5
150.75 38
99.5 15.
0 ACO
5
0.99985 0.000
15
736.33 19.849 14.88
7 15.11
3
226.13 07
66.33 15.
0 ACO
6
0.99993 0.000
07
194.07 19.899 14.92
5 15.07
5
150.75 38
99.5 15.
0 ACO
7
0.5 0.5 631.86 10 7.5 22.5 15 1 15.
0 ACO
8
0.9 0.1 796.48 15.980 11.98
5 18.01
5
6.0302 2.487
5 15.
0 ACO
9
0.8 0.2 980.10 13.317 9.987
4 20.01
3
10.025 1.496
2 15.
© 2015, IRJET ISO 9001:2008 Certified Journal
Page
842
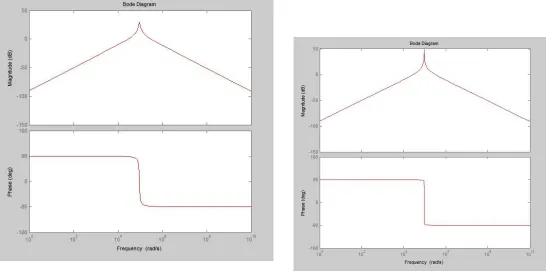
Fig. 5: Simulation of ACO1.Fig. 6: Simulation of ACO2.
[image:6.612.35.581.430.703.2]© 2015, IRJET ISO 9001:2008 Certified Journal
Page
843
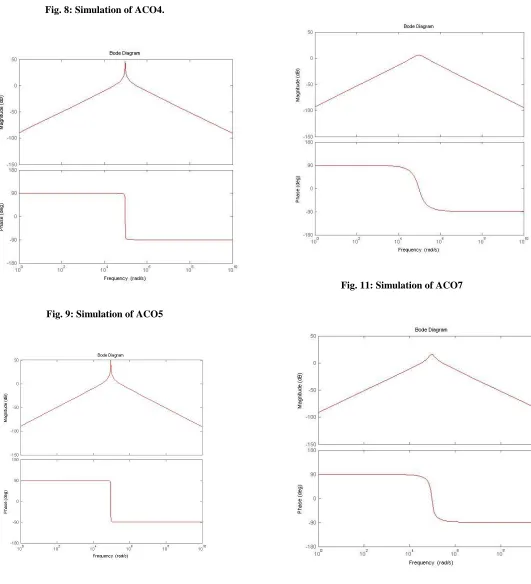
Fig. 8: Simulation of ACO4.Fig. 9: Simulation of ACO5
Fig. 10: Simulation of ACO6.
Fig. 11: Simulation of ACO7
[image:7.612.54.295.150.387.2]© 2015, IRJET ISO 9001:2008 Certified Journal
Page
844
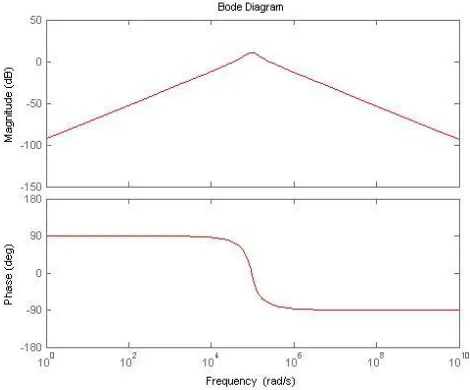
Fig. 13: Simulation of ACO95CONCLUSION:
In this work an application of the Ant Colony Optimization is presented for optimal design of a Second Order Sallen Key Analog Band pass filter. Investigation for the selection of passive components has been done. The design of the analog filter with high accuracy and short execution time is successfully realized using the ACO. It is shown that the tolerances of the spacing values associated to the components affect significantly the performance of the filter. MATLAB simulations confirm the validity of the proposed algorithms.
For the future work one can apply the proposed ACO technique in dealing with the optimal design of complex analog circuits.
6 REFERENCES:
[1] Teryima D. Kureve, Johnson A. Mise, Benard A. Atsuwe, ―Implementation Of An Active RC Band-Pass Filter At Varying Quality Factors Using Matlab‖ ,International Journal of Scientific & Technology Research Volume 3, Issue 5, May 2014.
[2] Bachir Benhala, ―Ant Colony Optimization for Optimal Low-Pass Butterworth Filter Design‖ ,E-ISSN: 2224-266X Volume 13, 2014.
[3] M. Dorigo, G. DiCaro and L. M. Gambardella, ―Ant algorithms for discrete optimization‖, Artificial Life Journal, Vol. 5, 1999, pp. 137-172.
[4] M. Dorigo and S. Krzysztof, ―An Introduction to Ant Colony Optimization, a chapter in Approximation Algorithms and Metaheuristics‖, a book edited by T. F. Gonzalez, 2006. [5] B. Benhala, A. Ahaitouf, M. Kotti, M. Fakhfakh, B. Benlahbib, A. Mecheqrane, M. Loulou, F. Abdi and E. Abarkane, ―Application of the ACO Technique to the Optimization of Analog Circuit Performances‖, book; Analog Circuits: Applications, Design and Performance, Ed., Dr. Tlelo-Cuautle, NOVA Science Publishers, Inc., 2011, pp. 235-255. [6] B. Benhala, A. Ahaitouf, A. Mechaqrane, B. Benlahbib, F. Abdi, E. Abarkan and M. Fakhfakh, ―Sizing of current conveyors by means of an ant colony optimization technique‖, The International Conference on Multimedia Computing and Systems (ICMCS'11), 201, pp. 899-904, Ouarzazate, Morocco. [7] M. Dorigo and S. Krzysztof, ―An Introduction to Ant Colony Optimization, a chapter in Approximation Algorithms and Metaheuristics‖, a book edited by T. F. Gonzalez. 2006. [8] L. D. Paarman, ―Design and Analysis of Analog Filters‖, Norwell, MA: Kluwer, 2007.
[9] L. D. Paarman, ―Design and Analysis of Analog Filters‖, Norwell, MA: Kluwer, 2007.