© 2016, IRJET | Impact Factor value: 4.45 | ISO 9001:2008 Certified Journal | Page 927
Determine Geographical Location of Image Scenes Using Web Cameras
Puja Patil
1, Vrushali Thorve
2, Pawar Minal
3, Pooja Patil
4,Dr. A. C.Lomte
51234
Student of Computer Engineering, JSPM’s BSIOTR College, Wagholi, Pune.
5
Prof. Department of Computer Engineering, JSPM’s BSIOTR College, Wagholi, Pune.
---***---
Abstract
-This paper describes a technique for estimating the situation of Associate in Nursing IP-connected camera (a net cam) by analyzing a sequence of pictures obtained from the camera. First, we have a tendency to classify every image as Day/Night mistreatment the mean physical property of the sky region. From the Day/Night pictures, we have a tendency to estimate the sunrise/set, the length of the day, and native high noon. Finally, the geographical location (latitude and longitude)of the camera incalculable. The experiment results show that our approach achieves affordable performance. Addresses the problem of computing the geographical location from only two shadow trajectories and corresponding footprints on uncelebrated images. Today there isn’t any search engine other than some of the above mentioned ones that provide a better responsiveness to the users request for the result.Keywords: latitude; longitude; sunrise/sunset; environmental monitoring; web camera.
•
Introduction
Thousands of sensors are connected to the net. The “Internet of Things can contain several “things” that are image sensors. This immense network of distributed cameras (i.e. net cams) can still exponentially grow. We tend to have an interest in however these image sensors will be accustomed sense their atmosphere. In particular during this paper we tend to investigate straightforward ways for the way one will confirm metrics of a location (e.g. sunrise/sunset, length of day) and also the location of the online camera by observant the camera output.
The location of some extent on the world is delineate by its latitude and line of longitude (and maybe by its altitude on top of ocean level). Latitude is measured in degrees north or south of the Equator, 90◦ north latitude is that the North Pole and −90◦ south latitude is that the pole. Line of longitude is measured in degrees east and west of Greenwich, England. 180◦ east {longitude meridian line of line of longitude great circle} and −180◦ west longitude meet and kind the International Date Line within the Pacific [6], [7], [8]. The definition of sunrise and sunset is once the geometric celestial point distance of the middle of the Sun is 90◦50′ [9]. That is, the middle of the Sun is geometrically fifty arc minutes below a horizontal plane. There are varied definitions for sunrise/set and day length [10].
Several approaches are reported with relevancy finding a location from pictures. The sunrise and sunset were determined by classifying pictures taken from a digital camera and also the location was then calculable. For crucial the sunrise and sunset, the intensity of the image was accustomed classify day or night and so verify the noontide (or native noon) time to spot the line of longitude and latitude. In [12] the sky region is known by victimization image information taken below numerous climate, predicting the star exposure employing a commonplace sun path model, and so tracing the rays from the sun through the pictures. In [13] vehicle sight ion and chase is employed to detect road conditions in each day and This work was part supported by the endowment of the Charles William Harrison Distinguished chair at Purdue University. Address all correspondence to Edward J. Delp, [email protected] night images by victimization images and measuring system sensors. A way to retrieve the weather info from information of still pictures was given in [14]. The sky region of image was detected by victimization the distinction of component values from consecutive image frames, morphological operations were then accustomed get a sky region mask. The atmospheric condition was recognized by victimization option like color, shape, texture, and dynamics.
Our goal is to classify an image with simple aspects. For indoor/outdoor classification, we compute features based on sub-blocks of the image instead of using features for the entire image. The process begins by detecting the sky region for an image from each camera. Next all images are converted from the RGB to Y Cb Cr color space and the Y component of each image is extracted. To estimate the sunrise and sunset. Finally, the latitude and longitude are obtained using the estimated sunrise and sunset.
Today with a large number of people depending on Internet technology for the help even to see how stuff work, etc. So there should be enhanced results which are otherwise best provided by Google only.
© 2016, IRJET | Impact Factor value: 4.45 | ISO 9001:2008 Certified Journal | Page 928
•
None of the search engines, not Google support the one of the ignored but applicable aspect of searching, i.e.,image searching with image as a source for searching. Firstly, the verification pictures square measure designed to cover within the generic share pictures instead of appending with them to keep up additional verification shares.
•
Related work
In[1] authors has drawn significant research attention. It considered as a part of the Internet of the future and will cover billions of intelligent communicating "things". The future of the Internet will consist of heterogeneously attached machines that will further extend the borders of the world with physical entities and virtual components. It will empower the connected things with new capabilities. In this survey, the definitions, architecture, fundamental technologies, and applications of IoT are analytically reviewed. Firstly, various definitions of IoT are introduced; second, emerging techniques for the utilization of IoT are discussed; thirdly, some open issues related to the IoT applications are explored; finally, the larger challenges which need addressing by the research community and corresponding potential solutions are investigated. In[2] authors used as an umbrella keyword for covering various aspects related to the direction of the online network and the Web into the physical realm, by means of the widespread deployment of spatially divided machines with embedded identification, sensing and/or actuation capabilities. Internet-of-Things envisions a future in which digital and physical entities can be joined, by means of appropriate information and communication technologies, to implement a whole new class of applications and services. In this article, we present a survey of technologies, applications and research challenges for Internet-of-Things.In[3] authors written by a team of analysts from the Strategy and Policy Unit (SPU) of the ITU, the report takes a view at the next step in "always on" communications, in which new technologies like RFID and smart computing compact a world of networked and interconnected devices that provide relevant content and instruction whatever the location of the user. Everything from tires to toothbrushes will be in communications range, heralding the dawn of a new era, one in which today’s online network (of data and people) gives way to tomorrow’s Internet of Things.In[4] This paper presents a cloud centric vision for worldwide implementation of Internet of Things. The key sanctioning automations and application domains that are likely to drive IoT research in the near future are discussed. A cloud performance using Aneka, which is based on interaction of private and public clouds is presented. We conclude our IoT vision by dividing on the need for concurrance of WSN, the Internet and distributed computing directed at technological research community.In[5] Edge-based detection of sky regions in images for solar exposure prediction”, A machine for predicting the solar exposure at a location achieve by gathering image data from that location with a known camera situation. The image data is then processed to analyze the sky regions and the solar exposure is predicted using a standard sun path model and finding the rays from the sun over the processed images. Critical to the success of this technique is the image processing used to sprite the sky from the rest of the image. This work is concerned with developing a approach which can do this for images taken under defend weather conditions. The general approach to separate the sky from the break of the image is to use the Canny edge detector and the morphology closing algorithm to find the regions in the image. The light and area of each region are then used to determine which regions are sky. The Flood Fill mathematical model is applied to identify all pixels in each sky region.
•
Proposed algorithm
• Design Considerations:
Sunrise/Sunset Estimation.
Sky Region Detection.
Sunrise/Sunset Detection.
• Description of the Proposed Algorithm:
Aim of the proposed algorithm is to find the sunrise/sunset,day of length and local noon from the day/night images captured from the web camera. The proposed algorithm is consists of three main steps.
• Gray scaling of image.
• Thresholding of image.
• Visual Cryptography.
© 2016, IRJET | Impact Factor value: 4.45 | ISO 9001:2008 Certified Journal | Page 929
Description of the Proposed Algorithm:Aim of the proposed algorithm is to find the sunrise/sunset,day of length and local noon from the day/night images captured from the web camera. The proposed algorithm is consists of three main steps.
Step 1: Sunrise/Sunset Estimation:
Sunrise and sunset are often obtained by classifying every image from the web camera with the label “Day” or “Night.” one in every of the factors that may be used for sleuthing Day/Night is that the brightness of the image. In [11], the mean of the combined RBG parts were wont to notice Day. In our work, we tend to use the luminousness to live the brightness of the image. We tend to 1st convert from the RGB to Y CbCr color house and use the Y element to get the common luminousness. We tend to assume that a picture with massive luminousness tends to be Day. We’ve got unheeded camera AGC effects. we tend to acknowledge that this introduces error in our estimates for sunrise and sunset due the actual fact that the photographs are” brighter” than traditional. In our operational situation we’ve got no management of this therein we tend to cannot shut down the camera AGC.
SUNRISE/SUNSETALGORITHM: Source:
Almanac for Computer published by Nautical Almanac Office
United States Naval Observatory Washington, DC 20392.
Inputs:
day, month, year: date of sunrise/sunset latitude, longitude: location for sunrise/sunset zenith : Sun's zenith for sunrise/sunset offical = 90 degrees 50'
civil = 96 degrees nautical = 102 degrees astronomical = 108 degrees
1. first calculate the day of the year
N1 = floor(275 * month / 9) N2 = floor((month + 9) / 12)
N3 = (1 + floor((year - 4 * floor(year / 4) + 2) / 3)) N = N1 - (N2 * N3) + day - 30
2. convert the longitude to hour value and calculate an approximate time/
lngHour = longitude / 15 if rising time is desired: t = N + ((6 - lngHour) / 24) if setting time is desired: t = N + ((18 - lngHour) / 24)
3. calculate the Sun's mean anomaly
M = (0.9856 * t) - 3.289
4. calculate the Sun's true longitude
L = M + (1.916 * sin(M)) + (0.020 * sin(2 * M)) + 282.634
© 2016, IRJET | Impact Factor value: 4.45 | ISO 9001:2008 Certified Journal | Page 930
5a. calculate the Sun's right ascensionRA = atan(0.91764 * tan(L))
NOTE: RA potentially needs to be adjusted into the range [0,360) by adding/subtracting 360
5b. right ascension value needs to be in the same quadrant as L
Lquadrant = (floor( L/90)) * 90 RAquadrant = (floor(RA/90)) * 90 RA = RA + (Lquadrant - RAquadrant)
5c. right ascension value needs to be converted into hours
RA = RA / 15
6. calculate the Sun's declination
sinDec = 0.39782 * sin(L) cosDec = cos(asin(sinDec))
7a. calculate the Sun's local hour angle
cosH = (cos(zenith) - (sinDec * sin(latitude))) / (cosDec * cos(latitude))
if (cosH > 1)
the sun never rises on this location (on the specified date) if (cosH < -1)
the sun never sets on this location (on the specified date)
7b. finish calculating H and convert into hours
if if rising time is desired H = 360 - acos(cosH) if setting time is desired: H = acos(cosH)
H = H / 15
8. calculate local mean time of rising/setting
T = H + RA - (0.06571 * t) - 6.622
9. adjust back to UTC
UT = T - lngHour
NOTE: UT potentially needs to be adjusted into the range [0,24) by adding/subtracting 24.
10. convert UT value to local time zone of latitude/longitude
localT = UT + localOffset
Step 2: Sky Region Detection:
© 2016, IRJET | Impact Factor value: 4.45 | ISO 9001:2008 Certified Journal | Page 931
of sky region is employed to predict the star exposure. They describe a general approach to separate the sky from the remainder of the image by decisive the sting of the sky region. The accumulative frame distinction between a picture and also the sequent image is employed to extract the sky region in [14].The sky is assumed to be at the highest of image and also the clouds area unit dynamic. Victimization this technique needs many sample pictures to discover the sky region. Also, it's valid only the sample images area unit Day pictures since the tactic is predicated on the very fact that the sky is dynamic compared to the foreground objects. We have a tendency to propose a unique approach to discover the sky region by victimization one image of a transparent sky. By clear-cut sky we have a tendency To mean no clouds within the sky and in our initial experiments this image was manually chosen.
The sky detection approach we used is then:
• Extract an image from the blue channel of the camera.
• Use the Canny edge operator to find edges. This will create as binary image or edge mask where edge pixels are set to 1.
• Use morphological filtering (dilation) to close gaps in the boundaries of the edge mask.
• Invert the dilated binary image (edge mask) where the boundary pixels are inverted from 1 to 0 and the surface pixels are inverted from 0 to 1.
• Find the largest connected region at the top of the binary image: • Find all the connected components in the binary image.
• Sort the connected components with respect to the number of pixels contained in descending order.
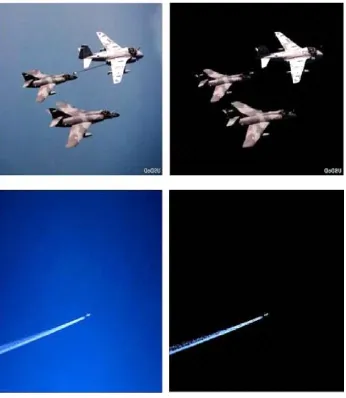
• For each of the connected components check the location of each connected component to determine whether it is at the top part of the image. If the connected component is at the top part of the image, select it as the sky region and if not, go to the next largest connected component. Repeat until the sky region is found. The results of using the above sky detection technique are shown in Fig 1.
[image:5.595.213.386.408.607.2]The results of using the above sky detection technique are shown in Figure
Fig 1.Collection of images and sky mask,
SKY REGION DETECTION ALGORITHM
Input: captured image I for sky region detection.
Output: detected sky region.
Calculate the gradient image grad
© 2016, IRJET | Impact Factor value: 4.45 | ISO 9001:2008 Certified Journal | Page 932
bopt(x) with algorithm Energy function optimization algorithm.
Calculate border_ave and ASADSBP according to equations
Border-ave= (1)
ASADSBP= b(x)-b(x-1)
(2)
Test border_ave and ASADSBP according to equation(3).
(border_ave < thresh1) ∨ (border_ave < thresh2 ∧ASADSBP >thresh3) (3)
ifequation (3) is satisfied
There is no sky region in the image. return
else
Calculate diff_abs(x) according to equation (4).
diff_abs(x) = |b(x+1) − b(x)| (1 ≤ x ≤ W−1) (4)
Test diff_abs(x) according to equation (5).
diff_abs(x)>thresh4( [1,W−1]) (5)
ifequation (5) is satisfied
Recalculated the sky border position function
bnew(x) with algorithm Sky border position function recalculation algorithm.
Calculate the sky region with bnew(x) according to equation (6).
sky = {(x,y) | 1 ≤ x ≤ W , 1 ≤ y ≤b(x)} (6)
return else
Calculate the sky region with bopt(x) according to equation (6).
return endif endif
© 2016, IRJET | Impact Factor value: 4.45 | ISO 9001:2008 Certified Journal | Page 933
Where is the revolution angle, J is the day of the year, is the sun’s declination angle, D is the day length, and L is the Latitude. By numerically solving Eq.We can estimate latitude (L) from day length (D) and the day of the year (J). In this paper, the day length coefficient (p) was set to 6.0 to correspond to the day length definition which includes civil twilight. D is the time difference between the sunrise and sunset. Longitude can be estimated from local noon [15]. If we know UTC (Coordinated Universal Time) when the sun is at its highest point in the sky at a location on the Earth (local noon), then we can determine the time difference between the local noon and the noon in UTC. The time difference can be converted to longitude (l) since we know that the Earth approximately rotates 15 degrees per hour.
Where n is the local noon and u is the UTC offset for the local area. All the variables l, n and u are in unit of hours. The local noon can be approximately estimated from sunrise and sunset
Where t sunset and t sunrise are the local time of sunset and sunrise in hours. Since the earth rotation is nearly constant, we assume that at the middle of the sunrise and sunset, the sun is at its highest point is the sky.
•
RSESULT
The process begins by detecting the sky region for an image from each camera. The output of this process is the sky mask of each camera. Next all images are converted from the RGB to Y CbCr color space and the Y component of each image is extracted. The sky mask is then used for determining the mean sky luminance (Yskyi) for each image. After the Day or Night images are obtained, they are used to estimate the sunrise and sunset. Finally, the latitude and longitude are obtained using the estimated sunrise and sunset.
Parameter
Average
Image Quality • Clarity • Sharpness
•
Size of PixelGood
Time Duration Less
Use of Algorithm
• Sunrise/Sunset Algorithm
•
Sky Region DetectionAlgorithm complexity it is better. Depending upon time
Accuracy Of Output Good
© 2016, IRJET | Impact Factor value: 4.45 | ISO 9001:2008 Certified Journal | Page 934
CONCLUSION
We consider the issue of evaluating the rough area of a web cam by breaking down its pictures. We demonstrated that we could viably evaluate areas with under 2.4% slip for the longitude and under 5% mistake for the scope. In future work we will explore how we can adjust for camera AGC impacts and fine grained transient estimations. We anticipate utilizing web cams to identify climate conditions and different sorts of ecological observing. We are keen on collecting these estimations more than 10s of a huge number of openly accessible web cams. This is an extremely fascinating huge information issue.
•
Reference
[1] L. Atzoria, A. Ierab, and G. Morabitoc, “The Internet of Things: A survey,” Computer Networks, vol. 54, no. 15, pp. 2787– 2805, October 2010.
[2] D. Miorandi, S. Sicari, F. Pellegrini, and I. Chlamtac, “Internet of Things: Vision, applications and research challenges,”
Ad Hoc Networks, vol. 10, no. 7, pp. 1497–1516, September 2012.
[3] “ITU Internet Reports 2005: The Internet of Things,” International Telecommunication Union (ITU) Technical Report, November 2005.
[4] J. Gubbi, R. Buyya, S. Marusic, and M. Palaniswami, “Internet of Things (IoT): A vision, architectural elements, and future directions,” Future Generation Computer Systems, vol. 29, no. 7, pp. 1645–1660, September 2013.
[5] B. Guo, D. Zhang, and Z. Wang, “Living with Internet of Things: The emergence of embedded intelligence,” Proceedings of the Internet of Things (iThings/CPSCom), 4th International Conference on Cyber, Physical and Social Computing, pp. 297– 304, October 2011, Dalian, China.
[6] “Latitude and Longitude,” URL: http://nationalatlas.gov/.
[7] H. Read and J. Watson, Introduction to Geology. New York: Halsted, 1975, pp. 13–15.
[8] D. Sobel, Longitude: The True Story of a Lone Genius Who Solved the Greatest Scientific Problem of His Time, 10th ed. Walker & Company, 2007.
[9] P. K. Seidelmann, Explanatory Supplement to the Astronomical Almanac. University Science Books, 2005, pp. 32–33. [10] W. Forsythe, E. Rykiel Jr., R. Stahla, H. Wua, and R. Schoolfield, “A model comparison for daylength as a function of latitude and day of year,” Ecological Modelling, vol. 80, no. 1, pp. 87–95, June 1995.
[11] F. Sandnes, “A simple content-based strategy for estimating the geographical location of a webcam,” Proceedings of the 11th Pacific Rim Conference on Multimedia, vol. 6297, pp. 36–45, September 2010, Shanghai, China.
[12] N. Laungrungthip, A. E. McKinnon, C. D. Churcher, and K. Unsworth, “Edge-based detection of sky regions in images for solar exposure prediction,” Proceedings of the 23rd International Conference on Image and Vision Computing New Zealand (IVCNZ), pp. 1–6, November 2008, Christchurch, New Zealand.
[13] S. Kim, S. Oh, J. Kang, Y. Ryu, K. Kim, S. Park, and K. Park, “Front and rear vehicle detection and tracking in the day and night times using vision and sonar sensor fusion,” Proceedings of the IEEE/RSJ International Conference on Intelligent Robots and Systems, pp. 2173–2178, August 2005, Alberta, Canada.
[14] Z. Chen, F. Yang, A. Lindner, G. Barrenetxea, and M. Vetterli, “How is the weather: Automatic inference from images,”