© 2016, IRJET | Impact Factor value: 4.45 | ISO 9001:2008 Certified Journal
| Page 30
Statistical and Simulation analysis of Small Wind Power Forecasting for
House hold applications – A Case Study
G.R.K.D. Satya Prasad
1, Dr. Jagadish Panda
2, Srikant Misra
3, B. Vikram Amand
4Balramdas
5, N Ramakrishnan
61Asscoaite Professor, Department of Electrical Engineering, GIET, Gunupur, Orissa, INDIA
2Professor, Department of Computer Science and Engineering, GIET, Gunupur, Orissa, INDIA
3,4,Assisant Professor, Department of Electrical Engineering, GIET, Gunupur, Orissa, INDIA
5Asscoaite Professor, Department of Electrical Engineering, GIET, Gunupur, Orissa, INDIA
6 Final Year UG students, Dept. of Electrical Engineering, GIET, Gunupur, Orissa, INDIA
---***---Abstract –
The present global scenario is favouring towards renewable energy technologies due to the exhausting of fossil fuels, GHG emissions and global warming.
In this paper, a review has presented to how to plan a wind power technology for a building mounted wind turbines. Site measurement of wind speed requires time and money that often are not available for small micro-generation projects. Analysis of wind speed estimation for the selected area, local weather conditions can affect the planning of wind power plants in isolated areas.
To design wind turbines around numerous high-rise buildings with promising wind, this paper presents an integrated method of weather data and domain topography with technical analysis. This study demonstrates that how the wind power can be integrated in to Green buildings. Finally a study of feasibility of the wind turbine will be analyzed with technical parameters and its implementation.
Key Words: Green buildings, Homer software, Simulation,
small wind turbines.
1. INTRODUCTION
To lead a luxurious life in the present era the educated minds in the society have started adopting certain measures which lead to climatic change ,forest fires which further leads to increase in the emission of Co2 in the atmosphere .
The rapid increase in the population worldwide adversely reports in increase in the power demand and it has also resulted in the fast rate of depletion of fossil fuel reserves .At the same time the awareness in environmental degradation has given rise to the use of alternative approach the renewable source of energy like solar, hydro, geothermal, tidal and bio-energy. Out of these above mentioned clean energy sources Wind energy conversion has emerged as a boon in the recent years. The harnessing or trapping of wind power has become easier due to the recent advancement in the technologies with a cost effective plan which challenges the traditional methods. The wind power utilization is the answer to all the problems which are being encountered
globally and it is in the limelight to conserve the conventional energy source[1].
Wind Power
Wind constitutes air which varies in its excited state due to the change in the pressure and other environmental factors and it also carries kinetic energy with it. This kinetic energy is converted into mechanical energy and further to electrical energy by generation. The air circulates in the atmosphere due to the phenomena of non-uniform heating of the earth’s surface by the sun. The warm area where the air flows gets expanded and is forced upwards by the cool, denser air which flows in the surrounding area giving rise to wind [2]. The energy accessible in the wind varies as the cube of the wind speed; so it makes a challenging effort in understanding the characteristics of the wind resource and the prediction of the economical viability of wind projects by procuring the feasible wind turbines. The crystal clear fact is that there are many different climatic regions in the world and all the places have different wind variability. The topography has a major effect on the wind climate and it is obvious that more wind is experienced on the top of hills and mountains than in the bottom part .Moreover wind velocities significantly gets reduced by obstacles such as trees and buildings. As discussed earlier the power in the wind is proportional to the cube of the wind speed and is given by:-
Where: P = mechanical power ρ = air density(kg/m3)
A = area swept by the rotor blade. V = velocity in air(m/sec)
ρ is proportional to A and to the cube of the wind speed v. When we double (A) it may produce twice the power i.e doubling the wind speed produces eight times the power potential[3].
WIND POWER CONVERTORS
© 2016, IRJET | Impact Factor value: 4.45 | ISO 9001:2008 Certified Journal
| Page 31
Horizontal axis wind turbine can be of two types:- Multi-blade type Wind Turbine
The rotor consists of multi blade and is fabricated from the blades that are curved in shape. From the center the width of the blade increases. In modern advancement of technology the rotor is used to drive the reciprocating pump which is usually placed over the well. Therefore the large number of blades provide a high torque which is further required for driving the centrifugal pump even at low speed of wind. Propeller type Wind Turbine
There are two or three aerodynamic blades connected to the propeller type rotor which are made strong from light weight material. The aerodynamic theory which is used for designing purposes in aircraft is implemented in the design of blade slope [4].
Vertical axes Wind Turbines are of two types:- Savonius Rotor
It consists of two hollow semi-cylinder fixed to a vertical axis. The cylinders are so placed that they look like in a “S” type structure. The rotor rotates due to pressure difference between the two sides even if the wind flows in the opposite direction.
Darrieus Rotor
Thin curved blades of flexible metal stripes are arranged in such a way that it looks like an egg beater and it will operate with wind coming from any direction.
1.1 Site Selection Process
A comprehensive set of factors and balancing of multiple objectives are considered for site selection of large wind turbine. A complex array of critical factors drawing from physical, demographical, economic, policies and environment disciplines Geographic Information System (GIS) is considered as useful computer based tools for spatial description and manipulation .GIS forms the basis of decision support system.
Multi Criteria Decision Methods (MCDM) is the techniques adopted in the various approaches of decision analysis. These are represented by various quantities, weighting scheme, constraints, goals, utilities and other parameters MCDM results are used to map the spatial extent of the best areas or index of land suitability [5].
1.2 Selection of Wind Turbine Generator
The limiting factor in wind turbine lies in their generator technology. There are mainly 3 types of wind turbine generators which are DC, AC Synchronous and AC asynchronous. All these can be run at fixed or variable speed. As we know that wind power is fluctuating in nature so it is advantageous to operate the generator at variable speed which will reduce the physical stress on the blades of the turbine, which will improve the aerodynamic efficiency.
After careful study of the possibility of wind generation in the locality with the use of NASA website the exact wind turbine can be procured this will be the most suitable one.
After careful study of the possibility of generation of solar and wind power; there is plenty of potential is there in GIET campus. For this a proto type solar-wind hybrid system is planned and analyzed with simulation approach. With some basic research on best suitable wind turbine to our project model we have selected a 400w with the following technical specifications
A 1 kw solar PV power generation system has been installed in administration block with the following specifications. A complete load survey also conducted to know the load pattern of 1 kw solar PV system. After collecting the data from various sources we have calculated and analyzed the load pattern and load curves of various rooms and checked with HOMER software for accuracy. To check the validity of wind power in GIET campus a 400 W of wind turbine has to be erected for experimental purpose. After observing one year data a decision has to be taken for the installation of 100 kw wind power plant in GIET campus.
1.3 ENERGY AUDITING AND LOAD SURVEY PROCESS
For the installation of solar panel we took energy audit and details have taken by batch No. 10 in order to calculate the number of loads and its power consumption. Here we considered all types of loads such as lights, fans etc. in administration block.
[image:2.595.304.566.614.791.2]
By taking the account of monthly wise we observe that there is more power consumption in between February to May due to summer season. From august to December there is moderate power consumption due to winter season and puja vacation. From May to June there is summer vacation, so at that time we consume less power. January, June and July are the months in which exams take place, so less power consumption take place than other months. By analyzing and taking the above data we simulate it through HOMER software.
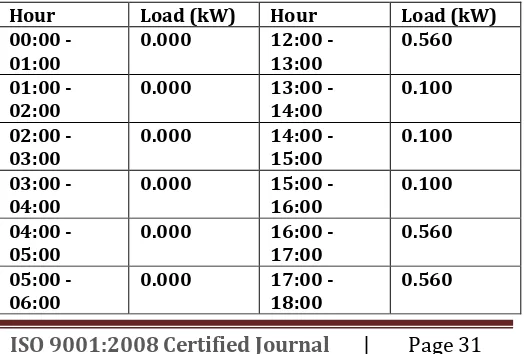
Table 1: Daily load pattern at administration block
Hour Load (kW) Hour Load (kW) 00:00 -
01:00 0.000 12:00 - 13:00 0.560 01:00 -
02:00 0.000 13:00 - 14:00 0.100 02:00 -
03:00 0.000 14:00 - 15:00 0.100 03:00 -
04:00 0.000 15:00 - 16:00 0.100 04:00 -
05:00 0.000 16:00 - 17:00 0.560 05:00 -
© 2016, IRJET | Impact Factor value: 4.45 | ISO 9001:2008 Certified Journal
| Page 32
06:00 -
07:00 0.000 18:00 - 19:00 0.560 07:00 -
08:00 0.000 19:00 - 20:00 0.300 08:00 -
09:00 0.100 20:00 - 21:00 0.300 09:00 -
10:00 0.560 21:00 - 22:00 0.100 10:00 -
11:00 0.560 22:00 - 23:00 0.000 11:00 -
12:00 0.560 23:00 - 00:00 0.000
[image:3.595.310.558.180.316.2]2. Modeling hybrid system with Homer software
Fig No. 1 Home page of homer
Home page of homer
[image:3.595.36.270.290.423.2]At first we have to click on the add or remove bar for choosing our equipment. A lot of equipment are shown in a window which is appeared like Fig No: 1. We have to choose equipment according to our requirements. As per our requirements we take one primary load, one converter, one battery, one PV, wind and a Grid. The below Fig No. 6.2will shows how to add or remove equipment for simulating purposes.
Fig No. 2 Add or remove equipments for simulating purposes
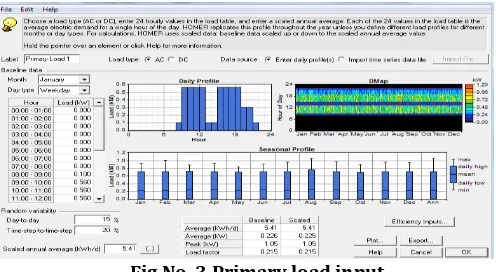
Primary load input
Here we have to first choose type of load. The load type is AC. After that 24 hourly values entered in the load table of every month. Each of 24 values in the load table is the average electric demand for a single hour of the day. The above Fig No. 6.3 show how the primary load gives result.
Fig No. 3 Primary load input
PV input
PV is one of the equipments we select. Here we have to put size of the PV according to peak load. We have to also enter the cost and replacement value according to the size of PV. Here we got the curve between cost and size. The above Fig No. 5.4 shows that, its life time is 20 years.
Fig No. 4 PV input
Solar resource input:
Fig. 5 Solar Resource at Gunupur
© 2016, IRJET | Impact Factor value: 4.45 | ISO 9001:2008 Certified Journal
| Page 33
Latitude
The latitude specifies your location on the earth's surface. it is an important variable in solar calculations. it is used when calculating radiation values from clearness indices, and vice versa. it is also used to calculate the radiation incident on a tilted surface.
Baseline data
The baseline data is the set of 8,760 values representing the average global solar radiation on the horizontal surface, expressed in kwh/m2, for each hour of the year. Homer
displays the monthly average radiation and clearness index of the baseline data in the solar resource table and graph. There are two ways to create baseline data: you can use homer to synthesize data, or you can import hourly radiation data from a file.
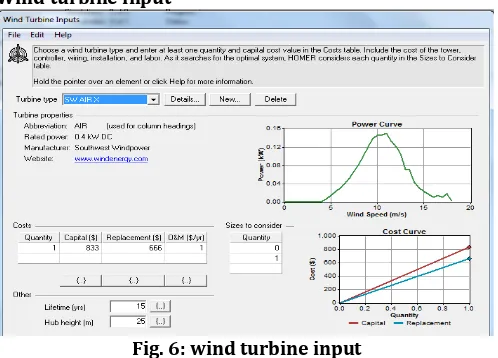
[image:4.595.38.287.294.473.2]Wind turbine input
Fig. 6: wind turbine input
Wind turbine model has selected according to the company’s quotation. A 400 w wind turbine has selected for the excremental purpose.
NASA website database of Gunupur area will provide exact information on wind speed. Table 2 shows the monthly wise data of wind speed in Gunupur.
Table 2: NASA data base of Gunupur wind speeds
Month Air
temperature Relative humidity Wind speed
0C % m/s
January 21.7 56.7% 2.8
February 24.0 60.4% 3.0
March 26.9 58.8% 3.6
April 28.2 64.5% 3.9
May 28.8 70.0% 3.6
June 28.3 78.0% 3.8
July 27.4 81.0% 4.0
August 27.1 81.4% 3.8
September 26.8 80.5% 2.9
October 25.7 74.9% 2.9
November 24.0 60.3% 3.5
December 22.0 52.5% 3.2
Average 25.9 68.3% 3.4
Wind penetration at Gunupur
3. SIMULATION OUTPUT REPORT
System architecture
Cost summary includes all the expenditure throughout the project. It includes total net present cost; cost of energy and Operating cost details is given. Cost summary also includes cash flow summary which gives detail information about PV, grid, battery and converter net present cost. Here different color shows different net present cost of PV, grid, battery and converter which includes capital, replacement, and operating, fuel and salvage cash flow.
Electrical power production and consumption
© 2016, IRJET | Impact Factor value: 4.45 | ISO 9001:2008 Certified Journal
| Page 34
Below result shows monthly average electric power production in a year. Here PV is represented in yellow color and grid is represented in gray color. Here colors represent PV and grid power consumption in kw every month.
Here, the wind turbine power generation is very low comparing to its cost. If the wind turbine capacity is more the number of units generated will be more. As a rule of thumb; If a 5kw wind turbine preferred; then the number of specific units generated will be much more than the 400 w unit. Hence they pay back period will be less.
4. Conclusion
The accurate assessment of solar and wind potential for an area requires both the knowledge of probability density function and the power density of both solar and wind. For this purpose, for the area of interest are required databases that to contain direct measurements of solar and wind parameters recorded during at least one year. But, Site measurement of these information requires time and money that often are not available for small micro-generation projects. Analysis of solar power availability and wind speed estimation for the selected area, local weather conditions can affect the planning of hybrid systems. This multiplicity of factors makes it difficult to generalize a wind resource estimation methodology for the solar assisted hybrid system which is integrated with wind.
In this paper an analysis has being carried out with a 1 kW solar PV system and 400 w wind turbine is going to be installed at GIET campus. By analyzing all factors with simulation software called Homer a complete economic analysis methodology has been suggested. The results obtained are very encourageable to plan for further future projects.
REFERENCES
1. G.R.K.D. Satya Prasad “Design Of Standalone hybrid Biomass & PV system of an off grid house in a remote area” in International Journal of Engineering Research
and Application, vol3,issue6,NovDec 2013 , pp433 -437
2. G.R.K.D. Satya Prasad “Energy and Comfort Management in Energy Efficient Buildings Using RETSCREEN Software-A Case Study Analysis” in International Journal of Engineering Research and Application ISSN: 2248-9622, Vol. 3, Issue 6, Nov-Dec 2013, pp.378-381 3. G.R.K.D. Satya Prasad “Hybrid Solar-Kitchen waste based
plant for Green buildings: An approach to meet the standards of Zero energy buildings” International Research journal of Engineering and Technology” Vol. 2, Issue 8, Nov- 2015 pp.1335-1340
4. Linden, D. (2002) Handbook of batteries and fuel cells, Mcgraw-Hill, New York.
5. Mahmoud, M.M. (1989) Individual Applications of Photovoltaic Power Systems, Royal Scientific Society Amman, Jordan.
6. Zahedi, A. (1998) Development of an electrical model for a PV/battery system for performance prediction, Renewable Energy, 15(1998), pp. 531-534.
7. Posadillo, R. and Lopez Luque, R. (2007) A sizing method for stand-alone PV installations with variable demand, Renewable Energy, 33(2008), pp. 1049-1055. 8. IEEE 1361TM-2003 IEEE Guide for Selection, Charging, Test and Evaluation of Lead-Acid Batteries Used in Stand-Alone Photovoltaic (PV) Systems.
9. Hara, R., Kita, H., Tanabe, T., Sugihara, H., Kuwayama, A. and Miwa, S. (2009) Testing the technologies, IEEE Power Energy Magazine, 7(3), pp. 77-85.
10. Yoshimoto, K., Nanahara, T. and Koshimizu, G. (2006) New control method for regulating state-of-charge of a battery in hybrid wind power/battery energy storage system, Proceedings IEEE PES Power Systems conference and Exposition, pp. 1244-1251.
11. https://eosweb.larc.nasa.gov/sse/
12. Kalogirou, S.A. (2000) Artificial neural networks in renewable energy systems applications: a review, Renewable and Sustainable Energy Reviews, 5, pp. 373-401.
13. Balzani, M. and Reatti, A. (2005) Neural Network Based Model of a PV Array for the Optimum Performance of PV System , Proceedings PhD Research in Microelectronics and Electronics Conference, 2, pp. 123-126.
14. Sulaiman, S.I., Abdul Rahman, T.K. and Musirin, I. (2008) ANN-based Technique with Embedded Data Filtering Capability for Predicting Total AC Power from Grid-connected Photovoltaic System, 2nd International Power Engineering and Optimization Conference (PEOCO2008), pp. 272-277.
15. Sulaiman, S.I., Musirin, I. and Abdul Rahman, T.K. (2008) Prediction of Total AC Power Output from a Grid- Photovoltaic System Using Multi-Model ANN, 7th WSEAS International Conference on Application of Electrical Engineering (AEE08), pp. 118-123.
Particulars Cost
Total system cost 1,48, 000 Rs/-
After subsidy 1,03,600 Rs/-
No. of units generated from
solar panel 1527 kwh
No. of units generated from
wind turbine 84.5 kwh
Each unit rate by considering maximum demand rate and diesel generator option.
9 Rs/-
Total revenue from solar
power 1612 × 9 = 14508 Rs/- year Payback period 10 years (without