International Journal of Emerging Technology and Advanced Engineering
Website: www.ijetae.com (ISSN 2250-2459, ISO 9001:2008 Certified Journal, Volume 3, Issue 1, January 2013)
536
Unbalanced Power Flow Analysis in a Micro Grid
Thai Hau Vo
1, Mingyu Liao
2,
Tianhui Liu
3, Anushree
4, Jayashri Ravishankar
5, Toan Phung
6, John Fletcher
7
School of Electrical Engineering and Telecommunications, The University of New South Wales, Sydney, Australia
Abstract— This paper reviews different approaches for
unbalanced load flow analysis within a distribution network, especially in a microgrid (MG). Models of untransposed distribution lines and unbalanced loads are considered for each methodology, as these are common in a MG scenario. Various commercial software packages are also investigated and assessed in terms of solving the power flow of the MGs and to decide on reliable tools for further studies. Different case studies are simulated to illustrate the results obtained using sequence frame and phase frame power flow methodologies for a given MG.
Keywords— DIgSILENT, distributed generation, microgrid, software tools, unbalanced power flow
I. INTRODUCTION
The concept of microgrid (MG) has been considered by researchers more frequently in recent years, due to its role in driving modern power systems to achieve clean energy generation [1]. MGs operate in two different modes, namely interconnected and islanded modes. In the former mode, the Distributed Energy Sources (DERs) in the MG contribute to the majority of the demand within the MG and the difference in supply and demand is made available from the utility; while in the latter mode, DERs supply reliable and economical energy serving different loads like residential buildings, commercial buildings and industrial parks [2].
In a MG scenario, balanced power flow analysis may not be adequate due to a number of unbalanced aspects like single-phase load, un-transposed conductors or mix of balanced and unbalanced components [3]. While distribution networks are often configured as radial feeders which are fed from a substation, MG is described to be a completed network with various components like generators, loads, shunt devices and conductors with radial or ring-bus layout. Similar to general distribution networks, MGs are often composed of single-phase medium/low voltage and unbalanced consumer loads. It is obvious that balanced system analysis tools used for transmission networks cannot be applied to this new type of electricity grid. Hence, an accurate and reliable tool for MG power flow analysis is desirable.
In practice, power flow study is a numerical analysis utilizing approximate models of a real physical system to examine normal steady state and contingency conditions in an electrical system.
Calculation methods are selected based on characteristics and topologies of a given network or preferred reference frame. The power flow equations are non-linear equations and therefore iterative methods must be utilized in solving the equations.
For unbalanced system analysis, two methods of load flow are in use, namely, the phase-frame approach and the sequence-frame approach. The sequence-components approach is based on symmetrical sets of balanced phasors, positive, negative and zero sequences, wherein three unbalanced phases are converted to three independent balanced circuits [4]. This approach works better on general network topologies with synchronous generating units due to reduction of size and the computational burden as compared to the phase-frame approach [5-7]. One main advantage of this approach arises from the fact that the three sequence networks have weak coupling leading to the system state equations that can be solved using parallel programming [8].
A more common and intensively used approach is phase-frame based method, which analyses each phase of unbalanced system independently and then combined together to form the completed state parameters of phase A, B, C. For each topology of network, calculation method should be appropriately selected. Radial networks use the forward-backward sweep method [9] while weakly meshed grids use the compensation method [10]. System state equations can be solved using Newton-Raphson and Gauss and/or Gauss-Seidel methods. Ill-conditioned cases need to be carefully considered in these approaches due to the higher resistance/reactance (R/X) ratio of the lines [11].
In most distribution power flow calculations, the loads are often modeled as a constant power, as voltage drop along a short distance is assumed to be less significant. However, in reality, this is not valid because in distribution systems bus voltages are not controlled. Hence, the general loads are to be modeled as constant power, constant current, constant impedance or a mix of these three types.
International Journal of Emerging Technology and Advanced Engineering
Website: www.ijetae.com (ISSN 2250-2459, ISO 9001:2008 Certified Journal, Volume 3, Issue 1, January 2013)
A brief assessment of commercial tools dealing with unbalanced three-phase systems is then described in section III. Case studies are carried out in section IV to prove that different calculation approaches can achieve comparable results for a given MG model. Finally, section V proposes the potential software candidates that offer flexibility in analyzing MG networks.
II. SYSTEM MODELING
There are four main components within a MG, namely, generators, distribution lines, transformers and loads. While generators and transformers can be considered relatively balanced under normal operation, distribution lines and loads are the main causes for the unbalance of power flow. This section, therefore, focuses on these two components.
A. Distribution Lines
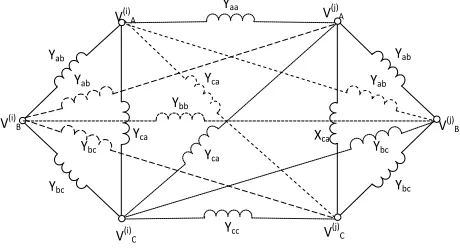
Based on the reference frame, the model of distribution lines are represented differently. For phase-frame approach, with full mutual couplings between a line section, the well-known admittance model between node (i) and node (j), is shown in Fig. 1 [4].
Yab
Ybc
Yca V(i)
A
V(i)B
V(i) C
Ybc Yab
V(j) C
V(j)B V(j)
A
Xca
Yca Yab
Yca
Ycc
Ybc Yab
Ybc
[image:2.612.332.573.259.342.2]Ybb Yaa
Fig. 1: Equivalent admittance of lines (phase frame)
Relation between voltage of node (i), node (j) and current via two nodes for power flow calculation is,
[ ] [
] [
] (1)
For the general case of unbalanced N-node system, the mutual impedances are such that,
and, (2)
Each node contains four variables (P, Q, V, θ), two of which are known and the remaining two are unknowns.
In case of balanced systems, the number of equations to be solved is 2N. This figure significantly increases to 6N nonlinear simultaneous equations for full mutual couplings in the system leading to burden in computation.
Another common approach is sequence frame, which is often applied to unbalanced fault analysis using symmetrical components through which, any unbalanced 3-phase system can be converted to three sets of symmetrical balanced systems. The sequence frame approach with unbalanced distribution section between two nodes (i) and (j) is modeled as in Fig. 2 [12].
[Y012 series]
Bus j Bus i
Y/2 shunt Y/2 shunt
I012
V(i) 012
V(j) 012
Fig. 2: Equivalent admittance of lines (sequence frame)
Relation between voltage and current is now shown as,
[
] [
] [ ] [
] [ ]
(3)
The given unbalanced network can be solved independently using three balanced sequence networks. The final result for a node is then combined using the three components. It is obvious that for a given unbalanced three-phase N-node system, there are 12N variables in total (4N for each sequence), among which, 6N variables are known and 6N unknown, requiring a set of 6N nonlinear simultaneous equations to be solved.
B. Loads
The loads will consume active and reactive power at a nominal frequency. This power varies according to voltage and frequency at the node to which the loads are connected. With the assumption that the system frequency is far more stable than voltage, this paper will consider only the load model depending on voltage. Relation between power and voltage is shown as,
[ ( ) ( ) ( ) ] (4a)
[ ( ) ( ) ( ) ] (4b)
where,
[image:2.612.53.283.387.513.2]International Journal of Emerging Technology and Advanced Engineering
Website: www.ijetae.com (ISSN 2250-2459, ISO 9001:2008 Certified Journal, Volume 3, Issue 1, January 2013)
538 At a given node, there are different types of loads connected. The coefficients a, b and c define proportions of constant impedance load, constant current load and constant power load respectively at a node. For constant power and constant current loads, the model of passive source injection is used to describe response of load under various voltages, while for constant impedance load the model of distribution lines with admittance matrix is used. Fig. 3 shows the response of different types of loads to system voltage.
Fig. 3: Relation between power and voltage of loads
III. TOOLS FOR UNBALANCED SYSTEM ANALYSIS
The concept of unbalanced power flow analysis is not new. A number of theoretical and practical works have been carried out to deal with different network topologies and operation modes based on different reference frames. There is no doubt that each approach has its own strengths and drawbacks. For example, phase frame based approach does not require any transformation from phase parameters or any simplifying assumptions but this method need to form a square Jacobian matrix of 6N x 6N to solve equations for an N-node system. This will lead to a computation burden as this matrix needs to be updated in every iteration [4]. In the sequence frame with 2N x 2N matrix, each sequence can significantly reduce the size of the Jacobian matrix and it can be beneficial as parallel computation technique is used. However, this approach requires a transform step from phase parameters to sequence parameters and then converts the results back from sequence to phase values; this process may accumulate significant calculation errors.
Both phase frame and sequence frame approaches use different approximation models for the same physical devices within an electric system. In general, both methods must give the same answer for state variables (P, Q, V, θ) of a given node.
This has been proven by several researchers on phase frame based and sequence frame based approaches [6, 8, 13]. However, when these approaches are applied for the analysis of MGs, there arises an additional difficulty, as MGs are inherently unbalanced due to changing loads and generations. This leads to the difficulties in power flow calculation for real-time MG operation, monitoring, protection coordination, expansion plan or maintenance. Presence of nonlinear loads, active sources or smart devices makes the power flow analysis in a MG even more complex. Therefore, the need of a powerful and reliable tool to manage MG analysis is obvious. Balanced system power flow analysis is quite common in commercial software tools; however, not all software tools can handle unbalanced systems. This paper gives an overview of three well-known software packages with friendly interactive interfaces that can deal with unbalanced MG operation, namely, PSCAD, DIgSILENT Power Factory and PSS/Adept.
Power System Simulator Advanced Distribution Engineering Productivity Tool (PSS/ADEPT) is a distribution system analysis program developed by Power Technologies, Inc. (PTI) for planning, designing, and analyzing distribution systems. Although another software package distribution (PSS®SINCAL) has been produced by PTI, it is still a popular software package for distribution operator all over the world [14]. PSS/Adept has a friendly graphical user interface for engineers to add, edit or remove all electric device models on workspace. From the point of view of operation engineers, it is a helpful tool for power flow analysis, short-circuit analysis, motor starting analysis, capacitor optimization, tie open point optimization, and predictive reliability analysis. However, if further analytical consideration is required, such as fully coupled impedance matrix in three phase system, it may not be a promising candidate.
PSCAD® is a simulation software for the design and verification of power systems. PSCAD® is also known as PSCAD®/EMTDC™ because EMTDC™ is the simulation engine, which is now the integral part of PSCAD® graphical user interface. PSCAD® is a powerful analyzing tool for simulating time domain instantaneous responses in both electrical and control systems with visual online controllers for user to adjust the parameters while running [15].
DIgSILENT Power Factory is a transmission and distribution network analysis tool with the capability to simulate wide range of power electronic devices, renewable energy plants and fully coupled conductor models [16]. It is a helpful combination of easy-to-use software for engineers (i.e., PSS/ADEPT) and a novel tool for researcher (i.e., PSCAD).
40 60 80 100 120 140 160 180
80 90 100 110 120
P
er
ce
n
ta
g
e
L
o
ad
(
%)
Percentage Voltage (%)
[image:3.612.59.305.251.408.2]International Journal of Emerging Technology and Advanced Engineering
Website: www.ijetae.com (ISSN 2250-2459, ISO 9001:2008 Certified Journal, Volume 3, Issue 1, January 2013) TABLE I
DISTRIBUTION SOFTWARE COMPARISON
Feature PSCAD DigSilent PSS/Adept
Balance/Unbalance Power Flow Yes Yes Yes
One/Three Phase Line Yes Yes Yes
One/Three Phase Load Model Yes Yes Yes
Full Coupling Mutual Impedance Yes Yes -
Unbalanced Load Model Yes Yes Yes
Power Electronics Element Yes Yes -
Fault Analysis Yes Yes Yes
Transient start analysis Yes Yes Limited
DC Load Flow Limited Yes -
Small signal analysis (eigenvalues) Yes Yes -
Static and dynamic voltage stability Yes Yes
VAR/STATCOM Yes Limited -
Wind/Solar Panel Yes Limited -
Harmonics, flicker and resonance analysis
Yes Yes Yes
Tie Open Point Optimization Limited Yes Yes
Capacitor Placement Optimization Limited Yes Yes
Protection and coordination Yes Yes Yes
Summary of these distribution software packages is listed in Table 1 highlighting the main functions for unbalanced power flow. It is to be noted that these software packages use phase frame approach for unbalanced power flow analysis, as the computation burden can be overcome by using powerful computers nowadays. In summary, from network operators’ points of view, PSS/Adept seems to be the suitable candidate with the capability to model hundreds of nodes easily to perform load flow analysis or check contingencies of different conditions. PSCAD, on the other hand, has the strength of focusing on each component’s response not only during steady states but also during transient states. Thus, it might be the choice for electrical machine designers or researchers working on detailed level of electricity grid. However, DIgSILENT Power Factory is a promising alternative thanks to a novel combination between network analysis and component analysis packages. It contains array of pre-defined components, such as generators, transformers, cables or switching devices from different well-known manufacturers and has programming language support for users to develop their own models.
With wide range of built-in modules, DIgSILENT is able to conduct various studies from power flow, short-circuit, harmonics, flicker, stability, modal analysis and protection coordination. For unbalanced power flow studies, this software seems to be an effective potential tool and hence this software is used in this paper. The next section demonstrates the unbalanced power flow analysis using phase frame approach with the chosen software DIgSILENT Power Factory. The results are then compared to sequence frame approach for validation.
IV. CASE STUDIES AND SIMULATION
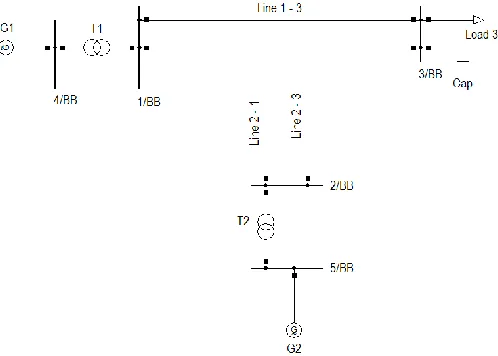
[image:4.612.42.296.143.454.2]In order to compare the convergence and accuracy of phase frame based and sequence frame based methodologies and to verify the validity of line models in Fig.1 and Fig. 2, the five-bus study system of Fig. 4 is selected and simulation is performed.
Fig. 4: Schematic of five-bus system
A. System Description
The five-bus system is a three-phase, four-wire, multi-grounded network that includes untransposed lines and balanced/unbalanced loads. This system is derived from an original transmission system [6] with the changes in voltage levels and base MVA [13]. It can be considered as a MG operating in islanded mode. The system is supplied by two DER units. G1 represents a three-phase synchronous generator that also serves as the system slack bus. G2 is another three-phase synchronous generator, which is modeled as a PV node that keeps voltage at 1.05 p.u. at bus 5.
[image:4.612.328.577.333.511.2]International Journal of Emerging Technology and Advanced Engineering
Website: www.ijetae.com (ISSN 2250-2459, ISO 9001:2008 Certified Journal, Volume 3, Issue 1, January 2013)
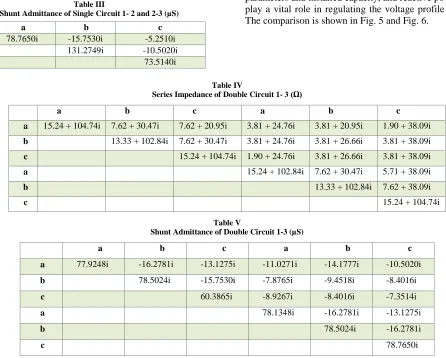
540 Using the voltage level 13.8kV and 100kVA as base, system parameters are given in Tables 2 to 5. From a technical point of view, G1 cannot be large enough to be the slack bus; however, for power flow analysis, at least one slack bus must be well defined. Hence, it is assumed that G1 can keep the voltage and angle of bus 1 constant. An unbalanced constant-power, star-connected load is connected at bus 3.
Table II
[image:5.612.79.525.294.652.2]Series Impedance of Single Circuit 1-2 and 2-3 (Ω)
Table III
Shunt Admittance of Single Circuit 1- 2 and 2-3 (µS)
B. Case Studies
Two case studies are performed with generator G2 set at different modes, either voltage regulated (PV mode) or fixed power injection (PQ mode). In the former mode, it is assumed that G2 is equipped with voltage regulator and active power controller while in the latter mode G2 is a regular generator with specific active and reactive output. The simulation is performed with DIgSILENT using phase frame method. The results obtained are compared with sequence based approach [6, 13].
For the first case, the voltage controller of the DER G2 unit regulates voltage of node 5 at1.05 p.u. For the second case, the DER G2 injects 0.6 p.u. active power and 0.2 p.u. reactive power at bus 5. In these simulations, transformer parameters and installed capacity, and reactive power of G2 play a vital role in regulating the voltage profile at nodes. The comparison is shown in Fig. 5 and Fig. 6.
Table IV
Series Impedance of Double Circuit 1- 3 (Ω)
a b c a b c
a 15.24 + 104.74i 7.62 + 30.47i 7.62 + 20.95i 3.81 + 24.76i 3.81 + 20.95i 1.90 + 38.09i
b 13.33 + 102.84i 7.62 + 30.47i 3.81 + 24.76i 3.81 + 26.66i 3.81 + 38.09i
c 15.24 + 104.74i 1.90 + 24.76i 3.81 + 26.66i 3.81 + 38.09i
a 15.24 + 102.84i 7.62 + 30.47i 5.71 + 38.09i
b 13.33 + 102.84i 7.62 + 38.09i
c 15.24 + 104.74i
Table V
Shunt Admittance of Double Circuit 1-3 (µS)
a b c a b c
a 77.9248i -16.2781i -13.1275i -11.0271i -14.1777i -10.5020i
b 78.5024i -15.7530i -7.8765i -9.4518i -8.4016i
c 60.3865i -8.9267i -8.4016i -7.3514i
a 78.1348i -16.2781i -13.1275i
b 78.5024i -16.2781i
c 78.7650i
a b c
a 78.7650i -15.7530i -5.2510i
b 131.2749i -10.5020i
c 73.5140i
a b c
a 12.57 + 106.65i 3.24 + 51.42i 2.29 + 39.99i
b 8.57 + 89.51i 2.67 + 41.90i
International Journal of Emerging Technology and Advanced Engineering
[image:6.612.61.288.279.394.2]Website: www.ijetae.com (ISSN 2250-2459, ISO 9001:2008 Certified Journal, Volume 3, Issue 1, January 2013)
Fig. 5: Case 1 Results (a) Sequence frame, (b) Phase frame
Fig 6: Case 2 Results (a) Sequence frame, (b) Phase frame
As can be seen from Fig. 5 and Fig. 6, the maximum error in phase voltage is less than 2% for case 1 and does not exceed 5% for case 2.
There are some minor differences between sequence frame and phase frame in the above case studies due to the slack bus reference models. In the sequence frame based approach, slack bus is assumed as a limited capacity while the phase frame considers node 4 a real slack bus. Other important factors that may differ the results are G2 reactive power limits and the transformer parameters with different configurations. Acting as a PQ node, G2 will inject a fixed capacity to a given node leading to its voltage value, mainly decided by the amount of reactive power injected. While in the PV generating mode, G2 only has capability to keep the voltage of connected node as close to pre-defined value as it can. Once the reactive power limits are reached, G2 no longer can regulate the voltage at the connected node.
Overall, this proves that phase frame based method gives nearly identical results as sequence frame based method for the different case studies considered here.
V. CONCLUSION
Although phase-frame and sequence frame can give the same results for unbalanced power flow in networks, phase-frame based methodology is more commonly adopted by software vendors.
Case studies suggest that DIgSILENT Power Factory is a sufficient and reliable software in terms of dealing with unbalanced power flow within MGs. Therefore, it can be concluded that DIgSILENT Power factory is a promising candidate for further work on distribution networks in general and smart micro grids, in particular.
REFERENCES
[1 ] G. Tambling, P. Laver, M. Oliphant, and N. Stevens. 2003. Renewable Opportunities: A Review of the Operation of the Renewable Energy (Electricity) Act 2000. Australian Greenhouse Office.
[2 ] M. Agrawal and A. Mittal. 2011. Micro grid technological activities across the globe: A review. Int. J. Res. Rev. Applied Sci, vol. 7, pp. 147-152, 2011.
[3 ] S. Khushalani, J. M. Solanki, and N. N. Schulz, "Development of three-phase unbalanced power flow using PV and PQ models for distributed generation and study of the impact of DG models". IEEE Transactions on Power Systems, vol. 22, pp. 1019-1025, 2007. [4 ] J. Das. 2007. Power System Analysis: Short-Circuit Load Flow and
Harmonics. CRC Press.
[5 ] M. Abdel-Akher, K. M. Nor, and A. H. A. Rashid, "Improved Three-Phase Power-Flow Methods Using Sequence Components" . IEEE Transactions on Power Systems, vol. 20, pp. 1389-1397, 2005. [6 ] K. L. Lo and C. Zhang, "Decomposed three-phase power flow
solution using the sequence component frame". Generation, Transmission and Distribution, IEE Proceedings C, vol. 140, pp. 181-188, 1993.
[7 ] M. Abdel-Akher, K. M. Nor, and A. H. Abdul-Rashid, "Development of unbalanced three-phase distribution power flow analysis using sequence and phase components". Power System Conference, 2008, pp. 406-411.
[8 ] M. Kamh and R. Iravani, "A unified three-phase power-flow analysis model for electronically-coupled distributed energy resources". Power and Energy Society General Meeting, 2011, pp. 1-1.
[9 ] W. H. Kersting. 2012. Distribution system modeling and analysis. CRC press.
[10 ]S.-Q. Hu and S.-M. Li. Unbalanced Load Flow for Weakly Meshed Distribution Systems with Distributed Generation. in Electrical and Control Engineering (ICECE), 2010, pp. 4513-4517.
[11 ]S. Khushalani and N. Schulz, "Unbalanced Distribution Power Flow with Distributed Generation". in Transmission and Distribution Conference and Exhibition, 2005/2006 IEEE PES, 2006, pp. 301-306.
[12 ] M. Z. Kamh. 2011. Component Modeling and Three-Phase Power-Flow Analysis for Active Distribution Systems. University of Toronto.
[13 ] M. Z. Kamh and R. Iravani, "Unbalanced Model and Power-Flow Analysis of Microgrids and Active Distribution Systems". IEEE Transactions on Power Delivery, vol. 25, pp. 2851-2858, 2010. [14 ] (2008). PSS/Sincal Guide [Product Brochure]. Available:
http://www.simtec-gmbh.at/files/SincalDesc-Eng.pdf
[15 ]PSCAD®: A comprehensive design and analysis environment. Available: https://pscad.com/products/pscad
[16 ] (2012). DigSilent: Power Factory. Available: http://www.digsilent.de/index.php/products-powerfactory.html 0.80
0.85 0.90 0.95 1.00 1.05 1.10
Node 1 Node2 Node 3 Node 4 Node 5
Vpu
Phase A (a)
Phase A (b)
Phase B (a)
Phase B (b)
Phase C (a)
Phase C (b)
0.80 0.85 0.90 0.95 1.00 1.05 1.10
Node 1 Node2 Node 3 Node 4 Node 5
Vpu
Phase A (a)
Phase A (b)
Phase B (a)
Phase B (b)
Phase C (a)