PAPER • OPEN ACCESS
Optimizing Blasting’s Air Overpressure Prediction
Model using Swarm Intelligence
To cite this article: Mohd Nur Asmawisham Alel et al 2018 J. Phys.: Conf. Ser. 995 012046
View the article online for updates and enhancements.
Related content
Application of Particle Swarm Optimization Algorithm for Optimizing ANN Model in Recognizing Ripeness of Citrus
Anis Diyana Rosli, Nur Sabrina Adenan, Hadzli Hashim et al.
-Prediction of hot deformation behavior of high phosphorus steel using artificial neural network
Kanchan Singh, S K Rajput, T Soota et al.
-A computation -ANN model for quantifying the global solar radiation: A case study of Al-Aqabah-Jordan
I M Abolgasem, M A Alghoul, M H Ruslan et al.
Optimizing Blasting’s Air Overpressure Prediction Model using
Swarm Intelligence
Mohd Nur Asmawisham Alel1*, Mark Ruben Anak Upom1, Rini Asnida Abdullah1 and Mohd Hazreek Zainal Abidin2
1 Department of Geotechnics and Transportation, Faculty of Civil Engineering,
Universiti Teknologi Malaysia, 81310 Johor Bahru, Johor, MALAYSIA 2
Faculty of Civil and Environmental Engineering, Universiti Tun Hussein Onn Malaysia, 86400 Batu Pahat Johor, MALAYSIA
E-mail: [email protected]
Abstract. Air overpressure (AOp) resulting from blasting can cause damage and nuisance to nearby civilians. Thus, it is important to be able to predict AOp accurately. In this study, 8 different Artificial Neural Network (ANN) were developed for the purpose of prediction of AOp. The ANN models were trained using different variants of Particle Swarm Optimization (PSO) algorithm. AOp predictions were also made using an empirical equation, as suggested by United States Bureau of Mines (USBM), to serve as a benchmark. In order to develop the models, 76 blasting operations in Hulu Langat were investigated. All the ANN models were found to outperform the USBM equation in three performance metrics; root mean square error (RMSE), mean absolute percentage error (MAPE) and coefficient of determination (R2). Using a performance ranking method, MSO-Rand-Mut was determined to be the best prediction model for AOp with a performance metric of RMSE=2.18, MAPE=1.73% and R2=0.97. The result shows that ANN models trained using PSO are capable of predicting AOp with great accuracy.
1. Introduction
Construction blasting refers to the controlled use of explosives for construction projects. It plays an important role in mining operations, road constructions and tunneling projects. It is cheaper and more economical compared to alternative means of rock excavation, such as ripping and mechanical breaking.
2
Maximum charge weight used per delay (MC) and distance from blast face (DI) are the two most commonly cited predictor variables for AOp [7]. Main components of AOp can be broken down into air pressure pulse (APP), gas release pulse (GRP), rock pressure pulse (RPP) and stemming release pulse (SRP) [8] [9] [10]. Disturbance to nearby communities are mostly attributed to SRP and GRP [9].
One commonly accepted method to predict AOp is an empirical model based on the cube-root scaled distance factor as suggested by the United States Bureau of Mines [4] [8] [11]. In the paper by Kuzu et al. [4], they used the USBM model to predict AOp using two parameters, DI and MC. All the prediction made using this method had errors levels of less than 7%.
Several scholars have also suggested the use of soft computing techniques (Artificial Neural Network (ANN), Support Vector Machines (SVM) and Genetic Algorithms (GA)) to predict AOp [2][3][12][13]. In this study, several ANN models based on swarm intelligence (SI) algorithm; particle swarm optimization (PSO) and multi swarm optimization (MSO) were utilized to predict AOp values resulting from blasting operations. In order to ensure the performance of the models are sufficient, USBM predictor equation for AOp was used as a benchmark for the prediction models.
2. Methods
2.1 USBM Equation
One of the most commonly used empirical equation to predict AOp is the USBM equation [4] [8]. The empirical equation employs the use of cube-root scaled distance factor (SD) as suggested by USBM [8]. The equation used to obtain SD is formulated as Eq. (1).
33 . 0
DW
SD
(1)where D is the distance from blast face (m or ft), W is the explosive charge weight (kg or lb). Meanwhile, the equation for prediction of AOp is formulated as Eq. (2).
(SD)
AOp (2)
where AOp is in the unit of dB. α and β are the site factors and can be determined by regression analysis.
2.2 Artificial Neural Network
Artificial neural network (ANN) is a type of computational model which attempts to mimic the vast network of neurons in the brain. A simple feedforward ANN is typically composed of three layers (input, hidden and output). In this study, the two inputs were MC and DI.
ANN is able to solve complex and highly non-linear problem where the use of traditional regression analysis is not suitable. This is because of the flexibility of ANN in tackling a linear or non-linear problem [14].
There are three fundamental components which can be used to define a network; architecture, transfer function and learning algorithm. In this study, a single hidden layer and fully connected network was used as the architecture and the (ReLu) function as the transfer function.
2.3 Particle Swarm Optimization
The particle’s movement are guided by the global best (pg) particle and local best (pi) particle. It is
described as a set of solutions moving in the search space with the aim to achieve the best position or solution [16]. The velocity, vi, for each particle are calculated using Eq. (3).
vi(t1)vi(t)c1r1[pi(t)xi(t)]c2r2[pg(t)xi(t)] (3)
where ω is the inertia weight, c1 and c2 are the acceleration coefficients, r1 and r2 are random numbers in range [0,1] and xi is thecurrent particle position. c1 and c2 were set to the value of 1.49445 as suggested by Clerc [17]. Meanwhile, the new position of each particle is updated using Eq. (4).
) 1 ( ) ( ) 1
(t x t v t
xi i i (4)
Meanwhile, multi swarm optimization (MSO) is a variant of PSO which utilizes multiple sub-swarms. The use of MSO can help prevent the swarm from converging on the wrong solution (local optima) especially in a multi modal environment [18]. The main difference is in the addition of an additional term for the swarm best, ps.
2.4 Inertia Weight
The inertia weight, ω is an important component of PSO and MSO. Its role is to balance the tendency between the global search and the local search [19]. Bansal et al. [20] investigated 15 inertia weight strategies and compared their performance based on 5 types of optimization problem. They concluded that the Chaotic Inertia Weight is the best for accuracy meanwhile the Random Inertia Weight is best in terms of efficiency. In this study, two types of inertia weight were used, Linear Decreasing Inertia Weight [21] and Random Inertia Weight [22].
2.5 Crossover and Mutation Operator
Inspired by the mechanism of GA, several mutation and crossover operators have been suggested for PSO. Løvberg et al. [23] introduced the use of a crossover operator, where the offspring of two randomly selected particles is calculated based on their parents.
Meanwhile, Higashi and Iba [24] proposed the use of a Gaussian mutation operator, where an offspring of two parent particles is mutated based on the current iteration multiplied by a random number in a Gaussian distribution. Utilization of these operators contributes to faster convergence and better solutions [25].
3. Model Development 3.1 Prediction Models
4
3.2 Normalization and Dataset Division
For the purpose of more efficient training time, it is important that the data used to train the PSO-ANN models to be normalized. The normalization was done according to Eq. (5).
min max
min
'
x
x
x
x
x
(5)where, x’ is the normalized value, x is data to be normalized, xmin is the minimum value in the range to be normalized xmax is the maximum value in the range to be normalized. Using this normalization method, all the data would be normalized into the range of [0,1]. Then, the whole dataset (76 data point) was divided into three sets; training (54 data point), validation (11 data point) and testing (11 data point).
4. Discussion of Results
In this study, 8 PSO-ANN models as well as an empirical equation as suggested by USBM were develop for the purpose of predicting AOp.
In order to evaluate the performances of each models and equation on the testing set, three performance metrics were used; root mean square error (RMSE), mean absolute percentage error (MAPE) and coefficient of determination (R2).
4.1 USBM Equation
[image:5.595.97.498.171.274.2]In order to determine the site factors for the USBM equation, a regression analysis was done using the training dataset. The obtained site factors were α=237.05 and β=-0.168. These values were used to construct Eq. (2).
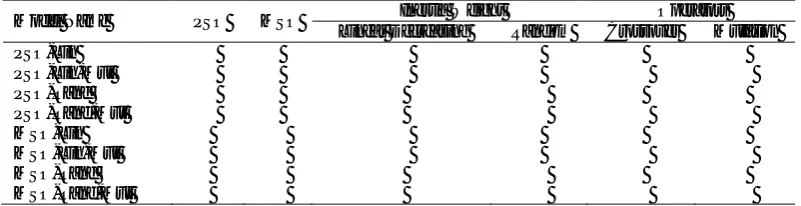
Table 1. Difference in the implementation of PSO training algorithm.
Model Name PSO MSO Inertia Weight Operators
Linear Decreasing Random Crossover Mutation
PSO-Lin 9 9
PSO-Lin-Mut 9 9 9 9
PSO-Rand 9 9
PSO-Rand-Mut 9 9 9 9
MSO-Lin 9 9
MSO-Lin-Mut 9 9 9 9
MSO-Rand 9 9
4.2 Comparison of Measured AOp and predicted AOp by prediction models
Figure 1 shows the comparison between measured AOp and predicted AOp by prediction models. On average, AOp predicted by using MSO-Rand-Mut are closer to the actual measured value compared to the other methods. Furthermore, there is a tendency by the USBM equation to overestimate the AOp values compared to the ANN models.
4.3 Performance Ranking
Due to the complexity of choosing the best prediction model using three different performance metrics, a performance ranking method [26] [27] was used to determine the best performing prediction model. As can be seen from Table 2, all of the ANN models outperforms the USBM equation in each of the three performance metrics. The best model was determined to be MSO-Rand-Mut. It was the best in terms of RMSE and MAPE, 2.18 and 1.73% respectively. Furthermore, the R2 value for MSO-Rand-Mut, 0.9693, was the second best out of all the other prediction models.
5. Conclusions
[image:6.595.84.514.521.670.2]AOp prediction is important to limit disturbance during blasting. Investigation of 76 blasting events were used to develop 8 ANN models. AOp prediction using USBM equation was used as a benchmark. The two
Table 2. Performance metric and rank values of each prediction model
Model RMSE MAPE R2 Rating for
RMSE
Rating for
MAPE Rating for R
2 Rank
Value
PSO-Lin 3.62 3.04 0.9664 3 3 6 12
PSO-Lin-Mut 2.68 2.11 0.9619 6 6 2 14
PSO-Rand 3.42 2.90 0.9651 4 4 4 12
PSO-Rand-Mut 3.33 2.83 0.9674 5 5 7 17
MSO-Lin 4.12 3.41 0.9653 2 2 5 9
MSO-Lin-Mut 2.44 1.99 0.9729 8 7 9 24
MSO-Rand 2.46 1.80 0.9641 7 8 3 18
MSO-Rand-Mut 2.18 1.73 0.9693 9 9 8 26
USBM 6.39 5.45 0.8450 1 1 1 3
Figure 1. Comparison between measured AOp and predicted AOp by prediction models.
0.0 20.0 40.0 60.0 80.0 100.0 120.0 140.0
1 2 3 4 5 6 7 8 9 10 11
AOp
Dataset Number
Measured USBM PSO-Lin PSO-Lin-Mut PSO-Rand
6
main input parameters for all the methods used were MC and DI. The results suggest that all the ANN models developed were superior to the USBM equation in terms of the AOp prediction made for the testing set. Using a performance ranking method, MSO-Rand-Mut was determined as the best model to predict AOp. The performance metric obtained using this model were RMSE=2.18, MAPE=1.73% and R2=0.97. This proves that MSO-Rand-Mut provide better accuracy compared to other methods when tested against the testing set. Thus, this ANN model can be confidently used to predict AOp in blasting site in order to limit disturbance to civilians.
Acknowledgement
The work presented in this paper was developed with the financial support of Universiti Teknologi Malaysia under the Grant Number: R.J130000.7822.4J222 and Q.J130000.2622.15J26.
References
[1] Khandelwal M, Singh TN. Prediction of blast induced air. J Sound Vib. 2006; 289: p. 711-725.
[2] Mohamad ET, Armaghani DJ, Hasanipanah M, Murlidhar BR, Alel MNA. Estimation of air-overpressure produced by blasting operation through a neuro-genetic technique. Environ Earth Sci. 2016 January; 75: p. 174.
[3] Khandelwal M, Kankar PK. Prediction of blast-induced air overpressure using support vector machine. Arabian J Geosci. 2011; 4: p. 427-433.
[4] Kuzu C, Fisne A, Ercelebi SG. Operational and geological parameters in the assessing blast induced airblast-overpressure in quarries. Appl Acoust. 2009 March; 70: p. 404-411.
[5] Chen S, Zhang Z, Wu J. Human comfort evaluation criteria for blast planning. Environ Earth Sci. 2015 August; 74(4): p. 2919-2923.
[6] Khandelwal , Singh TN. Prediction of blast induced air. Noise and Vibration Worldwide. 2005; 36(2): p. 7-16.
[7] Armaghani DJ, Hasanipanah M, Mahdiyar A, Majid MZA, Amnieh HB, Tahir MMD. Airblast prediction through a hybrid genetic algorithm-ANN model. Neural Comput and Appl. 2016 September;: p. 1-11.
[8] Siskind DE, Stachura VJ, Stagg MS, Koop JW. Structure response and damage produced by airblast from surface mining : United States Bureau of Mines; 1980.
[9] Persson PA, Holmberg R, Lee J. Rock Blasting and Explosives Engineering: CRC Press; 1993.
[10] Armaghani DJ, Hasanipanah M, Mohamad ET. A combination of the ICA-ANN model to predict air-overpressure. Eng Comput. 2015 June; 32: p. 155.
[11] Amiri M, Amnieh HB, Hasanipanah M, Khanli LM. A new combination of artificial neural network and K-nearest neighbors models to predict blast-induced ground vibration and air-overpressure. Eng Comput. 2016 October; 32(4): p. 631-644.
[12] Hajihassani M, Armaghani DJ, Sohaei H, Mohamad ET, Marto A. Prediction of airblast-overpressure induced by blasting using a hybrid artificial neural network and particle swarm optimization. Appl Acoust. 2014; 80: p. 57-67.
[13] Hasanipanah M, Armaghani DJ, Khamesi H, Amnieh HB. Several non-linear models in estimating air-overpressure resulting. Eng Comput. 2016 July; 32(3): p. 441-455.
[15] Kennedy J, Eberhart R. Particle Swarm Optimization. In Proc. of IEEE Int. Conf. on Neural Networks; 1995. p. 1942-1948.
[16] Kuok KK, Harun S, Shamsuddin SM. Particle swarm optimization feedforward neural network for modelling runoff. International Journal of Environ Sci Tech. 2010; 7(1): p. 67-78.
[17] Clerc M. The swarm and the queen: towards a deterministic and adaptive particle swarm optimization. In Proc. ICEC; 1999; Washington, DC. p. 1951-1957.
[18] Blackwell T, Branke J. Multi-swarm optimization in Dynamic environments. Applications of Evolutionary Computing. 2004.
[19] Shi Y, Eberhart R. A modified particle swarm optimizer. In 1998 IEEE Int. Conf. on Evolutionary Computation Proc. . IEEE World Congress on Computational Intelligence; 1998; Anchorage. p. 69-73.
[20] Bansal JC, Singh PK, Saraswat M, Verma A, Jadon SS, Abraham A. Inertia weight strategies in particle swarm optimization. In 2011 Third World Congress on Nature and Biologically Inspired Computing; 2011. p. 633-640.
[21] Xin J, Chen G, Hai Y. A particle swarm optimizer with multistage linearly-decreasing inertia weight. In Computational Sciences and Optimization, 2009. CSO 2009. Int. Joint Conf.; 2009. p. 505-508.
[22] Shi Y, Eberhart R. Tracking and optimizing dynamic systems with particle swarms. In Evolutionary computation, 2001. Proc. of the 2001 Congress on Evolutionary Computations; 2001. p. 94-100. [23] Løvberg M, Rasmussen TK, Krink T. Hybrid particle swarm optimizer with breeding and
subpopulations. In Proceedings of the Genetic and Evolutionary Computation Conf.; 2001; San Franscisco, California. p. 469-476.
[24] Higashi N, Iba H. Particle swarm optimization with Gaussian mutation. In Proc. of the IEEE Swarm Intelligence Symp. (SIS '03); 2003. p. 72-79.
[25] Garro BA, Vazquez RA. Designing artificial neural networks using particle swarm optimization algorithms. Comput Intell Neurosci. 2015.
[26] Zorlu K, Gokceoglu C, Ocakoglu F, Nefeslioglu HA. Prediction of uniaxial compressive strength of sandstones using petrography-based models. Eng Geol. 2008; 96(3): p. 141-158.