Digital Reading Disposition Scale: A Study of
Validity and Reliability
Berker Bulut*, Nuri Karasakaloğlu
Faculty of Education, Adnan Menderes University, Turkey
Copyright©2018 by authors, all rights reserved. Authors agree that this article remains permanently open access under the terms of the Creative Commons Attribution License 4.0 International License
Abstract
In this study, a Digital Reading Disposition Scale was developed to determine undergraduate pre-service teacher students’ dispositions towards digital reading, opposed to a preference for printed reading material. Initially, a 20-items trial version of the scale was administered to a total sample of N=301 undergraduate pre-service teacher students in order to establish validity of the scale. According to the results of the Exploratory Factor Analysis (EFA) of the data collected by means of the 20-item trial form, it was revealed that only 12 items of the scale had a one-factor loading, which explained 65.58% of the total variance. Fit index values, derived from a Confirmatory Factor Analysis (CFA), confirmed the one-factor structure of the 12-items scale as a valid model. A satisfactory Cronbach-Alpha internal consistency coefficient of 0.952, as well as satisfactory test-retest reliability coefficient (Pearson correlation coefficient of 0.92) reapplied to n=98 pre-service teacher students three weeks after the first administration of the scale, provide evidence of the high reliability and consistent measurement of the scale over time. Furthermore, as part of an item analysis, adjusted item-total correlation of each item was calculated, and t-values for upper and lower 27% groups are reported to be significant (p<.001) for the 12 items of the scale. Accordingly, satisfactory validity and reliability indices are established for the Digital Reading Disposition Scalefor the study sample in this investigation disposition.
Keywords
Digital Reading, Disposition Scale, Scale Development, Validity, Reliability1. Introduction
The action of reading is an activity based on the vocalization of the letters or symbols that create a written text and the comprehension of the meanings these signs express. The essence of the reading activity, which consists of various functions of the eye, voice and brain such as
vision, vocalization, perception and structuring in the brain, is comprehension. Akyol also emphasizes that the most important issue of reading today is constructing meaning from the reading, that is to say, structuring the meaning [1]. Güneş defines reading comprehension as processing the information through various mental processes such as examining, ranking, classifying, associating, inquiring, and evaluating, and combining it with the reader's preliminary knowledge and structuring it in the mind [2]. In addition, reading is defined as concurrent comprehension and structuring through written interaction [3]. Meaning is the result of the interaction between the reader, text and the environment. The reader comprehends the text by using his prior knowledge in a sociocultural environment.
The change in the perception of literacy along with the developing technology has also changed the structure of the process of comprehending the texts. There is a process of reading, comprehending and analyzing the texts which are usually shared in the electronic environment, and then producing new texts by using the writing activity [4].
The enhancement of computers and electronic texts has led to a broader embracement of the concept of text, including electronic text and multimedia documents as well as classical press [5]. According to Farinosi, Lim and Roll [6], reading and writing environments are increasingly becoming more as screens and keyboards instead of pencils and papers. Similarly, Güneş [7] emphasizes that tools like computers, television, and video are now on the foreground in the schools where printed materials such as books, magazines, and encyclopedias were used. Thus, the literacy understanding that was developed based on printed products has been changing. It is stated that, within the literacy of the XXI. century, it is important to make individuals literate in the face of texts in the digital media where the words, oral communication styles or visuals are not used individually but used together [8].
in the mind. According to Keskin, Baştuğ and Atmaca [9], digital reading is a dynamic comprehension process based on the stimuli on the screen, driven by means of basic technology use knowledge. In summary, digital reading is the process of reading and understanding the texts in the electronic environment.
The amount of reading conducted in the digital media and the time spent in these environments is increasing day by day [10]. According to research conducted the first of the aims of using the Internet by the people in Turkey is e-mails [11]. Individuals use their computer's or smartphone's screens to read e-mails they receive.
In the research conducted in order to determine the preferences of the students between printed books and electronic books, a significant relationship was found between the frequency of reading on the computer and online information searching when working on the computer and the participants' decisions about using electronic books [12]. It was emphasized that there was a strong relationship between the interest in digital reading and the general attitude towards computers [13]. Besides, the fact that the texts in the digital media are short and the convenience of finding certain information in the text are among the reasons why readers prefer digital media [14]. On the other hand, in order to determine the readers' digital media preferences, it is necessary to detect digital reading dispositions. Determining which students tend to read digitally in educational environments is thought to be a great convenience in determining the material to be presented for the students. In this study, a scale was developed aiming to determine the dispositions of pre-service teachers towards digital reading.
2. Materials and Methods
This research is designed in screening model as it aims to develop digital reading disposition scale. In screening models, the subject of the research is aimed to be described in its own conditions and as it exist [15].
2.1. Sample
The total research sample of this study comprised of N=301 undergraduate pre-service teacher students enrolled at the Department of Primary Education and the Department of Preschool Education within the Faculty of Education at the Adnan Menderes University in Turkey. According to Child [16], the size of the sample in scale development studies should be at least five times larger than the number of items to be subjected to factor analysis. It is emphasized that in scale development studies, a sample of 300 or more is appropriate for data analysis [17]. The test-retest reliability analysis was conducted on 98 pre-service teachers.
2.2. Scale Development Process
While developing the Digital Reading Disposition Scale,
the relevant literature was reviewed by the researchers and the academicians having worked on this field were contacted. An initial item pool of 25 items was developed in accordance with the views received. Together with the experts in the field, 5 items which were unclear, ambiguous and which contained more than one judgment were removed from the initial item pool of 25, in line with the opinions of the language and test and assessment experts, and a 20-item trial form was created. Thirteen of the items in the form were positive and 7 were negative statements. Before the analyses, negative items were reversely scored. Scale items measure students’ Digital Reading Disposition using a 5-point Likert type scale, with the following response options: 1= Totally Inappropriate for Me; 2=Partially Inappropriate for Me; 3=Undetermined; 4=Partially Appropriate for Me; 5=Totally Appropriate for Me.
2.3. Data Analysis
For the content validity, the views of expert academicians on the subject were consulted. For construct validity, Exploratory Factor Analysis (EFA) and Confirmatory Factor Analysis (CFA) were performed. Using EFA, a meaningful structure of the scale was established, and it was determined how many factors were included in the scale. CFA was performed to test the appropriateness of the model presented in EFA. The proficiency of the model was evaluated by examining the fit and error indexes obtained by means of CFA. In order to determine the reliability of the scale, internal consistency and test-retest reliability coefficients were calculated. Cronbach-alpha value was calculated for internal consistency and Pearson correlation coefficient was calculated for the test-retest reliability to determine the stability of the scale. For item analysis, adjusted item-total correlation of each item was calculated and the t-test was used to test whether the items distinguished lower and upper 27% groups. For the validity and reliability analyses of Digital Reading Disposition Scale, SPSS 23.0 and LISREL 8.80 package programs were used.
3. Results
3.1. Exploratory Factor Analysis
suggests that the data show a multivariate normal distribution [18]. As a result of the analyses performed, KMO value of the scale was calculated as .926 and the result of the Chi-square test statistic obtained from the Barlett test was found to be significant (χ2 = 2105.510, df: 66, p<.001). In accordance with these findings, it can be said that the data of the research data was appropriate for factor analysis.
As a result of the first EFA performed on the data of the
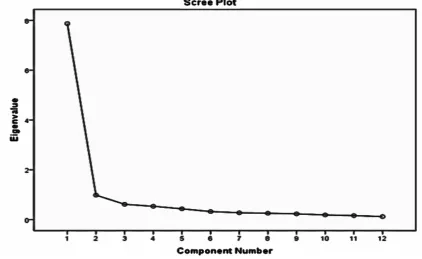
study, it was revealed that the scale was collected under 5 factors. As there were less than 3 items in some of these factors after a varimax axis rotation technique [17] was performed, and because factor loads of some items were lower than .40, these items were removed from the scale and EFA was performed again. Factor analysis found one factor loading for the revised 12-items scale. The eigenvalues for these factors are shown in the figure below.
Figure 1. Scree Plot Graph of Digital Reading Disposition Scale
Figure 1 shows one factor loading, with eigenvalue greater than 1 [19], for the 12-items scale. Table 1 reports the factor loads of the 12 items of the scale.
According to EFA results in Table 1, it was revealed that the 12-item scale developed was collected in one factor and 65.58% of the total variance was explained. Hence, in exploratory factor analysis, the variance explained by the factors is suggested to be 50% and over [20].
Table 1. EFA results of Digital Reading Disposition Scale
Items F1
16. I surf the net whenever I have the opportunity. .875
9. If I can choose, I prefer digital media resources while studying in the library. .845
19. I do not spend time reading the news from the newspaper to follow daily occasions. .837
4. I spend more time digitally reading the resources I find such as articles and theses while searching on the internet. .831
1. I read through the resources on the internet while doing research for the content of a lesson. .825
2. While doing research for the content of a lesson, I think that using printed resources like encyclopedias is a waste of time. .821
20. I follow social media news websites like twitter to get instant information for the events. .819
8. I have difficulty accessing the recommended resources on the internet in teaching a lesson. .808
13. I think that e-book reading devices are beneficial for reading habits. .803
3. I do not like reading without getting the print of the article I find on the internet about a research topic. .774
12. I like reading e-books over digital media such as tablets in my free time. .751
[image:3.595.88.511.201.460.2] [image:3.595.57.545.565.757.2]3.2. Confirmatory Factor Analysis
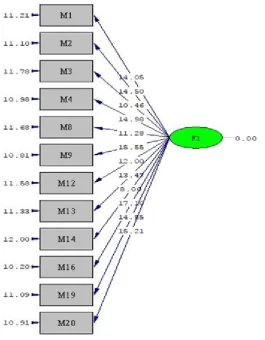
[image:4.595.171.437.132.473.2]CFA was performed in order to confirm the one factor structure of 12-item scale developed as a result of EFA. The t-values obtained in CFA performed are given in Figure 2.
Figure 2. Path Diagram in Terms of Digital Reading Disposition Scale
As seen in Figure 2, t values in terms of explaining observed variables by latent variables are shown on the arrows. Parameter estimations are significant at .05 level if t values are above 1.96, and significant at .01 level if t values are above 2.56 [21]. Within this framework, it can be seen in Figure 2 that all the items are significant at .01 levels.
However, p-values should also be considered. P-values provide information about the significance of the difference between the expected covariance matrix and the observed covariance matrix (χ2 value). Naturally, it is desirable that p is significant [21]. As seen in Figure 2, p value is significant at .01 level. Besides, fit and error indexes obtained with CFA are presented in the following table.
Table 2. CFA Results of Digital Reading Disposition Scale
2
χ df p χ2/df RMSEA GFI AGFI RMR SRMR NFI NNFI CFI IFI
[image:4.595.58.543.633.663.2]One of the important values that should be examined in CFA is the χ2 fit statistics. This value is evaluated by the ratio with the degree of freedom. If χ2/df is ≤ 2, it means perfect fit [22]. When Table 2 is analyzed, it is seen that this value is 1.65 in the developed scale. This value is the evidence that the model is perfectly fit.
The fact that RMSEA, of the fit indexes, which is more insensitive towards sample size, and which is sensitive to the relationship between errors, is between .05 and .08 indicates that the model is acceptable [23]. When the RMSEA value obtained from this scale (.076) is analyzed, it is seen that the fit index obtained is acceptable.
Other calculated fit indexes, i.e. GFI = 0.94 and AGFI = 0.92, are both above 0.90, both indicative of a good fit [24]. The fact that the standardized RMR = 0.079 and SRMR = 0.065 values are between .05 and .08, are also indicative of a good fit [25].
Other fit index values calculated, i.e. NFI = 0.93, NNFI = 0.92, CFI = 0.94, and IFI = 0.94, are all above 0.90, all indicative of a good fit [23]. Within this framework, it can be said that the one-factor structure of the scale is confirmed as a model.
3.3. Reliability Analysis
As a result of the reliability analyses performed, it was determined that the calculated Cronbach-Alpha internal consistency coefficient of digital reading disposition scale is .952. This result is the indicator that the scale is reliable as the reliability coefficient is greater than the critical value of .70 [26, 27].
In order to calculate the test-retest reliability coefficient of the scale, it was reapplied to 98 pre-service teachers 3 weeks after the first application. The Pearson correlation coefficient between the scores obtained from both applications of the scale was calculated as .920. This is the evidence that the scale gives consistent results over time.
3.4. Item Analysis
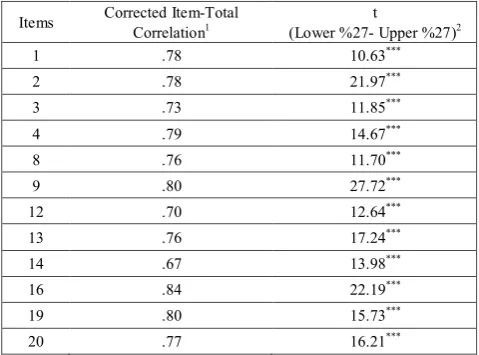
Table 3. Item Analysis Results of Digital Reading Disposition Scale
Items Corrected Item-Total Correlation1 (Lower %27- Upper %27)t 2
1 .78 10.63***
2 .78 21.97***
3 .73 11.85***
4 .79 14.67***
8 .76 11.70***
9 .80 27.72***
12 .70 12.64***
13 .76 17.24***
14 .67 13.98***
16 .84 22.19***
19 .80 15.73***
20 .77 16.21***
1 n=301, 2 n
1=n2=81 *** p<.001
Table 3 reports the results of an Item Analysis that was performed on the Digital Reading Disposition Scale for the total sample of N=301 teacher students.
When Table 3 is examined, it is seen that adjusted item-total correlations of the items on the scale are above the limit value of .30 [28]. The t values calculated for upper and lower 27% groups are seen to be significant (p<.001) for all 12 items of the scale. These results can be interpreted as the fact that the validities of the items on the scale are high and can distinguish the students in terms of determining digital reading disposition.
4. Discussion and Conclusions
In the current technological driven Information Age, the production and sharing of information is performed through digital media. Students who spend most of their time on social networks like YouTube, Twitter, and various computer games gain experience in dynamic, non-linear and interactive environments. This rapid transformation has a direct impact on the field of education and leads educators to rethink their basic principles and to re-plan these new technologies in creative and productive ways [29]. Hence, when the current education and instruction practices are considered, the use of digital platforms has become an obligation especially in homework or classroom research involving reading studies for learning purposes [9].
Although paper-based reading is stated to provide better comprehension and less eye fatigue than on-screen reading in some researches [30,7], the time allocated for reading activities in digital media is increasing day by day. The fact that the texts in the digital media are short and that finding certain information in the text is convenient are among the reasons why readers prefer digital media [14].
[image:5.595.54.294.555.732.2]coefficients were calculated in order to determine the reliability of the scale. According to the values found, it was concluded that the scale was reliable. For item analysis, the adjusted item-total correlation of each item was calculated, and the t-test was used to test whether the items distinguished between upper and lower 27% groups. According to these results, it was determined that the items on the scale had high validity and could distinguish the students in terms of digital reading disposition.
4.1. Recommendations
1. The scale is able to be translated into other languages and validity and reliability studies can be done.
2. The validity and reliability of the 12-items scale can be confirmed in future studies for other study populations.
3. Experimental studies can be done for develop undergraduate pre-service teacher students’ dispositions towards digital reading.
REFERENCES
[1] Akyol, H. (2010). Yeni programa uygun Türkçe öğretim yöntemleri (3. baskı). Ankara: Pegem Akademi Yayıncılık. [2] Güneş, F. (2009). Hızlı okuma ve anlamı yapılandırma.
Ankara: Nobel Yayın Dağıtım.
[3] Pearson, P.D. (2009). The roots of reading comprehension. In S.E. Israel & G.G. Duffy (Eds.), Handbook of research on reading comprehension (pp. 3-31). New York: Routledge. [4] Tüzel, S. & Tok, M. (2013). Öğretmen adaylarının dijital
yazma deneyimlerinin incelenmesi. Tarih Okulu Dergisi, 6(15), 577-596.
[5] Reading Study Group. (2002). Reading for understanding: Toward R&D program in reading comprehension. Santa Monica: RAND.
[6] Farinosi, M., Lim, C. & Roll, J. (2016). Book or screen, pen or keyboard? A cross-cultural sociological analysis of writing and reading habits basing on Germany, Italy and the UK. Telematics and Informatics, 33(2), 410-421.
[7] Güneş, F. (2016). Kâğıttan ekrana okuma alanındaki gelişmeler. Bartın Üniversitesi Eğitim Fakültesi Dergisi, 5(1), 1-18.
[8] Tüzel, S. (2013). Çok katmanlı okuryazarlık öğretimine ilişkin Türkçe öğretmen adaylarının görüşlerinin incelenmesi. Eğitimde Kuram ve Uygulama, 9(2), 133-151. [9] Keskin, H. K., Baştuğ, M. & Atmaca, T. (2016). Öğrencileri
akademik dijital okumaya yönlendiren unsurlar. Eğitim ve Bilim, 41(188), 117-129.
[10]Shimray, S. R., Keerti, C. & Ramaiah, C. K. (2015). An overview of mobile reading habits. Journal of Library & Information Technology, 35(5), 343-354.
[11]TÜİK. (2010). Hane halkı bilişim teknolojileri kullanım istatistikleri. Ankara: T.C. Başbakanlık Türkiye İstatistik Kurumu.
[12]Woody, W. D., Daniel, D. B. & Baker, C. A. (2010). E-books or textbooks: Students prefer textbooks. Computers & Education, 55(3), 945-948.
[13]Putman, S. M. (2014). Exploring dispositions toward online reading: Analyzing the survey of online reading attitudes and behaviors. Reading Psychology, 35(1), 1-31.
[14]Larson, L. C. (2012). It's time to turn the digital page: preservice teachers explore e-book reading. Journal of Adolescent & Adult Literacy, 56(4), 280-290.
[15]Karasar, N. (2013). Bilimsel araştırma yöntemi (25. baskı). Ankara: Nobel Yayın Dağıtım.
[16]Child, D. (2006). The essentials of factor analysis (3. edition.). London: Continuum.
[17]Comrey, A. L. & Lee, H. B. (1992). A first course in factor analysis (2. edition). New Jersey: Lawrence Erlbaum Associates.
[18]Tavşancıl, E. (2010). Tutumların ölçülmesi ve SPSS ile veri analizi (4. baskı). Ankara: Nobel Yayın Dağıtım.
[19]Kaiser, H. F. (1960). The application of electronic computers to factor analysis. Educational and Psychological Measurement, 20, 141-151.
[20]Erkuş, A. (2012). Psikolojide ölçme ve ölçek geliştirme-I: Temel kavramlar ve işlemler. Ankara: Pegem Akademi Yayıncılık.
[21]Raykov, T. & Marcoulides, G. A. (2008). An introduction to applied multivariate analysis. New York: Routledge Taylor &Francis Group.
[22]Tabachnick, B. G. & Fidell, L. S. (2007). Using multivariate statistics (5. edition). Boston: Allyn and Bacon.
[23]Jöreskog, K. G. & Sörbom, D. (1993). LISREL 8: Structural equation modeling with the simplis command language. Lincolnwood: Scientific Software International, Inc. [24]Sümer, N. (2000). Yapısal Eşitlik Modelleri: Temel
Kavramlar ve Örnek Uygulamalar. Türk Psikoloji Yazıları, 3(6), 49-74.
[25]Brown, T. A. (2006). Confirmatory factor analysis for applied research. New York: The Guilford Press.
[26]Kline, P. (1986). A handbook of test construction: Introduction to psychometric design. New York, NY, US: Methuen.
[27]DeVellis, R. F. (2003) Scale development (2. edition). California: Sage Publication Inc.
[28]Özçelik, D. A. (2010). Test hazırlama kılavuzu (4. baskı). Ankara: Pegem Akademi Yayıncılık.
[29]Kellner, D. (2000). New technologies/new literacies: reconstructing education for the new millennium. Teacher Education, 11(3), 245-265.