Journal of Chemical and Pharmaceutical Research, 2014, 6(5):1896-1903
Research Article
CODEN(USA) : JCPRC5
ISSN : 0975-7384
Study on rowing athlete selection potential based on stepwise
regression analysis
Hongsheng Zhao and Hong Zhang
Department of Physical Education, Northeast Dianli University, Jilin, China
_____________________________________________________________________________________________
ABSTRACT
A coach usually selects potential athletes based on their performances in competition or daily routine training, which is not that scientific to some degree. By taking long distance rowing as an example and establishing potential model, this paper provides coach a way to select athletes based on stepwise regression analysis and type analysis. We get our results through the analysis of collected data and the test of the program most related to the sport and the results are most related to the scores in completion, and by type analysis, we rate the athletes into three levels. A curve line is made according to the performance of athlete and calculate the slope when the athlete’s performance is basically stable, which is the potential value of the athlete. We select the athlete of greatest value in a certain type according to their levels who has the potential to achieve better results.
Key words: potential model, stepwise regression analysis, cluster type analysis, selection of athletes, physiological index
_____________________________________________________________________________________________
INTRODUCTION
Rowing movement originated in England, male Rowing was listed as the competition item in the second Olympic Games in 1990, while China started to have rowing in 1913 and the first organization of rowing in china was created by British in Shanghai in 1913 named Rowing association. In 1940s, the Russian established a water club which was limited to foreigners [1-5]. China started to have its own sowing movement after the founding of the nation, in 1954, the first public rowing was initiated in Harbin. in 1959, rowing became a national sport for the first time, and it developed very fast, in the Asia’s emerging power games in 1966, China swept all the golden medals related to the game(single, double, four persons) [6-9]. In 1973, China joined the international rowing Federation and sent athletes to take part in the world championship contest. In 1988, Chain took part in the Olympic games for the first time and won a silver medal as wells as a bronze medal [10].
There are male rowing team and female rowing team in China’s rowing team, and they are the first class rowing team in Asian, and it gained wonderful results in Asian games and won 64golden medals out of 72 golden medals since its participation in the Milk Asian games in New Delhi from 1982, revealing the absolute dominant position of china in Asian games [11].
However, this game originates in Europe, we Asian countries do not have advantages in this field, the Chinese rowing team has won 1golden medal 2 silver medals and 5 bronze medals in the five Olympic games it participated. Compared with countries like US and Britain, we leg far behind, and European countries have far greater experiences in this field, that’s why we are left behind. In recent years, with the emerging of new generation of athletes, there are many potential athletes like JingZiwei, Tangbin and four other excellent ones and they won the first golden medal for china in the 2008 Olympic Games [5-9].
Generally, they choose the athletes according to their performance in competition, some coach may choose the young athletes according to the physical strength and gave them long term training, all these are more or less not scientific or weakly based, this paper, by studying their training results giving team samples, provides coach with ways of selecting athletes.
FORMULATION
[image:2.595.97.518.237.375.2]We take the long distance rowing as an example, and analyze the performance of the athletes in the long distance test program. The athletes will conduct program test for the inspection of training progress. The long distance rowing over water range from 1.2km, 1.5km, 500m, 4km, 3km. Overload strength test biochemical criterion, 11.4km, according to the related materials, we can occlude that the 11.4km program can reveal the speed, endurance to some degree. So we choose the performance in the 11.4km as the criteria of selecting athletes. The label one shows the results of athletes in a certain program.
Table 1: the results of athletes in a certain program
athlete On water 1.2km On water 1.5km On water 500m On water 15.2km On water
4km 3km
Overload power test biochemic al criterion On water 11.4km 1
x
x
2x
3x
4x
5x
6x
7x
8x
9A 2801.3 440.64 131.74 5238.22 1316.96 717.76 72.67 67.00 3981.10
B 335.65 421.54 131.57 5098.86 1305.82 870.55 72.33 66.18 3924.47
C 361.41 409.70 129.62 4977.39 1294.71 868.50 59.33 59.91 3905.12
D 324.22 437.65 130.51 5181.29 1329.43 817.28 62.67 62.14 3991.65
E 299.05 396.43 121.16 4804.03 1190.64 703.58 81.67 66.59 3700.45
F 297.58 390.97 125.53 4842.94 1213.98 758.84 82.50 74.06 3793.64
G 313.82 404.47 130.45 4919.18 1248.27 756.93 66.67 65.95 3854.75
H 310.07 407.65 130.03 4994.88 1264.85 787.94 86.00 67.14 3908.50
I 349.94 418.50 131.72 4934.46 1313.20 900.95 78.33 63.44 3923.00
J 310.43 385.95 122.32 4797.35 1314.48 792.74 95.00 66.82 3737.18
Their performance varies due to their initial ability, besides, the growth of veteran sportsman after long time training is slower than that of young sportsman after a short time of training. For that, selecting the sportsman according to their growth ratio is not fair for the veteran sportsman, and it is also unfair for the new sportsman according to the results in the program. So, in terms of the potential of athletes, we establish a study model and test the potential of athletes in rowing, which provides a way for the coach the select athletes of greater potential.
We define potential as the growth rate of a potential athlete after long time training when their performance tends to become steady.
[image:2.595.181.429.546.730.2]value indicates the regression coefficients. bint is the confidence interval of the confidence coefficient, the value of which estimated to be 95%, r represents the residuals, rint represents the confidence interval for each of the residuals, stats for the test of static of regression model, of the three values in which R2 and Represent regression statistics
and P values were significant probability, alpha is the confidence level. The greater the correlation coefficient r^2, the more significant the regression equation would be; When (the probability corresponding with F) Palpha
0
H would be refused, so the regression model was established:
2 4 5
1.62495 0.362392 1.58157
y x x x
As can be seen by Figure 1, the value associated with the maximum value of y are x2, x x3, 4In Stepwise regression
process, when valuesR2and F are gradually larger, p value is gradually reduced. The whole process shows that three
regression model containingx2, x x3, 4I is reasonable. Therefore, the final result of stepwise linear regression is:
2 4 5
1.62495 0.362392 1.58157
y x x x
The results of stepwise linear regression show that in the test project, the test scores in 1.5km has the greatest effect on the scores of athletes 11.4km. The thing that has the greatest association with water 1.5km and 11.4km water projects and Rowing Athletes. The training date 1.5km test results of the collected athletes list as follow in Table 2:
Table2: Results of athletes in the 1.5km program
A B C D E
0 501.90 0 405.72 0 419.50 0 517.18 0 391.10
45 410.38 50 478.00 43 612.93 45 405.19 36 405.56
114 409.63 95 400.56 50 421.67 68 390.57 43 398.55
163 401.87 95 396.75 50 400.88
163 397.64 95 393.14
163 389.34
F G H I J
0 384.69 0 408.37 0 416.84 0 413.20 0 379.01
36 401.14 36 417.92 7 409.95 36 414.71 36 393.74
43 391.20 43 403.67 13 408.86 43 415.94 43 387.51
50 395.50 50 406.72 58 404.71 50 424.91 50 393.00
95 382.30 95 395.53 127 397.88 95 417.64 96 380.59
163 394.63 163 424.57 163 381.82
The collected data from the program of 11.4km is incomplete; the vacant part can be added by minimum adjacent point interpolation method. So we get the 11.4 km test scores in Table 3:
Table3: the 11.4 km test scores (the red ones are added)
A B C D E F G H I J
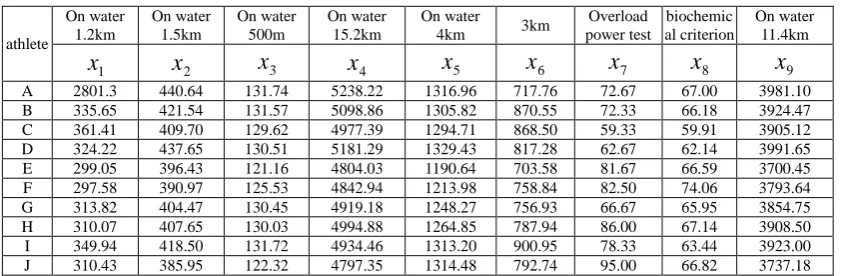
0 4135.52 3998.85 4001.13 4132.25 3786.52 3868.33 3961.34 3978.64 3962.23 3851.33 9 4508.13 4236.03 4256.57 4516.80 3811.11 4140.85 4200.69 4200.72 4168.54 3941.92 14 4216.52 4064.85 4073.26 4195.77 3682.79 3747.64 3924.62 4015.93 3875.17 3764.60 15 4216.52 4064.85 4073.26 4195.77 3779.18 3676.55 3950.39 4015.93 3986.27 3833.73 17 4223.98 4196.31 4228.65 4196.86 3779.18 3676.55 4002.18 4041.43 4013.98 3906.13 28 3734.04 3835.94 3742.55 3769.74 3560.14 3534.85 3716.39 3609.62 3824.31 3618.62 30 3660.06 3754.90 3582.95 3758.46 3560.14 3534.85 3732.90 3609.62 3824.31 3596.84 38 3641.37 3635.87 3645.52 3669.8 3560.14 3534.85 3575.38 3735.61 3630.50 3469.15
65 3729.17 3672.98 3710.29 3693.54 3582.94 3628.87 3777.54 3652.32
Figure 2: Athletes water line chart 11.4 km test scores
C luster analysis of the basic idea is to assume that each sample as Sui generic, so the distance between different kinds is the distance between the samples, if the difference between two kinds is almost the same, then the two kinds will be merged into a new class. nest we will calculate the distance between new class and other classes, so every time a narrow category, until almost all kinds are merged into one kind. And then determine the final classification according to need or the threshold value.
According to the thought of clustering analysis, athletes can be divided into ten classes at first. Calculate the distance between the two of the ten classes; merge the closest distance between every two. Continue this until they merge into three categories in the end. Cluster analysis results are as follows:
Junior athletes: A, D
Intermediate athletes: B, C, G, H, I Senior athletes: E, F, J
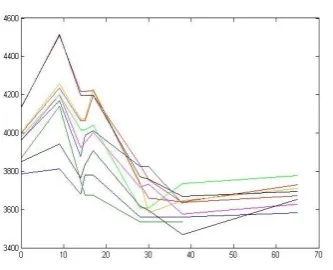
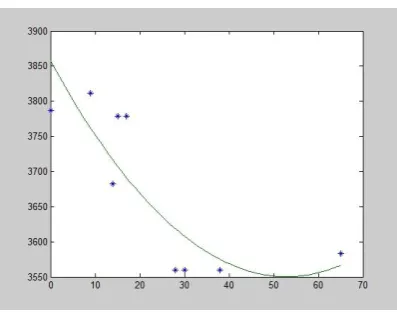
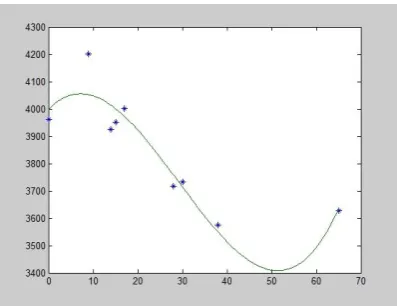
We use meander line to show the results of athletes, and the results of athletes list as follow Figure3-12:
[image:4.595.225.392.69.204.2][image:5.595.207.405.67.224.2]
Figure 5: The result of athlete C in meander line
Figure 6: The result of athlete D in meander line
[image:5.595.206.405.426.582.2]Figure 8: The result of athlete F in meander line
Figure 9: The result of athlete G in meander line
[image:6.595.205.407.430.579.2]Figure 11: The result of athlete I in meander line
Figure 12: The result of athlete J in meander line
By studying the results curve line of 10athlets in 11.4 program, we can find that the major results trends of all the athletes are basically the same, when the changes are basically the same, the lengths of time for them to get the best results are also nearly the same, and their time to maintain a stable result is basically the same.
[image:7.595.206.405.249.402.2]Please calculate the last slope of the athletes when they performance is basically stable and its absolute value. The potential value list as followTable4
Table 4: The potential value
athletes Potential value A 3.25 D 0.37 B 0.42 C 1.75 G 1.98 H 1.55 I 2.57 E 0.84 F 2.41 J 6.78
According to the analysis in Table 4, the smaller the slope of the tangent, the better the athlete tends to be, the greater the potential of the athlete. It can be concluded as:
Junior athlete potential: D> A
Based on the above information, coaches can choose higher potential athletes according to their levels and potential, this is better to achieve better results.
However, in real situation, athletes are different; areas of expertise of each person are also different. Combined analysis of three levels of athletes, we can see the progress of junior athletes is faster, have greater development potential. You can choose the primary athletes, as follow-up forces ad give them long-term high-quality primary training, thus the athletes achievements will quickly grow and become the backbone of the new generation in the field.
Intermediate athletes’ performance progress gradually stabilized after a period of training. In the mid-athletes, C’s potential value stands out, so is the test scores of Water 11.4km program. So in Intermediate athletes, athletes C’s potential is large, you can choose he.
Senior athletes’ progress in performance is the less than the other two among the three levels of athletes. The reason is that after a long period of training, high-level athletes have reached a peak in terms of fitness and skill levels. It is more difficult to conduct further improve in the training and may even be back. So for advanced players, compared with the ability to improve performance, it is more important to maintain their potential. Among senior athletes E has greater potential, we can choose him.
CONCLUSION
In this model, we take rowing for example, so we mainly provide the ways of long distance rowing selection. Analysis test scores of athlete’s. And we choose the test which has greater relation with long-distance rowing competition to establish stepwise regression model to obtain a training which has maximum correlation the training test scores. Analyze the results of scores of athletes in different training program to establish the potential model. And using cluster analysis method to divide athletes into primary, secondary, advanced levels. To make the meander line of results according to the curve line in the results, the results obtained by the athletes before stabilizing slope of the curve are the absolute value of the results. We can choose the athlete of greatest potential among three levels; we could athletes of great potential.
This method not only can be used for long-distance rower’s selection, it can also be used for short-distance rower selection. When selecting short distance rowers, we can be changing the scores into the one which could reflect the performance of athletes in short-distance rowing. The model can also be used for other events in the selecting of levels of different players.
REFERENCES
[1] Bing Zhang. Journal of Chemical and Pharmaceutical Research, 2014, 5(2), 649-659. [2] WANG Xu-hui. Journal of Hubei Sports Science, 2006, 25(2),211-212.
[3] LIU Zuo, LIN Jia-shi. Journal of Shenyang Sport University, 2007, 26(5),111-112. [4] LIU Ying-jie, GAO Wei-feng. China Sport Science and Technology, 2011, 47(2).
[5] HE Hai-feng, ZHENG Wei-tao, MA Yong, et al. Journal of Wuhan Institute of Physical Education, 2005, 39(4),74-78.
[6] ZHAO Wei-xing. Journal of Shandong Physical Education Institute, 2009, 25(1). [7] LIU Xiaochun, ZHAI Liwu, LI Keli. Journal of Hubei Sports Science, 2009, 28(3). [8] Xiaomin Zhang. Journal of Chemical and Pharmaceutical Research, 2013, 5(12), 8-14. [9] Wang Bo; Zhao Yulin. Journal of Chemical and Pharmaceutical Research, 2013, 5(12), 21-26. [10] Mingming Guo. Journal of Chemical and Pharmaceutical Research, 2013, 5(12), 64-69.