Design and Fabrication of a Three-Point Bending Test
Rig to Evaluate Strength and Stiffness of I-Beam
Moch Iqbal Rokhim1,2, Mohd Shukri Yob1,2,*, Mohd Juzaila Bin Abd Latif 1,2,
Fudhail Bin Abdul Munir1,2
1Faculty of Mechanical Engineering, Universiti Teknikal Malaysia Melaka, Malaysia
2Centre for Advanced Research on Energy, Universiti Teknikal Malaysia Melaka, Malaysia
Received September 22, 2019; Revised October 17, 2019; Accepted October 27, 2019
Copyright©2019 by authors, all rights reserved. Authors agree that this article remains permanently open access under the terms of the Creative Commons Attribution License 4.0 International License
Abstract
I-beam is widely used as main structures inthe automotive and oil and gas industries due to their ability to sustain axial load at very minimum weight. For any structure, the important parameter should put into considerations are strength and stiffness. A Three-point bending test is a well-known method to evaluate the strength and stiffness of a beam. The existing machine to perform a three-point bending test is the Instron® 5585 Universal Testing Machines (UTM). However, these machines can only measure specimen within 500 mm which is insufficient for a longer specimen. In this study, a new design testing rig was proposed to evaluate the strength and stiffness of the longer specimen of I-beam. For this study, the design of the testing rig was evaluated using finite element analysis for 3 different lengths to determine its strength and rigidity. From this analysis, it is found that the proposed design of a testing rig shows satisfactory strength and rigidity for the length of 500 mm to 1000 mm when loaded with 10 kN force.
Keywords
Design and Fabrication, Testing Rig,Three-Point Bending Test, I-Beam, Stress Analysis
1. Introduction
I-beam structure steel is widely used in automotive industries and oil and gas industries as main structures due to their ability to sustain high axial load at very minimum weight [1-3]. The width-to-thickness ratio of the flange and web are proven to be the key factors for determining its strength and stiffness [4]. Once the light structure is produced, it can contribute to cost reduction during construction, transportation, and installation [5]. However, there are some drawbacks when using I-beam in engineering applications, such as corrosion and cracking
which may lead to high maintenance cost and safety issues [6]. Corrosion is known to lead to a reduction in the thickness of structural members that will indicate the degradation of their mechanical properties [7]. These defects will cause failure to the I-beam at lower than the designated load.
In order to overcome these drawbacks, some researchers proposed using a carbon fiber patch to locally reinforce the I-beam [5,8,9]. While other researchers proposed using welding methods to repair the I-beam structure steel [10]. There are also some studies that propose methods to delay the propagation of cracks when the structure is impossible to be replaced or repaired at the time [11,12]. The researchers using the experimental test to evaluate the effect of these methods. One of them was the three-point bending test.
A three-point bending test is known methods used to evaluate the strength and stiffness of a beam [13,14]. To conduct a three-point bending test, a testing rig needs to be employed. The main function of the testing rig is fixing the specimen horizontally and applying load on the middle span of the specimen [15]. Commonly, bending test can be performed using the Instron 5585 Universal Testing Machine (UTM). However, the usage of this machine is limited for a specimen which is shorter than 500 mm in length. From our study, many researchers had tested the I-beam with the length is longer than 500 mm [4,16,17]. Due to that, this research paper will come up with the design and analysis of testing rig which is applicable for the specimen that longer than 500 mm.
cast to a typical concrete [18-20]. The measurement of deformation can be affected by the stiffness of a testing rig. If the stiffness of testing rig is neglected, there are risk up to 20% errors in measurement. But if the stiffness is considered, the measurement uncertainty is less than 1% [18]. Another factor such as loading nose and loading support shall put into consideration to avoid the failure due to stress concentration at the loading nose or supports [21].
2. Materials and Methods
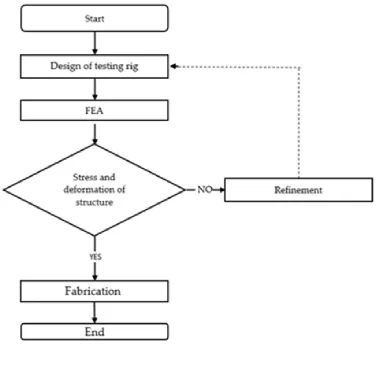
[image:2.595.112.492.218.585.2]In this study, the design of a testing rig was produced using CATIA Software. Then, by using finite element software, the maximum load that can fail the I-beam is identified. This load is applied to the testing rig to evaluate its stress and rigidity. Once this analysis achieved a satisfactory result, the fabrication process can be carried out. The whole process of these works is shown in (Figure 1).
2.1. Testing Rig Design
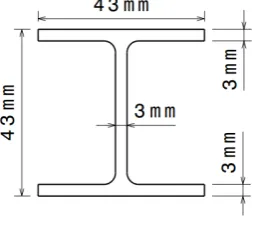
[image:3.595.307.536.117.185.2]In this research, the maximum size of the I-beam specimen that will be tested is shown in (Figure 2). This specimen was downscale from the 100 mm x 100 mm sized I-beam which is available in the market. For testing rig, its strength and rigidity must be able to withstand the maximum load that can cause failure to an I-beam specimen.
Figure 2. Size of I-beam specimen
[image:3.595.113.241.197.311.2]Based on the size of the I-beam specimen, the details design of the testing rig is shown in (Figure 3). In this design, I-beam specimen is positioned in the middle of the testing rig and supported by two adjustable blocks. During the testing, the load is applied in the middle of I-beam in a vertically downward direction using a hydraulic jack and measured by a load cell. For measuring the deformation of I-beam, the dial gauge is positioned at the bottom of I-beam and attached to the testing rig.
Figure 3. Testing rig design layout
For this design, the main structure of the testing rig is also made of I-beam. The selection of this beam is based on high resistance to the axial load. The size of the I-beam proposed is 105 mm x 155 mm size with a thickness of 7 mm.
2.2. Finite Element Analysis (FEA) of the Testing Rig Design
FEA is carried out for the I-beam and testing rig to evaluate the strength and rigidity to ensure the validity of
[image:3.595.312.534.269.357.2]the result produced. In the analysis, both models will be evaluated for 3 different spans as shown in (Table 1).
Table 1. Support span each cases
Cases Support span (L)
1 100 mm
2 500 mm
3 1000 mm
The analysis of I-beam is carried out by applying 10 kN load on the middle span of the I-beam specimen while both ends of the I-beam specimen are attached by fixed supports. The boundary condition of the I-beam explained in (Figure 4).
Figure 4. The boundary condition of I-beam
Then, the testing rig is analyzed using the same load used for the I-beam. The loads from the I-beam specimen are applied downward on the two support blocks while the load from the jack is applied upward to the top bar of the testing rig. The overall boundary conditions of the testing rig can be seen in (Figure 5).
Figure 5. The boundary condition of the testing rig
3. Results and Discussion
[image:3.595.64.285.456.588.2] [image:3.595.314.533.467.602.2]3.1. FEA Result of the I-Beam Model
[image:4.595.318.523.82.226.2]FEA result shows both stress and deformation concentration of the I-beam model in each case occurs in the middle of I-beam as shown in (Figure 6).
Figure 6. (a) von Mises stress and (b) Deformation of the I-beam model
[image:4.595.64.282.151.257.2]The overview FEA result of the I-beam model can be seen in (Table 2). The result shows that in case 1 the stress is below 250 MPa, the standard structural steel yield stress. Therefore, the I-beam did not fail in this case. However, in cases 2 and 3 the I-beam was failed under 10 kN load.
Table 2. FEA result of specimen I-beam
Cases I-beam stress [MPa] I-beam deformation [mm]
1 204.22 0.13
2 371.35 1.30
3 607.17 11.49
3.2. FEA Result of the Testing Rig Model
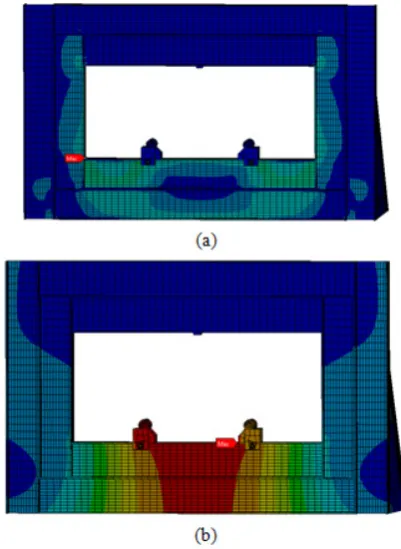
For case 1, the stress concentration is spread throughout the bottom and the sidebar. The maximum stress that occurs is 18.18 MPa while the maximum deformation is 0.06 mm as shown in (Figure 7).
Figure 7. (a) von Mises stress and (b) Deformation from case 1
Whereas in case 2, the stress distribution concentrates more on the sidebar than in case 1, with the maximum stress occurring at 16.35 MPa. The maximum deformation also occurs in the middle of the bar with a value of 0.05 mm as shown in (Figure 8).
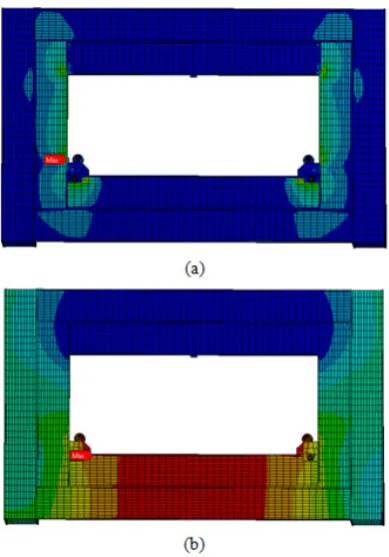
In case 3, the stress concentrated on both side structure of the testing rig with a maximum stress of 7.89 MPa. Meanwhile, the maximum deformation counted at 0.01 mm as shown in (figure 9).
[image:4.595.319.520.410.685.2]An overview of the FEA results on the test rig can be seen in (Table 3). From these results, the safety factors and deformation percentages can be calculated.
[image:4.595.73.278.527.667.2]Figure 9. (a) von Mises stress and (b) Deformation of case 3
An overview of the FEA results on the test rig can be seen in (Table 3). From these results, the safety factors and deformation percentages can be calculated
Table 3. FEA result of the testing rig
Cases Testing rig stress [MPa] Testing rig deformation [mm]
1 18.18 0.06
2 16.35 0.05
3 7.98 0.01
3.3. Safety Factor
From the stress results, the safety factor of the testing rig under 3 cases can be calculated. All the results can be seen in (Table 4). From all of the 3 cases, the calculation result obtained more than 10, it can be concluded that the designed testing rig did not fail even after fully loaded with 10kN load.
Table 4. Safety factors
Cases Testing rig stress [MPa] Yield stress of structure steel [MPa] Safety factor
1 18.18
250
13.75
2 16.35 15.29
3 7.98 31.31
3.4. Deformation Percentage
From the deformation results, the deformation percentage of the test rig from the I-beam can be
[image:5.595.305.537.167.250.2]calculated. The calculation results are shown in (Table 5). It was found that in case 1 the deformation percentage is 43%, this result will affect the experiment test. However, in cases 2 and 3 the deformation percentage is less than 4%. Therefore in these two cases, the testing rig can be considered a rigid body.
Table 5. Deformation percentage
Cases deformation Testing rig [mm]
Specimen deformation
[mm]
Deformation percentage [%]
1 0.06 0.13 43.04
2 0.05 1.30 3.68
3 0.01 11.50 0.13
4. Conclusions
FEA was performed to determine the strength and rigidity of the testing rig when the 10kN load applied. The FEA results show an excellent result in all cases in terms of safety factors by reaching more than 10 in each case. Due to that, the testing rig can be assumed to be able to sustain a 10kN load. In terms of testing rig deformation percentage, case 1 produces 43%. This result can affect the experimental test. However, case 2 and 3 shows an excellent result by produced less than 4%. Therefore, the testing rig can be considered as a rigid body. The evidence from this study suggests that the testing rig can be used to evaluate the specimen with the length between 500 mm to 1000 mm for 43 mm x 43 mm sized I-beam or smaller under 10kN load. On the basis of this evidence, a testing rig is fabricated following the proposed design.
Acknowledgements
In this paper, testing rig design for a three-point bending test of thin-walled structural steel was created in the framework of the research study at University Teknikal Malaysia Melaka (UTeM). The authors would like to thank Applied Mechanical Design laboratory UTeM for the support throughout this study. The authors gratefully acknowledge UTeM that provided access to use the pictures and all journals that provide open access articles that supported this work.
REFERENCES
J. Abry, C. Mittelhaeuser, S. Wolf, and D. Turlier, [1]
[image:5.595.59.294.630.701.2]Y. B. Sudhirsastry, Y. Krishna, and P. R. Budarapu, [2]
“Parametric studies on buckling of thin walled channel beams,” Comput. Mater. Sci., vol. 96, no. PB, pp. 416–424, 2015.
D. Lanc, T. P. Vo, G. Turkalj, and J. Lee, “Buckling analysis [3]
of thin-walled functionally graded sandwich box beams,” Thin-Walled Struct., vol. 86, pp. 148–156, 2015.
X. Cheng and Y. Chen, “Ultimate strength of H-sections [4]
under combined compression and uniaxial bending considering plate interaction,” J. Constr. Steel Res., vol. 143, pp. 196–207, 2018.
A. H. Keykha, “Investigation of load Increment in Hollow [5]
Steel short and slender Columns Strengthened using CFRP,” vol. 31, pp. 163–169, 2015.
K. Y. Ning, L. Yang, H. Y. Ban, and Y. N. Sun, [6]
“Experimental and numerical studies on hysteretic behaviour of stainless steel welded box-section columns,” Thin-Walled Struct., vol. 136, no. 2018, pp. 280–291, 2019. J. Jelovica, J. Romanoff, and H. Remes, “In fl uence of [7]
general corrosion on buckling strength of laser-welded web-core sandwich plates,” JCSR, vol. 101, pp. 342–350, 2014.
T. CHEN, Q.-Q. YU, X.-L. GU, and X.-L. ZHAO, “Study on [8]
Fatigue Behavior of Strengthened Non-Load-Carrying Cruciform Welded Joints Using Carbon Fiber Sheets,” Int. J. Struct. Stab. Dyn., vol. 12, no. 01, pp. 179–194, 2012. P. Colombi, A. Bassetti, and A. Nussbaumer, “Crack growth [9]
induced delamination on steel members reinforced by prestressed composite patch,” Fatigue Fract. Eng. Mater. Struct., vol. 26, no. 5, pp. 429–437, 2003.
Y. Wang, J. A. Wharton, and R. A. Shenoi, “Ultimate [10]
strength analysis of aged steel-plated structures exposed to marine corrosion damage : A review,” Corros. Sci., vol. 86, pp. 42–60, 2014.
Z. G. Xiao, X. L. Gu, X. L. Zhao, T. Chen, and Q. Q. Yu, [11]
“Fatigue behaviour of CFRP strengthened steel plates with different degrees of damage,” Thin-Walled Struct., vol. 69, pp. 10–17, 2013.
S. M. J. Razavi, M. R. Ayatollahi, C. Sommitsch, and C. [12]
Moser, “Retardation of fatigue crack growth in high strength steel S690 using a modified stop-hole technique,” Eng. Fract. Mech., vol. 169, pp. 226–237, 2017.
Y. Q. Wang, L. Zong, R. X. Zhu, X. Y. Liu, and Y. J. Shi, [13]
“Behavior of I-section steel beam welding reinforced while under load,” J. Constr. Steel Res., vol. 106, pp. 278–288, 2015.
S. Kang, B. Yang, Y. Zhang, M. Elchalakani, and G. Xiong, [14]
“Global buckling of laterally-unrestrained Q460GJ beams with singly symmetric I-sections,” J. Constr. Steel Res., vol. 145, pp. 341–351, 2018.
N. Nagabhooshanam, S. Baskar, P. K. Nagarajan, and K. S. [15]
Kumar, “Design and Fabrication of Fatigue Test Rig and Preliminary Investigation on Flax Composite Beam,” Mater. Today Proc., vol. 5, no. 5, pp. 11771–11779, 2018. M. I. Kabir and A. K. Bhowmick, “Applicability of North [16]
American standards for lateral torsional buckling of welded I-beams,” J. Constr. Steel Res., vol. 147, pp. 16–26, 2018.
X. Cheng, D. Duan, and Y. Chen, “Sectional constitutive [17]
model for the thin-walled steel H-section beam-column element,” J. Constr. Steel Res., vol. 156, pp. 202–214, 2019. G. Previati, M. Gobbi, and G. Mastinu, “Measurement of the [18]
mass properties of rigid bodies by means of multi-filar pendulums – Influence of test rig flexibility,” Mech. Syst. Signal Process., vol. 121, pp. 31–43, 2019.
M. S. Yob, S. Mansor, and R. Sulaiman, “Finite Element [19]
Modelling to Predict Equivalent Stiffness of 3D Space Frame Structural Joint Using Circular Beam Element,” Appl. Mech. Mater., vol. 431, pp. 104–109, 2013.
M. S. Yob, S. Mansor, and R. Sulaiman, “Joint Stiffness of [20]
3D Space Frame Thin Walled Structural Joint Considering Local Buckling Effect,” Appl. Mech. Mater., vol. 660, pp. 773–777, 2014.
A. International, “D 6272 – 02 Standard Test Method for [21]