© 2017, IRJET | Impact Factor value: 5.181 | ISO 9001:2008 Certified Journal | Page 690
Design and Development of All-Terrain Vehicle : Volume 1
Karan Sangaj
1, Aditya Suryawanshi
2, Sudarshan Shinde
3, Shubham Lad
41,2,3,4
UG , Department of Mechanical Engineering ,
KIT's College of Engineering , Kolhapur , India.
---***---Abstract- The objective of this project is to design andmanufacture a racing vehicle-ATV (All-Terrain Vehicle) for participation in competition like BAJA .The vehicle is designed by using mathematical modeling and computer-aided design and simulation by using a ANSYS software to make vehicle able to run and perform efficiently on different terrains like rocky, muddy, lose gravel .the important parameter to select for chassis are material, its shape and cross section area. This optimized parameter made the vehicle light weight, stable, efficient with having high strength and durability. In this study we deal with manufacturing and development of frame/chassis of vehicle by using steps like Material Selection, Cross-section Selection, and Frame design parameters, Analysis Parameters, Iterations, Analysis and Simulation. So vehicle can be manufactured with compact design, maximum performance as well as safety.
Key Words: ATV, Roll Cage, Chassis, Material Selection, Cross-section Selection, Frame Design, Analysis, ANSYS.
1. INTRODUCTION
The vehicle chassis includes the suspension and steering systems, frames ,tires, brakes, axles, and wheels [1] .ATV (All-Terrain Vehicle) is designed to operate in difficult and circuitous terrains. ATV consists of three main parts. These are chassis, drive train and suspension. In this study we deal with developing a unit of ATV called chassis/frame. The chassis is considered to be one of important parts of an automobile. Various important parts like the engine and the drive train, the axle assemblies, the suspension system, the brakes, the steering system, etc., are bolted on chassis. It provides the strength, rigidity required to support the different components. By designing the chassis with optimized parameter the level of noise and vibrations from different components is greatly reduced. To achieve this, Chassis should be rigid, so it can withstand different stresses and shocks (bending and torsional moments). So, strength and stiffness are two important factors considered while designing. Before manufacturing; Finite Element Analysis (FEA) is done to ensure designed chassis can withstand the loads and stresses acing on it.
2. MATERIAL AND CROSS-SECTION SELECTION
The AISI grade is considered for the frame design due to its mechanical properties and chemical composition. The AISI grade contains high carbon percentage as well as high yield
strength and ultimate tensile strength. it is also cost effective as well as easily available.
Property AISI 1018 AISI 4130
Carbon Content (%) 0.14-0.20 0.28-0.33
Density (g/cc) 7.87 7.85
Elongation at Break (%) 15 25.5 Modulus of Elasticity(GPa) 200 205 Ultimate strength (MPa) 440 670
Yield Strength (MPa) 370 435
Table 1: Material Comparison
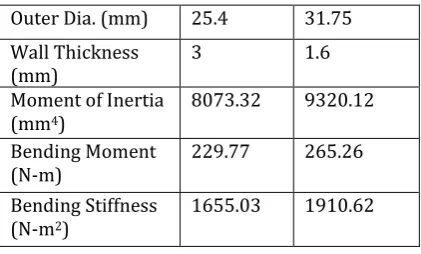
From above table it is seen that yield strength and ultimate strength of the AISI 4130 is much higher compared to AISI 1018. Another factor is density, density of AISI 4130 is less than AISI 1018 therefore the material chosen is AISI 4130. AISI 4130 provides better safety and is less bulk frame so the total vehicle weight is reduced.
Outer Dia. (mm) 25.4 31.75 Wall Thickness
(mm) 3 1.6
Moment of Inertia (mm4)
8073.32 9320.12
Bending Moment
(N-m) 229.77 265.26
Bending Stiffness (N-m2)
[image:1.595.329.540.435.562.2]1655.03 1910.62
Table 2: Cross-section for AISI 1018
Outer Dia. (mm) 25.4 31.75 Wall Thickness
(mm) 3 1.6
Moment of Inertia (mm4)
8073.32 9320.12
Bending Moment
(N-m) 270.15 311.86
Bending Stiffness
[image:1.595.335.534.587.716.2](N-m2) 1655.03 1910.62
Table 3: Cross-section for AISI 4130
© 2017, IRJET | Impact Factor value: 5.181 | ISO 9001:2008 Certified Journal | Page 691
series has higher strength than AISI-1018 [3]. Also anotherfactor for the cross-section selection was the market availability which is important criteria if we want to make this frame feasible for manufacturing.
Moment of Inertia (I) is calculated by using equation
I = (π/64)*(O.D4 - I.D4)
Bending stiffness is calculated by using equation
Bending Strength = σy*I/C
Bending Strength is calculated by using equation
Bending Stiffness = E*I
3. FRAME DESIGN CONSIDERATIONS
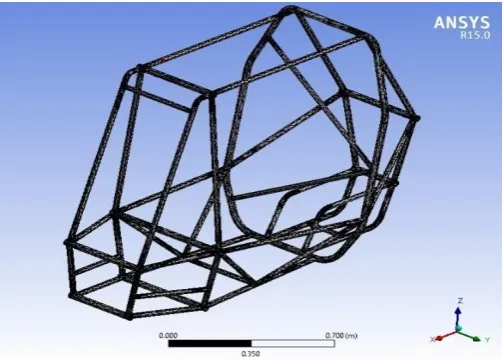
[image:2.595.350.523.370.427.2]Frame is designed by keeping in mind the driver’s safety, a minimum clearance is given to the entire roll-cage member from drivers’ body. Frame is also designed giving priority to those parameters which are essential for driver’s safety and vehicle stability. Another consideration is to keep driver in comfort therefore ergonomics consideration is an important priority. Driver’s position is kept as comfortable as possible by trying different sitting positions possible. The back angle is kept slightly slant to back at an angle of 5-10 degree from vertical position.
Figure 1: 3D RENDERED CATIA MODEL OF CHASSIS
Other parameters like weight, durability, and cost, simple and aesthetically appealing design were taken into considerations. By considering the other subsystem assemblies like engine, transmission, steering, suspensions and brakes, frame is so designed that all the subassemblies could be connected to the frame.
4. FRAME ANALYSIS PARAMETRS
The objective of analysis of frame is to ensure that frame has adequate factor of safety even in worst case scenarios/ impacts/ collisions to ensure driver safety. it also ensures that it has greater torsional stiffness ,less deflection under dynamic loading and static loading, natural frequency of the roll cages does not matches with the engine working range frequency to avoid resonance. The value of force to be applied on the frame could be obtained by using Impulse Method or G-Force Method. G-Force Method is widely used method when prototype testing is not a feasible solution. Mathematically,
G = m*g = 250*9.81 = 2452.5 N [2].
Where,
M=mass of the vehicle g= acceleration due to gravity
Different static analysis or collisions are Front Impact, Rear Impact, Side Impact and Roll over test. The applied forces in different static analysis or collisions are as follows.
Front impact 4G
Rear impact 3G
Side impact 2G
[image:2.595.39.286.453.650.2]Roll over 1.5G
Table 4: G-force Applied
5. ANALYSIS
Analysis of frame is necessary in order to determine the induced maximum stresses and maximum deflection. For the analysis of frame we have used ANSYS 15 software. The impact tests and their deformed shape and stress analysis are as follows.
[image:2.595.309.561.557.737.2]© 2017, IRJET | Impact Factor value: 5.181 | ISO 9001:2008 Certified Journal | Page 692
In Figure 2: Meshing Of Chassis, initial settings are PhysicsPreference is mechanical, Element Size is default, Smoothing is Low, Transition is Fast, Span Angle Center is Coarse, Transition Ratio is 0.272, Growth Rate is 1.2, total Nodes are 130745 and total Elements are 69211.
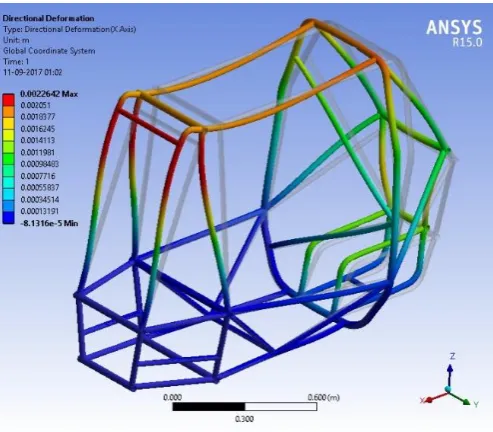
[image:3.595.312.559.203.419.2] [image:3.595.37.287.217.427.2]Front Impact: For the front impact the rear suspension points are kept fixed. After fixing rear suspension points the force of 4G is applied on the front part of the frame.
Figure 3: Total Deformation in front impact
[image:3.595.38.296.524.737.2]Figure 3: Total Deformation in front impact, shows total deformation of chassis when force of 4G (9810N) is acted on front part of chassis. From above figure it is observed that the maximum deflection is 4.8029 mm.
[image:3.595.42.559.525.740.2]Figure 4: Maximum Stress in front impact
Figure 4: Maximum Stress in front impact, shows maximum stress occurred in chassis when force of 4G (9810N) is acted on front part of chassis. From above figure it is observed that the maximum stress occurred in body is 253.56 Mpa.
Rear Impact: For the rear impact the front suspension points are kept fixed. After fixing front suspension points the force of 3G is applied on the rear part of the frame.
Figure 5: Total Deformation in rear impact
Figure 5: Total Deformation in rear impact, shows total deformation of chassis when force of 3G (7357.5N) is acted on rear part of chassis. From above figure it is observed that the maximum deflection is 2.6420 mm.
[image:3.595.300.553.525.738.2]© 2017, IRJET | Impact Factor value: 5.181 | ISO 9001:2008 Certified Journal | Page 693
Figure 6: Maximum Stress in rear impact, shows maximumstress occurred in chassis when force of 3G (7357.5N) is acted on rear part of chassis. From above figure it is observed that the maximum stress occurred in body is 283.67 Mpa.
[image:4.595.310.559.231.434.2]Side Impact: For the side impact the suspension points of the other side of the side of impact is kept fixed. After fixing suspension points, the part of the side of impact is applied with the force of 2G.
Figure 7: Total Deformation in side impact
Figure 7: Total Deformation in side impact, shows total deformation of chassis when force of 2G (4905N) is acted on side part of chassis. From above figure it is observed that the maximum deflection is 0.5990 mm.
Figure 8: Maximum Stress in side impact
Figure 8: Maximum Stress in side impact, shows maximum stress occurred in chassis when force of 2G (4905N) is acted on side part of chassis. From above figure it is observed that the maximum stress occurred in body is 179.16 Mpa.
Roll Over: For the roll-over condition the bottom suspension points are kept fixed. After fixing bottom suspension points, the point which comes in contact with ground first when roll over occurs is applied with the 1.5G force.
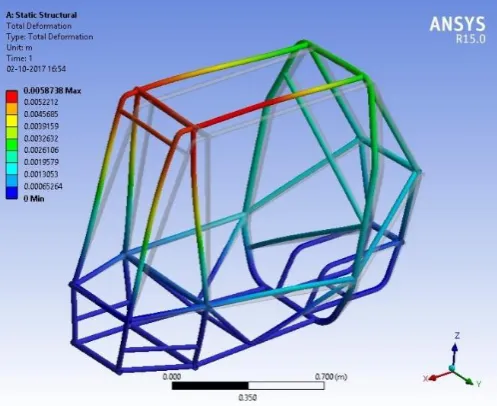
Figure 9: Total Deformation in Roll-over
Figure 9: Total Deformation in Roll-over, shows total deformation of chassis when force of 1.5G (3678.75N) is acted when roll-over condition is occurred. From above figure it is observed that the maximum deflection is 5.8738mm.
[image:4.595.37.558.541.745.2]© 2017, IRJET | Impact Factor value: 5.181 | ISO 9001:2008 Certified Journal | Page 694
Figure 10: Maximum Stress in Roll-over, shows maximumstress occurred in chassis when force of 1.5G (3678.75N) is acted when roll-over condition is occurred. From above figure it is observed that the maximum stress occurred in body is 172.26 Mpa.
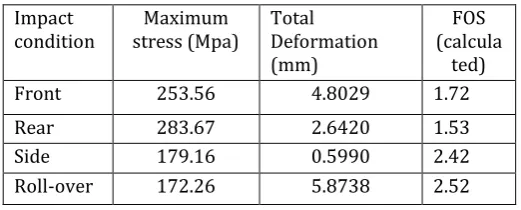
6. RESULTS
The different test gave us the maximum stresses and deformed shape. As we know value of stresses on frame, we can find the FOS with it, as we know that FOS is the ratio of Yield Strength of material to the Maximum stress occurring on body.
Mathematically,
FOS = σy / (Max. Stress)
The overall Results are tabulated as follows.
Impact
condition stress (Mpa) Maximum Total Deformation (mm)
FOS (calcula
ted)
Front 253.56 4.8029 1.72
Rear 283.67 2.6420 1.53
Side 179.16 0.5990 2.42
[image:5.595.29.290.334.439.2]Roll-over 172.26 5.8738 2.52
Table 5: Results
7. CONCLUSION
From above results we conclude that FOS is greater than 1 in all conditions so frame is safe. the maximum deflection occurs in the Roll-over condition, the value of which is 5.8738 mm. in this study we have already discussed that there is clearance between driver’s body and frame, this clearance is more than maximum deflection and therefore we can conclude that even in worst condition there is no harm to driver.
8. REFRENCES
1. Gilles, Tim. “Automotive Chassis: Brakes, Suspension, and Steering” /Tim Gilles. ISBN 1-4018-5630-6. Pg. 3.
2. Nordhoff , Larry S. “Motor Vehicle Collision Injuries: Biomechanics, Diagnosis, and Management”/Lawrence S. Nordhoff, Jr. - Second Edition. Pg. 604 .