© 2018, IRJET | Impact Factor value: 6.171 | ISO 9001:2008 Certified Journal | Page 3714
Classification of Mass in Mammograms by Asymmetric Texture
Features
Esma Uzunhisarcıklı
1, Volkan Göreke
21
Asc.Proffesor, Erciyes University, Kayseri, Turkey
2Lecturer, Cumhuriyet University, Sivas, Turkey
---***---Abstract
-Breast cancer is a malignant tumour that forms inthe cells of breasts. Mammogram is the X-Ray image of the breast where low-dose radiation is used. Asymmetry analysis between the left and right mammographies of a patient can provide significant information about the existence of a tumour at early stages. Diagnosis of breast cancer with the investigation of bilateral asymmetry is difficult because the asymmetric symptoms are vague which can be seen in the mammography. In this study, a computer-aided model was applied to enhance the positive predictivity value for mammograms with asymmetry. The method consists of two stages: image processing and classification. In the image processing stage, the mammograms with noise were filtered and the low-contrast problem was resolved. ROIs were obtained from the mammogram image with mass and the symmetry image without mass. Primary and secondary texture features were obtained from ROIs. Mass classification in asymmetric mammograms was realized via neural networks using texture features. The performance of the method was measured in sensitivity and specificity values which were calculated as %93 and %93 respectively. The performance values show that the proposed method increase the positive predictivity value in the computer-aided interpretation of asymmetry regions. The specified feature set and the use of network structure as the classifier can be utilized to obtain better results in computer-aided systems.
Key Words: CAD, Breast Mass, Artificial Neural Network, Mammogram, Asymmetry
1.INTRODUCTION
Breast cancer is a malignant tumour that forms in the cells of breasts [1]. It has been a significant cause of death among women worldwide for the past few decades according to the reports of World Health Organization. The symptoms of the cancer can be detected with the mammogram images which are obtained by using low-radiated X-Rays [2].
Bilateral asymmetry is defined as one of the four breast cancer symptoms by American College of Radiology [3,4]. The breasts should be compared as symmetric organs and internal structure should be very symmetric [5]. This strategy is used to detect anomalies while scanning the mammographies and it consists of comparing the right and left breast images side by side [6]. The analysis of the right and left mammographies provides the observation of tumorigenic variations at an early stage where more evident cancer symptoms do not exist yet [3,4].
In recent years, there have been many studies that rely on computational methodologies to help specialists in the interpretation of radiological images [7,8,9,10]. These computer-aided diagnosis (CAD) systems provide a second source of information and an enhanced success rate in the diagnosis of diseases such as breast cancer in modern medicine [7,8,11,12]. Supervised learning artificial neural network is a fundamental technique which is used in CAD systems for the classification of candidate regions as tumorous mass [8].
In this study, a total of 30 tumorous and normal (without tumour) mammograms from MIAS database were used. Preprocessing and image enhancement were applied on these images. ROI regions were obtained by manually cutting the mass areas that are defined in pixel coordinates in MIAS database and also the corresponding symmetry regions of these images in 16x16 pixels. 8 primary and secondary texture features were extracted from the ROIs. Artificial neural network (ANN) structure was designed using these features for classification of the mass as benign or malignant.
In Section 1, the investigation of the right and left breast images and diagnosis using asymmetry feature is explained. In Section 2, the image database and the software toolboxes used in the study were introduced. In Section 3, the scope of the study, image processing stages and the feature extraction process were explained. In Section 4, ANN was designed, classification and the performance tests were realized.
2. MATERIAL AND METHOD
By searching the bilateral asymmetry in the open access Mammographic Image Analysis Society (MIAS) database, 15 pairs of breast mammogram images (left-right) were detected and used. 9 of these images have malignant symptoms, while 6 of them have benign symptoms. Each image is 1024x1024 pixels and has a thickness of 200 microns. A software was developed using MATLAB Image Processing and Statistics Toolboxes. A feed-forward network-type ANN was designed for classification using MATLAB Neural Network Toolbox
3. SCOPE OF STUDY
© 2018, IRJET | Impact Factor value: 6.171 | ISO 9001:2008 Certified Journal | Page 3715 developed to detect the differences between the breast
tissue density [13,14] based on various feature sets incuding shape, brightness, topological features [20] and the directional features that depend on Gabor wavelets [21, 22].
3.1 Image Preprocessing
The purpose of image preprocessing is to simplify the detection of anomalies and to limit the search process of anomalies by removing the extreme background effects [9, 23]. The images obtained from MIAS database contain noise, label data and digitization noise (some straight lines). These undesirable components were removed from the image using filtering and morphological operations.
Median filter is a commonly used statistical filter in which the neighboring pixels are sorted and the middle pixel value is used as the median [24]. Every output pixel includes a median value at a 5x5 neighborhood of the center input pixel [25].
Morphology is used for object extraction and noise removal purposes. The most fundamental morphological operations are opening which is defined as adding pixels to the edges of the object, and closing which is defined as removing pixels from the edges of the object [10]. The method introduced by Otsu in 1979 looks for an optimum threshold value to classify the pixel values of a gray-scale image as 0 or 1 [26]. The undesirable components such as labels were removed from the image by morphological opening and closing operations after the image was converted to binary format by applying Otsu global thresholding on the original image.
3.2 Contrast Enhancement
Contrast enhancement was realized by using contrast-limited adaptive histogram equalization (CLAHE) method.
In this method, the pixels are mapped using their four closest neighbors. The regions are divided to groups according to their neighborhoods while the bottom regions are combined together using bi-linear interpolation. This method is used in medical images for both noise reduction and removal of edge shadow effects in the homogenous areas [27].
The images for each step applied to a sample image are shown in Figures (1-6) respectively.
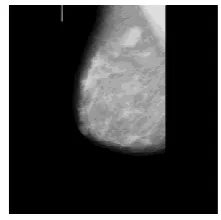
[image:2.595.377.488.76.186.2]Figure -1: Mammogram image mdb015 obtained from MIAS
Figure -2: The image after the application of median filter
Figure -3: Binary image after the application of global thresholding
Figure -4: The image after the application of morphological operations
Figure -5: The image after the application of adaptive histogram equalization
[image:2.595.378.491.215.319.2] [image:2.595.105.219.641.741.2]© 2018, IRJET | Impact Factor value: 6.171 | ISO 9001:2008 Certified Journal | Page 3716 3.3 Feature Extraction
In this study, Haralick texture features were calculated using Gray Level Co-Occurence Matrices (GLCM). GLCM depends on the estimation of second order compound probability density function P(i, j | d, θ). This matrix denotes the possibility of passing from gray-level i to gray-level j when the distance between the pixels are d and the angle is θ [28]. In this study, a total of eight features were extracted for parameters d=1 and θ=0 that have a good performance in image processing [29]. The extracted features are energy, contrast, homogeneity,entropy and correlation (second order), mean and standard deviation (first order) and the texture correlation between the original image and the preprocessed image.
Texture analysis methods are used in the interpretation of medical images. Texture is a set of the statistical features of the pixel density. The gray-levels of two different pixels at different regions are compared [28]. The texture features can be calculated using the statistical features that depend on the co-occurence matrices [30].
GLCM is one of the best known texture analysis tools for the calculation of the second order statistical image features. These texture features are knows as Haralick texture features which are used for classification and segmentation purposes [31].
The mathematical expressions of features are given in Equations (1-8) .
2 , 2 , , , , 1 ( ) log ij i j ij i j ij i j
ij x y i j
x y
ij ij i j
Energy p
Conrast i j p
p Homogeneity
i j
ij p Correlation
Entropy p p
where µx, µy, σx and σy are the mean and standard deviation of the rows and columns of the probability density function pij.
First order texture measures are calculated from the original image values. They do not consider the relationships with neighborhood pixel [32].
I is the image matrix, x and y are the coordinates. m, n represents the size of the matrix.
2 2
(
)(
)
(
)
(
)
i m i m
i
i m i m
i i
x
x
y
y
r
x
x
y
y
where xi is the intensity of the ith pixel in image 1, yi is the intensity of the ith pixel in image 2, xm is the mean intensity of image 1 and ym is the mean intensity of image 2 and r is the correlation coffecient.
4. Artifical Neural Network
Usually, an artificial neural network can be considered as an information system consisting of simple connected process elements such as neurons that form the network. The artificial neural network, which consists of the input layer, the hidden layer and the output layer, may expose complex behaviours to generate the expected outputs via supervised or unsupervised learning. The learning process adjusts the connection weights between neurons [8].
The basic structure of a neuron can be modelled as shown in Figure 7. Here, X{xi, I= 1,2,…,n} is the neuron input and
Y
isthe output. Every input is multiplied by its weight, the bias value is added and transferred as the input of the transfer/activation function f. The relationship between the input and output is shown with Equation 9 below. Although there are various artificial neural networks in medical image processing, the most commonly used one is feed-forward network where the architectural information flow is in the forward direction [33].
A method that relies on the cross-validation techique can be used when there is not enough data to construct a reliable network structure [34].
In this study, multi-layer perceptron structure, which is a special feed-forward neural network structure, is used. The designed artificial neural network has a hidden layer. The hidden layer consists of three neurons while the output layer consists of a single neuron. The transfer function of the hidden layer is the tangent sigmoid and the transfer function of the output layer is linear. Levenberg-Marquardt back propagation algorithm was chosen as the learning algorithm. The eight inputs of the artificial neural network consists of texture features of the images. The output of the network is 1 for images that contain mass and 2 for images that do not contain mass.
1 n
i i i
Y
f
w x b
© 2018, IRJET | Impact Factor value: 6.171 | ISO 9001:2008 Certified Journal | Page 3717 Figure -7: The basic structure of a neuron
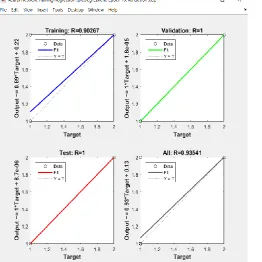
[image:4.595.36.288.288.441.2]The designed network structure is shown in Figure 8 and the neural network train regression graphs are shown in Figure 9.
[image:4.595.38.301.484.746.2]Figure -8:The designed ANN structure
Figure -9: ANN regresssion graphs
The performance measurement of the test can be realized by calculating the sensitivity of the system. The sensitivity and specificity is expressed in Equation 10 and Equation 11 respectively [22]. Here,
TP: classified as mass when it is a mass in real
FN: classified as not mass when it is a mass in real
FP: classified as mass when it is not a mass in real
TN: classified as not mass when it is not a mass in real
Sensitivit
TP
T
F
y
P
N
Specificit
TN
T
F
y
N
P
The sensitivity and specificity were calculated via the network output as %93 and %93 respectively.
5. CONCLUSIONS
As a result, the use of artificial neural networks can be a suitable method especially for CAD systems. Here, not only the existence of the mass but also the type of the mass (benign or malignant) can be determined by using more features as the input of the neural network or by having network structures with more layers.
In the literature, in a similar study which uses the same dataset, the sensitivity and specificity were calculated as %83 and %75 respectively[35].
In our study, higher success rates were acquired. Therefore, it can be expressed that the feature set and ANN type classifier that were used in our study, may lead to more succesful results for CAD systems.
ACKNOWLEDGEMENT
This study is supported by Erciyes University Scientific Researce Project Unit with an ID 6629.
REFERENCES
[1] F.A.González and E. Romero ,Biomedical Image Analysis
and Machine Learning Technologies: Applications and Techniques, IGI Global,USA,2010.
[2] P.Agrawal, M.Vatsa, R.Singh, “Saliency based mass
detection from screening mammograms” , Signal Processing, 99, 2014, pp. 29–47.
[3] American College of Radiology, Breast Imaging
Reporting and Data System in: Va.Reston (Ed.), Breast Imaging Reporting and Data System,(BI-RADS),1995.
(10)
© 2018, IRJET | Impact Factor value: 6.171 | ISO 9001:2008 Certified Journal | Page 3718
[4] C.W. Picolli, S.A. Feig, J.P. Palazzo, “ Developing
asymmetric breast tissue”, 211(1),1999, pp. 111-117.
[5] DB.Kopans, Breast imaging. 3rd. ed. Lippincott Williams
& Wilkins, 2007.
[6] J.A.Harvey, B.T.Nicholson, Cohen, M.A., “Finding early
invasive breast cancers: a practical approach.” 248(1), 2008, pp. 61-76.
[7] B.W.Sampaio, M.E.Diniz, A.C.Silva, A. C. Paiva, A, M.
Gattlass,“Detection of masses in mammogram images using CNN, geostatistic functions and SVM”, Computers in Biology and Medicine, 41, 2011, pp. 653-664.
[8] J.Ren, “ANN vs. SVM: Which one performs better in
classification of MCCs in mammogram
imaging”,Knowledge-Based Systems, 26, 2012, pp. 144-153.
[9] J. Dheeba, N.A. Singh, S.T. Selvi,”Computer-aided
detection of breast cancer on mammograms: A swarm intelligence optimized wavelet neural network approach” ,Journal of Biomedical Informatics, 49, 2014, pp. 45-52.
[10] H.Mohameda, S.Mai, M.S. Mabroukb,
Sharawy,”Computer aided detection system for microcalcifications in digital mammograms”, Computer Methods and Programs in Biomedicine,116, 2014, pp. 226-235.
[11] S. Gomez, M.R. Tabanera, A.V. Bolivar, M.S. Miranda, A.B.
Mazo, M.R. Diaz, P.M. Miravate, E.L. Asturiano, P.M.Cacho, T.D. Macias, “Impact of a CAD system in a screen-film mammography screening program: A prospective study”, European Journal of Radiology, 80, 2011, pp. 317- 323.
[12] J.A.Tang, R.M. Rangayyan, J. Xu, I.E. El Naqa, Y. Yang,
“Computer-aided detection and diagnosis of breast cancer with mammography: Recent advances”, IEEE Transactions on Information Technology in Biomedicine, 13, 2009, pp. 236 – 251.
[13] G.Manga, P.Casti, S.V. Jayaraman, M.Salmeri, A.
Mencattini, E.Martinelli, C. DiNatale, “ Identification of mammography anomalies for breast cancer detectionby an ensemble of classification models based on artificial immune system.” , Knowledge Based Systems, 101,2016, pp. 60-70.
[14] M.Abdel-Nasser, A.Moreno, D.Puig,” temporal
mammogram image registration using optimized curvilinear coordinates”, Computer Methods and Programs in Biomedicine, 127, 2016, pp.1-14.
[15] F.F.Yin, M.L. Giger, K.Doi,
C.J.Vyborny,R.A.Schmidth,”Computer detection of mass in digital mammograms:automated alignment of breast
images and its effect on biletarel subtraction techinue”, Medical Physics, 21(3),1994,pp.445-452.
[16] D.R.Ericea, A.C.Silva, A.C.de Paiva, M.Gaddas,”Dedection
of masses based on asymmetric regions of digital bilateral mommograms using spatial description with variog ram and cross-variogram functions”, Computers in Biology and Medicine, 43(8),2013, pp. 987-999.
[17] X.Wang, L.Li, W.Xu,W.Liu, D.Lederman,B.Zyeng,
“Improving performance of computer aidded dedection of masses by incorporating bilateral mammographic density asymmetry:an assessment”, Academic Radiology” 19(3),2012,pp.303-310.
[18] N.Karssemeijer, G.Te Brake, “Combining single view
features and asymmetry for detection of mass lesions” in: N.Karssemeijer , M.Thijssen,J.Hendriks, L.Erning (Eds.), Digital Mammgrapy, 13,1998,pp.95-102.
[19] S.D. Tzikopoulos, M.E. Mavroforakis, H.V. Georgiou,
N.Dimitropoulos, S.Theodoridis,”A full automated schme for mammogramphic segmentation and classification based on breast density and asymmetry”, Computer Methods and Programming in Biomedicine, 102(1),2011,pp. 47-63.
[20] P.Miller, S.Astley,”Automated detection of
mammographic asymmetry using anatomical features”, International Journal of Pattern Recognation and Artificial Intelligence, 7(6),1993,pp.1461-1476.
[21] R.J.Ferrari, R.M.Rangayyan, J.E.L. Desault, A.F.
Frere,”Analysis of asymmetry in mammograms via
directional filtereing with Gabor
wavelet”,20(9),2001,pp.953-964.
[22] R.M.Rangayyan, R.J.Ferrari, A.F. Frere,”Analysis of
bilateral asymmetry in mammograms using directional, morphological and density features”, Journal of Electronic Imaging, 16(1),2007, 013003.
[23] I.K.Maitra, S.Nag, S.K. Bandyopadhyay, “Technique for
preprocessing of digital mammogram”, Computer Methods and Programs in Biomedicine,107,2012, 175-288.
[24] A.P.Dhawan, Editor M.Akay, Medıcal Image
Analysıs,Wiley,J & Sons,Inc Canada,2011.
[25] M.Nixon, A.Aguado, Feature Extraction & Image
Processing, Elsevier Ltd, UK,2008, 2nd Edition.
[26] C.C.Liu, C.Y Tsai, J. Liu, C.Y.Yu, S.S.Yu”, A pectoral muscle
© 2018, IRJET | Impact Factor value: 6.171 | ISO 9001:2008 Certified Journal | Page 3719
[27] K.I. Maitra, S.Nag, S.K. Bandyopadhyay, “Technique for
preprocessing of digital mammogram”, Computer Methods and Programs in Biomedicine,107,2012, 175-188.
[28] A.Demirhan, İ. Güler, “Özörgütlemeli Harita Ağları Ve
Gri Düzey Eş Oluşum Matrisleri İle Görüntü Bölütleme”, Gazi Üniv. Müh. Mim. Fak. Der.,25(2),2010, pp. 258-291.
[29] A.Eleyhan, H. Demirel, “Co-occurrence matrix and its
statistical features as a new approach for face recognition”, Turk J Elec Eng & Comp,19(1),2011, pp.97-107.
[30] R.P. Ramos, M.Z.Nascimento, D.C. Pereira, D. C. “Texture
extraction: An evaluation of ridgelet, wavelet and co-occurrence based methods applied to mammograms”, Expert Systems with Applications, 39(12), pp. 11036-11047.
[31] M.A.Tahir, A.Bouridane, F. Kurugöllü, A. Amira,
”Acceleratıng The Computatıon Of Glcm And Haralıck Texture Features On Reconfıgurable Hardware”, International Conference on Image Processing (ICIP),2004, pp.2857-2860.
[32] S.Selvarajah, s.r. Kodituwakku,”Analysis and comparison
of texture features for content based image retrieval”, International Journal of Latest Trends in Computing,2(1),2011,pp.108-113.
[33] J.Jiang, P. Trundle, J.Ren, “Medical image analysis with
artificial neural networks”,Computerized Medical Imaging and Graphics, 34, 2010, pp. 617-631.
[34] M.Saltan, S.Terzi, “Modeling deflection basin using
artificial neural networks with cross-validation technique in backcalculating flexible pavement layer modül”, Advances in Engineering Software, 39 2008, pp.588-592.
[35] P.Casti, A.Mencattini, M.Salmeri, A.Ancona, M.Lorusso,