http://dx.doi.org/10.4236/jmp.2015.66076
How to cite this paper: Davis, C.B., Busch, K.W., Rabbe, D.H., Busch, M.A. and Lusk, J.R. (2015) Rapid, Non-Destructive, Tex-tile Classification Using SIMCA on Diffuse Near-Infrared Reflectance Spectra. Journal of Modern Physics, 6, 711-718. http://dx.doi.org/10.4236/jmp.2015.66076
Rapid, Non-Destructive, Textile
Classification Using SIMCA on Diffuse
Near-Infrared Reflectance Spectra
Christopher B. Davis
1, Kenneth W. Busch
1*, Dennis H. Rabbe
1, Marianna A. Busch
1,
Judith R. Lusk
21Department of Chemistry and Biochemistry, Baylor University, Waco, USA 2Department of Family and Consumer Sciences, Baylor University, Waco, USA
Email: *[email protected]
Received 3 March 2015; accepted 5 May 2015; published 6 May 2015
Copyright © 2015 by authors and Scientific Research Publishing Inc.
This work is licensed under the Creative Commons Attribution International License (CC BY). http://creativecommons.org/licenses/by/4.0/
Abstract
Soft independent modeling of class analogy (SIMCA) was successful in classifying a large library of 758 commercially available, non-blended samples of acetate, cotton, polyester, rayon, silk and wool 89% - 98% of the time at the 95% confidence level (p = 0.05 significance level). In the present study, cotton and silk had a 62% and 24% chance, respectively, of being classified with their own group and also with rayon. SIMCA correctly identified a counterfeit “silk” sample as po-lyester. When coupled with diffuse NIR reflectance spectroscopy and a large sample library, SIMCA shows considerable promise as a quick, non-destructive, multivariate method for fiber identifica-tion. A major advantage is simplicity. No sample pretreatment of any kind was required, and no adjustments were made for fiber origin, manufacturing process residues, topical finishes, weave pattern, or dye content. Increasing the sample library should make the models more robust and improve identification rates over those reported in this paper.
Keywords
Diffuse Near-Infrared (NIR) Reflectance Spectroscopy, Chemometrics, Soft Independent Modeling of Class Analogy (SIMCA), Pattern Recognition, Textile Identification, Multivariate Analysis
1. Introduction
Textile screening has become increasingly important in the global economy to assure importers of fabric identity and to assess import fees and taxes. Four main methods of routine fabric characterization are currently used to
determine fiber identity of a textile: visual inspection, microscopy, flame testing, and solubility testing [1] [2]. Visual inspection is subjective; the last two methods are destructive; and even microscopic examination is often not conclusive. As a result, it would be extremely beneficial to have another characterization method that is rap-id, nondestructive and applicable to different fiber types regardless of differences in dyes, finishes, weaves, manufacturing process methods, or fiber origin.
To that end, the use of near-infrared (NIR) spectroscopy for textile screening has been studied by a number of workers. Because NIR spectra are generally broad and featureless, classification of samples into different cate-gories by means of NIR spectra requires some form of statistical analysis. For example, Howell and coworkers [3] used Mahalanobis distances at four or six pre-selected wavelengths in diffuse NIR reflectance spectra from 1100 - 2500 nm to identify fibers of acrylic, rayon, nylon, and polyester, although dark fabric dyes were found to severely impact the results. Jasper and coworkers combined NIR absorbance spectra from 1000 - 2500 nm with neural networks to identify 17 categories of fibers from a 390-sample library, most with confidence levels of 95% or better [4]. Cotton, however, showed a 51% chance of being misidentified, with a 32% chance of being classified as linen [4]. Pattern recognition has also been used to classify fabric weave patterns [5] [6], identify dyes [7], and grade yarns [8]. Fourier transformation of diffuse NIR reflectance spectra was reported to aid pat-tern recognition in distinguishing a limited number of pure fabrics and cotton-polyester blends [9].
The purpose of this study was to investigate the feasibility of classifying commercial textile samples as to ba-sic fiber type using diffuse reflectance NIR spectroscopy without any form of sample pretreatment and without any consideration of differences in textile weave, finish, dye, manufacturing process, or point of origin.
Statistical sample size is an important consideration in any statistical study, and one limitation of many of the previous studies cited above is that of limited population size. A key component of this study, therefore, is the development of an extensive textile library that more accurately reflects the wide assortment of six types of tex-tiles that are among the most commonly encountered in the marketplace. This library is, to the best of our knowledge, one of the largest ever reported for a textile pattern recognition study. In the present study, we did not consider fabric blends nor were we interested in comparing different chemometric algorithms.
While a number of multivariate classification methods with different merits exist, including linear discrimi-nant analysis (LDA) [10], linear discriminant analysis by regression (PLS-DA) [11], Mahalanobis distances [12] [13], k-nearest neighbors (k-NN) [14], and artificial neural networks [10] [15]-[17], soft-independent-modeling- of-class-analogy (SIMCA) was chosen for classification in this study [18].
SIMCA was chosen for this study for three reasons: 1) SIMCA is a well established classification method; 2) SIMCA is based on principal component analysis, which is well understood; and 3) the principal component models for different classes can be updated independently without having to redo the entire model. In addition, because SIMCA is a soft-modeling technique, samples can be classified into more than one category simulta-neously (i.e., it is possible, for example, for a hypothetical sample to be salty and sweet simultasimulta-neously). With these points in mind, it is worthwhile to discuss briefly how SIMCA goes about classification.
2. Theory
Consider a data matrix X that consists of the spectra of n different samples where each spectrum consists of in-tensity values taken at p wavelengths. Let us further suppose that all of the samples in X belong to a particular class or group. So X may be the spectra of 100 cotton samples, for example. The goal of principal component analysis is to break this data matrix down into a series of variance-scaled orthogonal vectors known as principal components so that
T
=
X TL + E (1)
T T T T
1 1 2 2 3 3 A A .
= + + + + +
X t l t l t l t l E (2)
In Equation (1), X is the original n
(
rows) (
×p columns)
data matrix, T is an n A× matrix known as the scores matrix where A is the number of principal components in the model, L is a p A× matrix known as the loadings matrix, the superscript T indicates the transpose of L, and E is an n p× matrix that respresents the re-sidual variance that is not explained by the model. In Equation (2), Ti i
t l are the orthogonal principal compo-nents that make up the model, where T
1 1
t l , the first principal component, explains more of the variance in X than
T 2 2
Now consider an unknown spectrum that we want to test to see if it belongs to the same class of samples that were used in X. The unknown spectrum xu will be a 1×p vector. To transform this raw vector into principal component space, we need to post-multiply it by the p A× loadings matrix L from the PCA model made from X. This converts the original spectral data into an estimate of a 1×A scores vector for the unknown sample,
ˆ
u = u
t x L, where tˆ is the estimate of the scores vector. Finally, we can post-multiply the estimate of the scores vector by the transpose of the loadings matrix. If we subtract the result from the original unknown spectrum xu
(
1×p)
, we can estimate the residual variance vector eu(
1×p)
:T
ˆ .
u= u− u
e x t L (3)
Equation (3) allows us to calculate the residual variance for the unknown sample that we are testing for class membership with the following equation:
2 2
1
.
p uj u
j
e s
p A
=
= −
∑
(4)The total residual variance for all the n samples in the PCA model will be
2 2
total 1 1
1
. 1
n p uj
i j
i
e s
n A = = p A
=
− − −
∑ ∑
(5)These two variances allow us to perform a Fischer’s F-test, which forms the ultimate basis of the classifica-tion method,
2
2 total
.
u
s F
s
= (6)
If, on the basis of the F-test, su2 and stotal2 are found to be the same statistically, the unknown sample is considered to belong to the group or category that made up the data matrix X.
If the samples of interest consist of q classes or categories, data matrices must be acquired for each class, Xq, and PCA models made. A given sample is then tested for membership in each class as described above.
3. Experimental
3.1. Textile Samples
Swatches of known commercially-available textiles were obtained from the Baylor University Department of Family and Consumer Science. Specimens, approximately one-inch square, were cut from these swatches and placed in acid-free polypropylene sleeves that were labeled with fiber type and a number indicating position in the data matrix. The identity of the textile was provided by the original supplier. NIR spectral analysis was con-ducted without any other form of sample pretreatment.
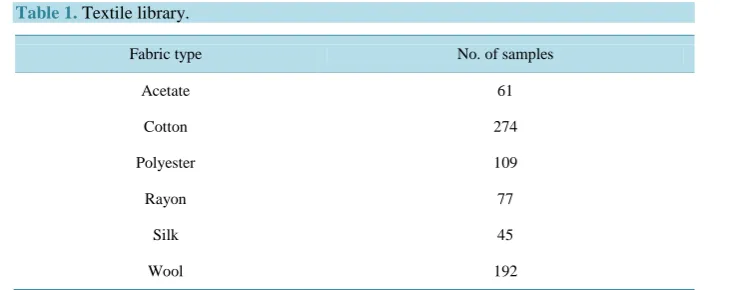
Because the textiles used in this study were commercially available and not pretreated prior to analysis, they could have a variety of fiber finishes and dyes. Therefore, the sample population was made as broad as possible so that models generated by SIMCA could account for as many variations within a fiber type as possible. A total of 758 textile samples was cataloged and their diffuse NIR reflectance spectra collected for training and testing. Table 1 shows the textile library used for this study with the number of samples in each fiber category.
3.2. Data Acquisition and Analysis
NIR analysis was carried out using a dual-channel spectrometer assembled and tested in our laboratory [19]. To acquire diffuse NIR reflectance spectra, the sample beam was directed into an eight-inch diameter barium sul-fate (BaSO4) coated integrating sphere (Model 70451, Oriel) that had a lead sulfide (PbS) detector (Model 7202,
Oriel) located in the detector port and mounted 45˚ from the sample window. The integrating sphere was equipped with a baffle and a light trap to reduce specular reflection.
Table 1.Textile library.
Fabric type No. of samples
Acetate 61
Cotton 274
Polyester 109
Rayon 77
Silk 45
Wool 192
region selected for these studies ranged from 1334 to 1906 nm. Wavelengths outside this region produced sig-nals with significantly reduced signal-to-noise ratios.
Diffuse NIR reflectance scans were recorded with a sampling interval of 2.0 nm, and measurements were re-ported as log10
( )
1R , where R is equal to the diffuse reflectance signal. Data were written into ASCII tables by the LabView™ software (version 5.1, National Instruments, Austin, TX) that controls the instrument and con-verted to Microsoft® Excel spreadsheets as required for chemometric analysis. The spectral data, contained in the Excel spreadsheets, were imported into the Unscrambler© software package (versions 9.1, 9.6, and 9.7, Ca-mo, Inc., Woodbridge, NJ). The data were then transposed to list the wavelengths as the x-variables and the ref-lectance as the y-variables.Except where stated otherwise, raw spectral data was subjected to Savitzky-Golay smoothing [20], using a zero-degree polynomial and 11 averaging points, 5 on each side of a given wavelength. The multivariate prin-cipal component analysis for each textile category was performed on mean-centered data at the 95% confidence level (p = 0.05 significance level). A mean-centered plot, calculated by the Unscrambler© statistical package, was obtained by first averaging the individual spectra on a wavelength-by-wavelength basis (i.e., adding the
( )
10
log 1R values of each spectrum on a wavelength-by-wavelength basis and dividing each sum by the num-ber of samples). This average spectrum was then subtracted from each individual spectrum on a wavelength- by-wavelength basis to give mean-centered spectra.
4. Results and Discussion
Diffuse reflectance NIR spectra were obtained on 758 textile samples representing acetate, cotton, polyester, rayon, silk, and wool, using a Savitzky-Golay algorithm for smoothing. As an example, Figure 1 shows the smoothed diffuse NIR reflectance spectra for 274 cotton textiles, plotted as log10
( )
1R over the wavelength range 1334 - 1906 nm.4.1. PCA Modeling
Individual principal component analyses were conducted for each fabric type using the smoothed reflectance spectra collected for each group.
1300 1400 1500 1600 1700 1800 1900
Wavelength (nm) 0
0.2 0.4 0.6 0.8 1.0 1.2 1.4
log
(1
[image:5.595.83.528.81.351.2]/R)
Figure 1.Savitzky-Golay smoothed diffuse near-infrared reflectance spectra of 274 cotton textiles plotted as log10
( )
1R over the wavelength range 1334 - 1906 nm.0
Loadi
ngs
X
-V
ar
ianc
e
0.00 0.05 0.10 0.15 PC 0 PC 2 PC 4 PC 6
Number of PCs Wavelength (nm)
Leverage 0.0001
0.0002 0.0003
0.00 0.005 0.010 0.015
1300 1400 1500 1600 1700 1800 1900
(d)
Residual variance versus
number of PCs Residual X-variance
versus Leverage (b)
(a)
(c)
-0.1 0.0 0.1 0.2
Loadings versus wavelength Scores plot
-0.5 0.0 0.5 1.0 1.5
PC2 PC1
9 6 3 0 -3 -0.2 0.0 0.2 0.4
PC3
Res
idual
X
-v
ar
ianc
e
Figure 2. Summary of the principal component analysis of Savitzky-Golay smoothed diffuse near-infrared spectra plotted as
( )
10
log 1R of 274 cotton samples over the wavelength range 1334 - 1906 nm: (a) Three-dimensional scores plot resulting
[image:5.595.92.536.400.671.2]Using cross-validation, the Unscrambler© program automatically defaults to a suggested number of principal components that the program deems necessary to explain the variation in the spectral data, which in this case was two (Figure 2(d)). But, close examination of Figure 2(d) shows that the residual variance continues to drop slowly beyond the second principal component. Several different numbers of PCs were tried, and models were computed using both the default number and values up to six [21]-[24]. For cotton as well as the other fabric types studied, six PCs did not appear to over-determine the data and were used in the SIMCA classification studies.
4.2. SIMCA Classification
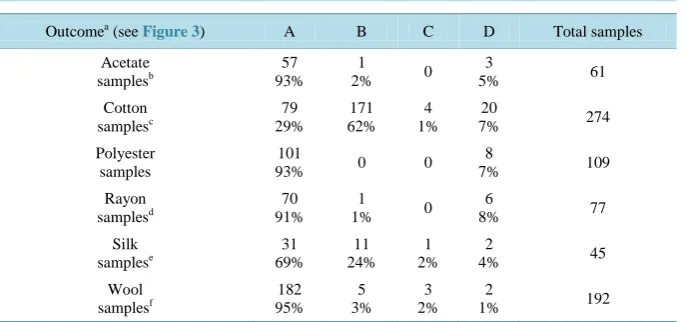
SIMCA classification was performed on the fiber classes of acetate, cotton, polyester, rayon, silk, and wool using the principal component models for each class of fabric. The methodology involved removing a randomly se-lected number of samples (validation samples in Table 2) in the full set for each textile category (Table 1) and classifying those with a model built from all remaining samples in the same population (calibration samples in Table 2). Validation was performed ten times with a new set of validation samples for each of the six categories, and the percentage of correct classifications (positive result) was calculated at the 95% confidence level. The results are shown inTable 2 and indicate that SIMCA correctly identified the textiles in 89% - 98% of the cases. SIMCA was also used to check for misclassifications. Each one of the 758 textile samples was individually tested for membership in each of the six textile categories. Tests were performed using PCA models constructed from all members of each textile group (total samples in Table 3). Four results were possible (Figure 3): (A) correctly classified in only one group; (B) classified in more than one group, with one group correct; (C) classi-fied in one or more groups, with no group correct; and (D) not classiclassi-fied in any group. The best outcome is A. Outcome B is still a positive result, but the sample would require further testing. The results (A, B, C or D) are indicated in Table 3 for each textile. The percentage is relative to the total number of samples in the textile class.
[image:6.595.145.483.411.485.2]As shown in Table 3, acetate, polyester, rayon and wool models performed well, with few misclassifications as other fiber types (columns B and C). Of these four, wool had the most misclassifications with a 5% chance of
Table 2. SIMCA validation results.
Acetate Cotton Polyester Rayon Silk Wool
No. of calibration samples 51 254 89 67 40 172
No. of validation samples 10 20 20 10 5 20
% Correcta 91 89 95 92 96 98
a
[image:6.595.144.488.527.688.2]Average of ten, separate validation sets randomly selected and analyzed in each category using the indicated number of samples and 6 principal components.
Table 3.SIMCA classification outcomes.
Outcomea (see Figure 3) A B C D Total samples
Acetate samplesb
57 93%
1
2% 0
3
5% 61
Cotton samplesc 79 29% 171 62% 4 1% 20
7% 274
Polyester samples
101
93% 0 0
8
7% 109
Rayon samplesd
70 91%
1
1% 0
6
8% 77
Silk samplese 31 69% 11 24% 1 2% 2
4% 45
Wool samplesf 182 95% 5 3% 3 2% 2
1% 192
a
Six principal components. bAlso classified as polyester, column B. cAlso classified as rayon, column B;
Figure 3. Possible SIMCA outcomes.
being identified as both silk and wool (3%) or just silk (2%). Both wool and silk are protein based and differ primarily in the relative amounts of amino acids present and the type of hydrogen-bonding holding the protein chains together, making classification difficult.
Cotton samples were correctly classified as cotton in the large majority of cases, but were frequently marked as both rayon and cotton (62%). This result can be anticipated from the similarity in the chemical structures of the two fibers (cellulosic). Silk samples were also correctly classified as silk in the large majority of cases, but were frequently marked as both silk and rayon (24%). The diffuse NIR reflectance spectra of both fibers are broad with few differentiating features. In cases where chemical structures and spectra are very similar, classifi-cation should be improved by adding more samples to the PCA models.
4.3. Identification of a Counterfeit Silk
Silk is an expensive luxury fabric, and cheaper look-alikes are sometimes substituted for the genuine article. The initial textile library contained one “silk” sample, labeled as Silk-120, that SIMCA flagged as belonging to the polyester category, but not to silk. A visual inspection of the log10
( )
1R spectrum for Silk-120, compared to representative spectra of polyesters also suggested that the sample was counterfeit. A burn test confirmed that the fabric was polyester.5. Conclusions
A large sample library, such as the one used in this study, is critical in establishing a representative population with as many variations as possible within a given textile type. Application of the method to areas where large numbers of textiles must be tested, such as the import/export business, should provide an opportunity to increase the sample library significantly. Existing PCA models can easily be expanded to include additional fabric sam-ples in any category, making the model more robust, while entirely new PCA models can easily be added, as necessary, to train the procedure to recognize new textiles that will almost certainly be introduced into the mar-ketplace. Thus, actual application of the method to commercially available fibers should expand and improve identification rates over those reported in this study.
Acknowledgements
We thank CAMO Inc. for the donation of chemometric software.
References
[1] Kadolph, S.J. (2007) Textiles. 10th Edition, Prentice Hall, Upper Saddle River, 34-36.
[2] King, R.R. (1985) Textile Identification, Conservation and Preservation. Noyes Publications, Parkridge, 5-121. [3] Howell, H.E. and Davis, J.R. (1991) Textile Chemist and Colorist, 23, 69.
[4] Jasper, W.J. and Kovacs, E.T. (1994) Textile Research Journal, 64, 444. http://dx.doi.org/10.1177/004051759406400803
[5] Kuo, C.-F.J., Shih, C.-Y. and Lee, J.-Y. (2004) Textile Research Journal, 74, 107. http://dx.doi.org/10.1177/004051750407400204
[6] Jeon, B.S., Bae, J.H. and Suh, M.W. (2003) Textile Research Journal, 73, 645. http://dx.doi.org/10.1177/004051750307300714
[7] Chen, C.-S., Brown, C.W. and Bide, M.J. (1997) Journal of the Society of Dyers and Colourists, 113, 51. http://dx.doi.org/10.1111/j.1478-4408.1997.tb01867.x
[8] Lien, H.-C. and Lee, S. (2002) Textile Research Journal, 72, 320. http://dx.doi.org/10.1177/004051750207200408
[9] Nitta, M., Yoshimura, N. and Takayanagi, M. (2004) Bunko Kenkyu, 4, 249. http://dx.doi.org/10.5111/bunkou.53.249
[10] Varmuza, K. and Werther, W. (1996) Journal of Chemical Information and Computer Science, 36, 323. http://dx.doi.org/10.1021/ci9501406
[11] Wold, S. (1989) Computer Applications in Chemical Research and Education. In: Brandt, J. and Ugi, I.K., Eds., Huthig, Heidelberg, 101-128.
[12] Mark, H.L. and Tunnel, D. (1985) Analytical Chemistry, 57, 1449. http://dx.doi.org/10.1021/ac00284a061
[13] Howell, H.E. and Davis, J.R. (1991) Textile Chemist and Colorist, 23, 69.
[14] Kowalski, B.R. and Bender, C.F. (1972) Journal of the American Chemical Society, 94, 5632. http://dx.doi.org/10.1021/ja00771a016
[15] Jasper, W.J. and Kovacs, E.T. (1994) Textile Research Journal, 64, 444. http://dx.doi.org/10.1177/004051759406400803
[16] Shanmugam, N. and Doke, S.S. (2006) Indian Journal of Fibre and Textile Research, 31, 583.
[17] Vangheluwe, L. (1997) Textile Research Journal, 67, 809.
[18] Otto, M. (1999) Chemometrics. Wiley-VCH, Weinheim, 169.
[19] Soyemi, O.O., Rabbe, D., Busch, M.A. and Busch, K.W. (2000) Spectroscopy, 54, 1092.
[20] Savitzky, A. and Golay, M.J.E. (1964) Analytical Chemistry, 36, 1627. http://dx.doi.org/10.1021/ac60214a047
[21] Ghosh, S. and Rodgers, J. (2008) NIR Analysis of Textiles. In: Handbook of Near-Infrared Analysis, 3rd Edition, Practical Spectroscopy Series, Vol. 35, CRC Press, Boca Raton, 485-527.
[22] Esbensen, K.H. (2004) Multivariate Data Analysis: An Introduction to Multivariate Data Analysis and Experimental Design. 5th Edition, Camo Process AS, Woodbridge, 163-168.
[23] (1984) Encyclopedia of Textiles, Fibers, and Nonwoven Fabrics. In: Grayson, M., Ed., Vol. 1, John Wiley & Sons, New York.