© 2018, IRJET | Impact Factor value: 6.171 | ISO 9001:2008 Certified Journal | Page 3818
A REVIEW OF DIFFERENT CLASSIFICATION TECHNIQUES IN MACHINE
LEARNING USING WEKA FOR PLANT DISEASE DETECTION
R.Ramya
1, Dr.P.Kumar
2, D.Mugilan
3, M.Babykala
4Assistant Professor
1, 3,4, Department of ECE, K.S.Rangasamy College of Technology
Professor
2, Department of ECE, K.S.Rangasamy College of Technology, Tiruchengode
Tamilnadu, India
---***---
-ABSTRACT: Disease detection from the images of the plant leaf, fruit is one of the interesting research areas in agriculture field. This field needs a reliable prediction methodology to detect factors influencing disease. Machine learning is the process of analyzing data from different aspects and summarizing it into valuable information. It allows users to analyze data from different dimensions, categorize and the relationships are identified. WEKA is a data analysis tool for machine learning classification. Machine learning classification is a vital technique with more applications in various fields. It is used to classify each item in a set of data into one of predefined set of classes. In this paper present a different image processing and machine-learning techniques used for the identification of plant diseases based on images of disease infected plants. The proposed work focus on machine learning techniques with Naïve Bayes, Decision tree, simple K-Means, Multilayer Perceptron, SVM, Random forest algorithm for predicting disease using WEKA tool. This is including size of image dataset, preprocessing, segmentation techniques, types of classifiers.
KEYWORDS: Machine learning, Plant Disease, Image Processing, Decision tree, Zero R, Naïve Bayes, SVM
I. INTRODUCTION
Indian economy is dependent on agriculture, now a days the productivity of plants, crops is normally affected by the diseases. In plants, most of the leaves, fruits are affected by fungi, bacteria, and viruses. It is very difficult to identify the infected areas in a short period. To overcome this difficulty a major technical work is to be initiated to complete the work faster and accurate. The image processing is taking place about this major problem by the help of machine learning using WEKA tool. It is needed to use novel techniques to increase the productivity of agriculture products and also financial income of farmers. Machine learning technique is a process of discovering pattern of data. The patterns are discovered must be meaningful in that they lead to some merits. The overall aim of the machine learning process is to extract
information from a data set and transform it into a useful data in order to aid user decision making [1]. It is used in many applications like banking, agricultural and Health bio-informatics.
Analysis of Different Classification Techniques Using machine learning for a challenging task in agricultural research area. It is very tough to find out the best classification algorithms for comparing in different algorithms in various datasets. Our dissertation concerns with which algorithm, is capable to diagnose plant disease data accurately as well as quickly. For this purpose to perform a better approach, this problem of agricultural plant data comments into two classes: Data Collection, Classification algorithm.
The Remaining paper is containing in the following ways as: section II presents work of various research work carried out on diseases detection of vegetables, plant and fruits and other researchers in classification. Section III, IV mentions the various classifiers, WEKA tool which is used. Section VII discusses the result, finally the section IX conclusion.
II. REVIEW OF LITERATURE
Indian country has a lot of crops and plants; it’s varied by their characters and behaviours. These things mostly specify their parts. So all those parts are having the defects by different diseases which will be affecting in large numbers. For all these reasons insects is the major problem to spoil everything under the plants. The diseases in the plants are caused by two reasons; the first one is by Biotic and second one is by Abiotic. The Biotic disease will affect the plants leaf and its stems. And Abiotic disease will occur due to soil compaction, wind and unhealthy soil and root [2].
© 2018, IRJET | Impact Factor value: 6.171 | ISO 9001:2008 Certified Journal | Page 3819 farming areas. Automatic plant leaf disease detection is
very important in monitoring large fields. A machine based detection of plant leaf disease will give ideas to control them on early stage. Here they proposed an automatic detection of plant leaf disease using ANNs and k-means algorithms [6].
The two important categories having in machine learning techniques it must be the speed and accuracy. This technology to be needed for an automatic plant disease detection using image processing technology. It will give an alert to the farmers in a good time before the disease will be spread.
In agriculture field image processing has certain impact threshold value with help of random forest classifier fruit diseases are detected by K-Mean cluster technique and features are extracted by color and texture for identification of the presence of diseases by observing the visual symptoms seen on the leaves of the plant has been done with the use of soft computing approach. It has been reviewed and summarized techniques of the image processing and machine learning that have been used in disease identification.
III CLASSIFICATION METHODS
Different types of classifiers are considered in this review paper: Decision Tree, Zero R, and Naïve Bayes, Random forest, SVM and K means
a) DECISION TREE
A Decision tree is same as that of the tree structure having different nodes, such as root node, intermediate nodes and leaf node. It is a f r e qu e n t l y used techni qu e in da ta m i n i ng to classify large amount of data and extract dataset that has similar patterns. Each node in the tree contains a decision and that decision leads to our result as name is decision tree. Decision tree spilt the input space of a data set into mutually exclusive areas, where each area having a label, a value to describe or elaborate its data points. Dividing criterion is used in decision tree to calculate which attribute is the best to split that portion tree of the training data that reaches a particular node.
b) ZERO R ALGORITHM
Zero R is the simplest classification method which relies on the target and ignores all predictors. It is classifier simply predicts the majority category. Although there is no predictability power in Zero R, it is helpful for measuring a baseline performance as a benchmark for other
classification methods.
c) MULTILAYER PERCEPTRON
The Multilayer Perceptron (MLP) which is also called as Feed Forward Artificial Neural Network. It consists of appropriate nodes by directed graphs; here every node is connected to a node. The node is a neuron with nonlinear functions. To training a network which uses the back propagation algorithms also it is not linearly separable. A weighted inputs will map the each neurons output. Any number of layers can be reduced to a two-layer input and output model.
d) NAIVE BAYES
Naive Bayes implements the probabilistic Naïve Bayes classifier. Naïve Bayes Simple uses the normal distribution to model numeric attributes. This can use kernel density estimators, which improve performance if the normality assumption if grossly correct; it can also handle numeric attributes using supervised discretization. Naïve Bayes updateable is an incremental version that processes one request at a time. It can use a kernel estimator but not discretization.
e) RANDOM FOREST
Random Forests (RF) is one of the finest machine learning classification and regression method. It is suitable for classification of large number of dataset. It is having a group of the tree-structured classifiers [1]. The tree is depends on the random values sampled and the forest. The input is given at top of the tree then down the tree. The data is sampled is randomly, but it is having reduced sets. The sample class is found by random forests trees, which are of a random number. The randomizing variable found how the cuts are found regularly. At the time of construction of the tree by selecting the node and the coordinate to divide and the position of the divided.
f) SVM
© 2018, IRJET | Impact Factor value: 6.171 | ISO 9001:2008 Certified Journal | Page 3820 plane in dividing two classes. The boundary is maximized
between the hyper plane and the two classes.
g) SIMPLE K MEANS
Simple K means algorithm is a vector quantization; it is popular for a cluster analysis in the machine learning process. A partition of n observation with k clusters as a prototype. It is difficult to find the problems computationally but there is an efficient algorithm to build in a local optimum. They use cluster centers for model data to compare clusters of spatial extent.
A k-nearest neighbor has loose relationship in popular machine learning techniques for classification which is totally confused with k-means because of the k in the name. The nearest neighbor classifier for a cluster center may be the person can be applying in existing clusters for a new data.
IV WEKA – AN OVERVIEW
In this paper the study of a literature the major defects of a plant disease will be rectified by the different machine learning techniques. So for the studies have been concerned here the technology which is introducing is WEKA tool. Algorithms can be applied either directly or to a dataset called from own java code. WEKA implements algorithms for data preprocessing, classification, regression, clustering and association rules; it also includes visualization tools [5]. An understanding of algorithms is combined with detailed knowledge of the datasets. Data sets in WEKA are validation, training and test set.
Learning methods in WEKA are called classifiers which contain tunable parameters that can be accessed through a property object editor. Portability, since it is fully implemented in the Java programming language and thus runs on almost any new computing platform. It is to improving the quality of data, the continuous attributes in discretely requiring data mining. It is for the finite set of intervals to generate distinct values. A comprehensive collection of data preprocessing and modeling techniques, ease of use due to its graphical user interfaces.
V BLOCK DIAGRAM
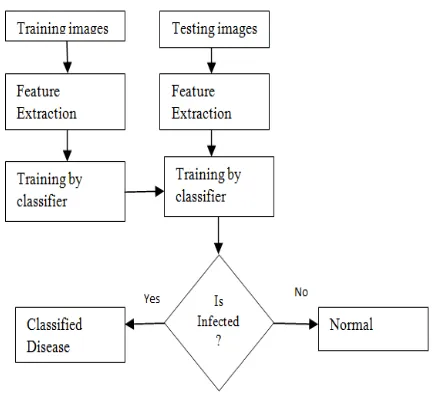
[image:3.612.348.529.109.191.2]In the section will discuss the overall description of the system in fig.1. The main aim of this system is to detect the diseases on all types of plants, fruits and increase the quality and quantity of agricultural products.
Fig.1: Block diagram of disease detection system
The system consist of input image and its resizing for high computation, image processing for improve the quality of image, segmentation to extract the useful object by omitting unwanted background.
Fig.2: Flowchart of disease detection system
Feature extraction to find out the meaning of testing sample and lastly classification of given testing input according to the disease based on classifiers. The dataset for evaluating this system is containing all type of images either captured or downloaded from website.
VI PARAMETERS EVALUATIONS
i) Mean Absolute Error:The mean absolute error (MAE) is a quantity used to measure predictions of the absolute errors. MAE is given by
MAE = SAE / N
[image:3.612.345.562.283.483.2]© 2018, IRJET | Impact Factor value: 6.171 | ISO 9001:2008 Certified Journal | Page 3821 N= the number of non-missing data points
ii)Root Mean Squared Error: It is the square root of the mean of the squares of the values. It squares the errors before they are averaged and RMSE gives a relatively high weight to large errors.
iii) TP-Rate: It is known as true positive rate and is calculated as
TP-Rate= TP/ (TP+FN)
iii) TN-Rate: It is known as true negative arte and is calculated as
TN-Rate= TN/ (TN+FP)
iv) FP-Rate: It is known as false positive rate and is calculated as
FP-Rate= FP/ (FP+TN)
v) FN-Rate: It is known as false negative rate and is calculated as
FN-Rate= 1-TP-Rate
vi) PRECISION = TP/ (TP+FP)
vii) RECALL= TP/ (TP+FN)
viii) ROC: Receiver Operating Characteristic Curve is a graphical plot equating the tp-rates and the fp- rates of a classifier as the refinement threshold of the classifier is different [4].
VII RESULTS AND DISCUSSION
In the phase for finding the best order of defects. If N images are used per class for training then other images are used for testing. The accuracy of the proposed approach is defined as,
Total accuracy (%) = (Number of images correctly
classified / Total number of images used for testing) * 100
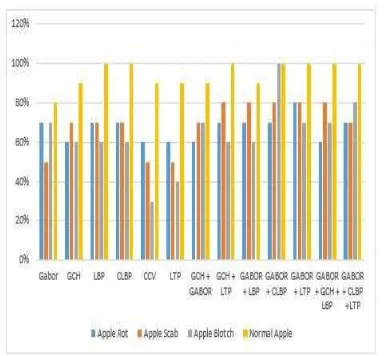
[image:4.612.359.552.91.269.2]Accuracy of Random Forest Classifier to recognize the apple diseases based on features by taking 70 images in training dataset and 10 images in testing dataset per class [1].
Fig.3: Comparison of features accuracy based on random forest classifier
WEKA is a tool and using GUI which is directly accessing the dataset. It is mostly performing for classifications, clustering and with five classifiers are examined namely tree based J48, rules based decision table and PART, Bayesian based naïve bayes. The performance of the classifier is analyzed in terms of correctly classified instances, incorrectly classified instances, Kappa statistic, mean absolute error, root mean squared error, relative absolute error, and root relative squared error.
© 2018, IRJET | Impact Factor value: 6.171 | ISO 9001:2008 Certified Journal | Page 3822
VIII CONCLUSION
The world is coming more towards technology dependent era. In this paper, a review of the different machine learning approaches, which will be used for identifying and classifying on the disease on agricultural such as plants, fruits. Most of the techniques are based on image processing and some of them are based on data mining approach. The machine learning methods bring this aspect to reality, by observing the database and supporting the botanists in the detection of diseases where a lot of precision is required. Some of the machine learning classifiers namely as SVM, Decision tree and Simple K means algorithms and others are used based on WEKA for classification of plant diseases. This can be better by increasing the database and features fusion give better accuracy than single feature. The results are analysed using various accuracy measures l i k e T P r a t e , F P r a t e , P r e c i s i o n . MAE, RMSE error is less in case of training data, the objective which is to evaluate and investigate c l a s s i f i c a t i o n algorithm based on WEKA. However, the results obtained from real time images are very encouraging. These results suggested that among the machine learning algorithm tested, Naïve Bayes classifier has the potential to significantly improve the conventional classification methods for use in medical or in other, bioinformatics field. A SVM training classifier performs best average accuracy.
IX REFERENCES
1. Bhavini J. Samajpati and Sheshang D. Degadwala,” Hybrid Approach for Apple Fruit Diseases Detection and Classification Using Random Forest Classifier” International Conference on Communication and Signal Processing, April 6-8, 2016, India.
2. R. Ravikumar, Dr. V. Arulmozhi," Prediction of Leaf Diseases by using Machine Learning Techniques-A New Approach to Applied Informatics” International Journal on Recent and Innovation Trends in Computing and Communication Volume: 5 Issue: 6 , ISSN: 2321-8169 1154 – 1158.
3. Shivangi Gupta, Neeta Verma,” Comparative Analysis of classification Algorithms using WEKA tool” International Journal of Scientific & Engineering Research, Volume 7, Issue 8, August-2016, ISSN 2229-5518.
4. Rausheen Bal, Sangeeta Sharma.” Review on Meta Classification Algorithms using WEKA” International Journal of Computer Trends and Technology (IJCTT) –
Volume 35 Number 1 - May 2016.
5. Meenakshi, Geetika,”Survey on Classification Methods using WEKA” International Journal of Computer Applications (0975 – 8887), Volume 86 – No 18, January 2014.
6. Mr. N.S. Bharti, Prof. R.M. Mulajkar,” Detection and Classification of Plant Diseases”, International Research Journal of Engineering and Technology (IRJET) e-ISSN: 2395 -0056 Volume: 02 Issue: 02 | May-2015 www.irjet.net p-ISSN: 2395-0072.