© 2017, IRJET | Impact Factor value: 5.181 | ISO 9001:2008 Certified Journal
| Page 653
IMAGE BASED DETECTION OF DEFECTED VEGITABLES
Maduguri Sudhir
1, Dade Sai Kumari
2, Eluri Venkata Narayana
31,3
Asst.Prof., ECE Department, KITS Guntur, AP, INDIA
2Ph.D Scholar Osmania University, Hyderabad, TS, INDIA
---***---ABSTRACT
Here we develop an automated system to detect and assess the infection in vegetable using image. The specific objectives were to detect the disease and to evaluate the disease using image. With this technique diseased/infested and healthy vegetable images were collected like tomato brinjal. The aim of this paper to study the diseases in vegetable crops through Radon transforms technique by using diseased images. The specific objectives were used to detect and evaluate the diseases based on the images. In this study we have identified disease intensity, damaged percentage of the plant parts in Lycopersiconesculentum(tomato), Solanum tuberosum L. (Potato).Which are effected by a fungal disease “early blight” .The causative agent is Alternariaalternata. The symptoms were characterized by yellowing of leaves, stems and fruits at maturity they become brown and eventually drop from the plant.. This paper gives the essence data about asphalt defected location, assessment, order, pressure handle. Since the defected area have particular straight elements in the space area. It accepts the way that the pixels in defected area are brighter than their surroundings. The captured image is wavelet transformed asses the infected area.So detection of diseases is achieved by the two dimensional wavelet transform. Then the radon transform evaluate the defected area in the vegetable. Hence evaluation is achieved by the radon transform.
Key words: Wavelet transforms, Radon Transform
1. INTRODUCTION
Most of the crops (Potato, Tomato) have been ruined due to the early blight diseases. This disease caused by a fungal organism Alternariaalternata. The symptoms were mainly appeared on the leaves, stems and fruits. A small yellow colour lessons form on the parts they enlarge finally they become brown and drop off from the plant when they were matured. This disease decreases the productivity and quality of the vegetables before and after harvesting.
The main reason and motivation for this paper is presented in the introduction. There is more labor involvement
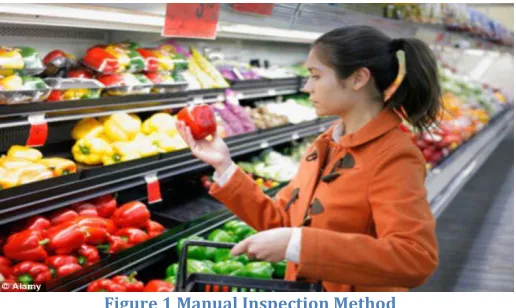
[image:1.612.325.583.255.409.2]for the farmers, mall owners and scientists to identify the defected vegetables. The ancient human visual method and physical inspection methods are very expensive in time and money.
Figure 1 Manual Inspection Method
There is a huge number of man power need to the farmers, vegetable malls to identify, separate the defected vegetables. The ancient human visual and physical inspection methods were very expensive and also time and money taking methods. In this methods sometimes workers may not pay attention to identify the defected vegetables and they pack them along with the healthy vegetables this leads to the spoiling of major vegetables due to the organisms present in the defected area. To avoid this loss of vegetables an automated system was invented, it conducted so many experiments to identify the infected vegetables better than the other methods.
© 2017, IRJET | Impact Factor value: 5.181 | ISO 9001:2008 Certified Journal
| Page 654
Figure 2 Defected vegetable
Our planned method, the infected area is assessed on exterior of vegetables and the expect defected section are Captured with a camera. The photographed Image is progressed by hand using software tool to detect the defected sector. Even though the entire process consists a camera which captures the image of vegetable and it is progressed. An automatic defect finding /categorization method designed by the algorithm , with the help of wavelet transform and Radon transform.
2. PROPOSED METHOD
This fragment briefly tells the projected algorithm of the paper. This algorithm that can automatically progress the each fault vegetable image. The major task is to find and assess the disease .Our algorithm consists of three stages
(1) Capturing of Defected Vegetable Image (2) Detection using Wavelet Transform (3) Evaluation Using Radon transforms
The algorithm consist Defected vegetable Image
↓
Detection of Infected area using Wavelet Transform
↓
Evaluation Using Radon transform
2.1 Wavelet Transform
Wave let transform akin to the Fourier transform. The only main variation is Fourier transform decomposes the signal into cosines and sines, that is the functions restricted in Fourier space, the wavelet transform’s is generalized in both Fourier space and real space. The expression of wave let transform is
( ) ∫ ( ) ( )( )( )
* function ψ ‘s complex conjugate
A wavelet is a the small part of waveform. The average value of all wavelets is zero. The wavelets has start point and end point. But Sinusoids extends from minus infinity to plus infinity. All Wavelets not similar , non symmetrical and not regular.
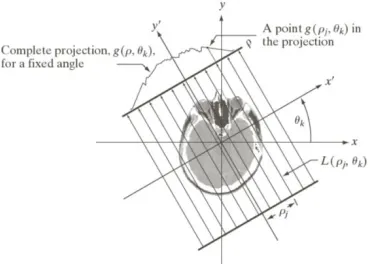
2.2 Radon transform
The radon transform is used to evaluate and classify the defect . But in our method the classification is not necessary. We use this transform for the evaluation purpose. The function f is integral transformed with a plane of the function Rf is called Radon Transform ,defined on the (two-dimensional) space of lines in the plane, whose value at a particular line is equal to the line integral of the function over that line. Radon transform uses a array of projection with different angles of the image f(x, y). The final result projection will be the addition of the intensities of the pixels in all direction, i.e. a line integral. The result is a new image.
[image:2.612.357.542.534.666.2]© 2017, IRJET | Impact Factor value: 5.181 | ISO 9001:2008 Certified Journal
| Page 655
Continuous Space coordinates( ) ∫ ∫ ( ) ( )
Discrete space coordinates
( ) ∑ ∑ ( ) ( )
2.3 Detection
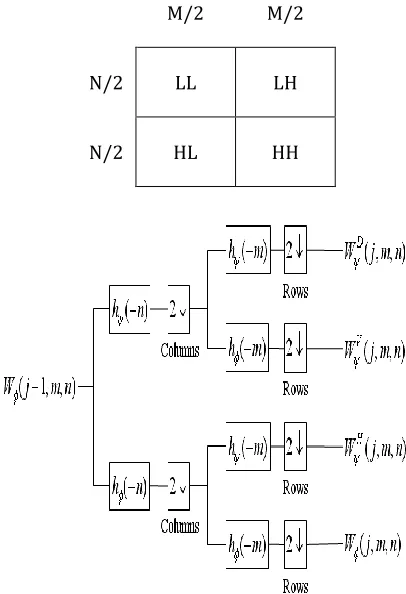
The original image is a color image . This color image is converted into gray scale image usingb RGB to Gray syntax “rgb2gray(image)”. This converted Gray image processed with the 2D wavelet Transform with the command “dwt2(image)” . Then four Sub images formed named LL, HL, LH, and HH.
a) LL: Row and column both are Low pass filtered
b) LH: Row Low pass Filtered and Column High Pass filtered.
c) HL: Row High Pass filtered and column Low Pass filtered d) HH : Both Row and column are high pass filtered This decomposition can be represented as
M/2 M/2
N/2 LL LH
[image:3.612.59.262.361.658.2]N/2 HL HH
Figure 4 Wavelet transform structure
Image
A1 H1
V1 D1
A3 H3 H2
H1
A2 H2
H1 V3 D3
V2 D2 V2 D2
V1 D1 V1 D1
The fault region identified by the wavelet transforms, in that the noise is represented by the low values and distress is represented by the high values of the wavelet. To reconstruct the approximation matrix Next pseudo color matrix scaling is performed. Then a new image is formed with the detected defection.
2.4 Evaluation:
The final task is to evaluate defected area using the Radon transform. This transform construct the association linking the peaks and cracks. This uses a command “radon(image, angle)”
Wavelet coefficients are integrated in all possible directions (angles), and then it highlights the features of wavelet modules. Then a image is formed with peaks. The intensity of the peaks represent the infection of Vegetable.
3. TESTING AND RESULTS
© 2017, IRJET | Impact Factor value: 5.181 | ISO 9001:2008 Certified Journal
| Page 656
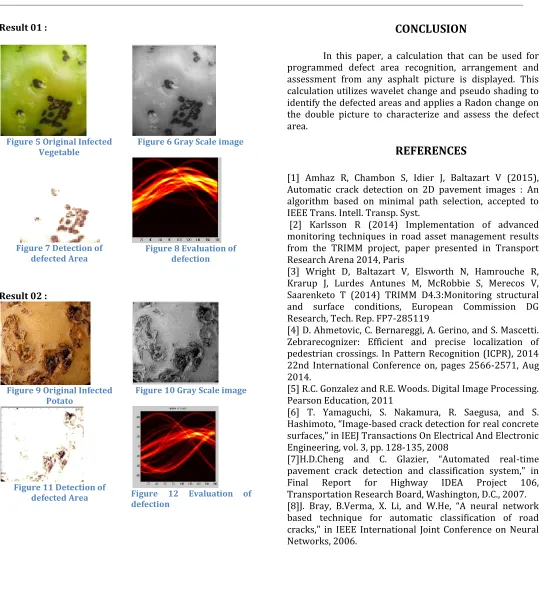
Result 01 :Figure 5 Original Infected
Vegetable Figure 6 Gray Scale image
Figure 7 Detection of
defected Area Figure 8 Evaluation of defection
Result 02 :
Figure 9 Original Infected
Potato Figure 10 Gray Scale image
Figure 11 Detection of
defected Area Figure 12 Evaluation of defection
CONCLUSION
In this paper, a calculation that can be used for programmed defect area recognition, arrangement and assessment from any asphalt picture is displayed. This calculation utilizes wavelet change and pseudo shading to identify the defected areas and applies a Radon change on the double picture to characterize and assess the defect area.
REFERENCES
[1] Amhaz R, Chambon S, Idier J, Baltazart V (2015), Automatic crack detection on 2D pavement images : An algorithm based on minimal path selection, accepted to IEEE Trans. Intell. Transp. Syst.
[2] Karlsson R (2014) Implementation of advanced monitoring techniques in road asset management results from the TRIMM project, paper presented in Transport Research Arena 2014, Paris
[3] Wright D, Baltazart V, Elsworth N, Hamrouche R, Krarup J, Lurdes Antunes M, McRobbie S, Merecos V, Saarenketo T (2014) TRIMM D4.3:Monitoring structural and surface conditions, European Commission DG Research, Tech. Rep. FP7-285119
[4] D. Ahmetovic, C. Bernareggi, A. Gerino, and S. Mascetti. Zebrarecognizer: Efficient and precise localization of pedestrian crossings. In Pattern Recognition (ICPR), 2014 22nd International Conference on, pages 2566-2571, Aug 2014.
[5] R.C. Gonzalez and R.E. Woods. Digital Image Processing. Pearson Education, 2011
[6] T. Yamaguchi, S. Nakamura, R. Saegusa, and S. Hashimoto, “Image-based crack detection for real concrete surfaces," in IEEJ Transactions On Electrical And Electronic Engineering, vol. 3, pp. 128-135, 2008
[image:4.612.37.589.78.673.2]© 2017, IRJET | Impact Factor value: 5.181 | ISO 9001:2008 Certified Journal
| Page 657
Authors:
Mr. Maduguri Sudhir, (M.Tech. with specialization in Digital Electrinics and Communication System ), He have special interest on Digital Image Processing. He has 5 years of experience in academics. Presently he is working as Assistant Professor in KITS Engineering College , Guntur, AP
Ms. Dade Sai Kumari, is a research Scholar of Studies on biochemical changes and fungal succession on horse gram seeds during storage condition in Osmania University, Hyderabad Telangana. She is very interested in research on Plants and its diseases.