© 2018, IRJET | Impact Factor value: 6.171 | ISO 9001:2008 Certified Journal | Page 1476
Transient Stability Studying of Power System with Synchronous
Generators Equipped with AVR and GOV, Using Neplan Software
Esmeraldo Emini
Electrical Engineer, Polytechnic University, Tirana, Albania
---***---Abstract -
Transient stability of a 9 buses power system, have been studied in this paper. Generators of the scheme are equipped with AVR and GOV. Using Neplan software, different simulation have been made for different causes of transients. As examples of those transients, are used unexpected loss of a generator, loss of large load, and cases of short circuits in buses and transmission lines. To better understand the role of AVR and GOV in power system stability, the scheme has been firstly simulated for generators without regulators. Then the same simulations are made in the scheme after generators are equipped with AVR and GOV. Through comparing the results taken from simulations, we can easily analyze the impact of the regulators in power system stabilityKey Words
:
Power system, Transient Stability, AVR, GOV, Neplan Software
1. INTRODUCTION
Stability of power system is the ability of the system to return under normal working conditions after being stressed by different transients. Otherwise, “stability” can be described as the natural tendency of the system to develop equal or greater forces than the disturbing forces, in order to continue working in a steady state. The system remains in synchronism if forces attempting to keep machines in synchronism are sufficient to defeat disturbing forces. [2]
Conversely, instability means conditions that lead generators to lose synchronism and power system failure.
The transient stability studies involve the determination of whether or not synchronism is maintained after the machine has been subjected to several disturbances. These disturbances might be sudden application of a large load, loss of generation, loss of large load, short circuits or phase loses in transmission. [8]
Power system stability is calculated during initial phases when generating and transmission units are still in development. Research is needed to determine the relay protection system, circuit breakers, optimal fault clearing time, voltage levels and transmission capacity between systems. [12]
If power system loses stability, the machines will no longer work at synchronous speed. That will lead to drastic fluctuations of voltage levels, currents and power. That condition can cause damages to the loads that are supplied with energy from the unstable system. Transient stability
studying requires a lot more attention because its impact on the system is greater than other conditions.
Studies in this area should be carried out to ensure that the system supports the transitional provisions that come as a result of a great transient. Short circuits are a kind of these transients. During the occurrence of a fault, the stability of the power system depends not only by the system itself, but also depends on the type and location of the fault, the clearing time, etc.
System response during transient conditions includes changes in rotor angle and it is influenced by the non- linear relationship between power and the rotor angle. Following the sudden transients in the power system, differences of rotor angles, rotor speeds and the power transmitted through transmission lines, change rapidly according to the type of fault.
For large transients, the change in rotor angle can be large enough to get the machine out of synchronism. Transient stability is a phenomenon that occurs within a second for generators placed near the fault location. The goal of transient stability studies is to assure if rotor angle remains in stable conditions after the fault clear. [1]
Fault clearing includes, switching off transmission lines, which weakness the system. Changes in transmission system, lead to changes in rotor angle. Lose of synchronism becomes obvious within a second fromthe fault occurring. Faults in overloaded transmission lines cause more instability than faults in slightly loaded lines. Also, three phase faults cause greater transients than one phase or two phase faults.
1.1 Factors that Influence Transient Stability
There are a lot of factors affecting the transient stability of a generator in a practical power system. Some of those factors are listed below:
1) The post-disturbance system reactance as seen
from the generator. The weaker the post-disturbance system, the lower the Pmax will be.
2) The duration of the fault-clearing time. The longer
© 2018, IRJET | Impact Factor value: 6.171 | ISO 9001:2008 Certified Journal | Page 1477
3) The inertia of the generator. With a high value of
generator inertia, the rate of change of angle will be slower, and as a result less energy will be gained during the fault.
4) The generator internal voltage (determined by
excitation system) and infinite bus voltage (system voltage). The lower these voltages, the lower the Pmax will be.
5) The generator internal reactance. If the reactance is
of low values, the peak power will be higher and the initial rotor angle will be lower.
6) The generator output during the fault. This is
depends on the faults location and type of the fault. [12]
1.2 Causes of Transients
Transients are disturbances that usually occur within a very short duration and the electrical circuit is quickly restored to original operation condition provided no damage has occurred due to the transient. An electrical transient is a cause-and-effect phenomenon. For transients to occur there must be a cause, some of the more common causes of transients:
1) Atmospheric phenomena including lightning, solar flares, or geomagnetic disturbances.
2) Switching loads on or off 3) Interruption of fault currents
4) Switching of power lines
5) Switching of capacitor banks 6) Short circuits [11]
2. VOLTAGE STABILITY IN POWER SYSTEM
Voltage stability refers power system ability to maintain steady voltages at its buses after being prone of a disturbance from a given initial operating condition. The voltage deviations have to maintain within predetermined ranges. Voltage stability depends on the balance between active and reactive power of load and generation in the entire power system and the ability to maintain this balance during normal and abnormal conditions.
The first factor contributing in voltage instability is the increase of reactive power requirements in the system beyond the sustainable capacity of the available reactive power resources when some of the generators hit their field or armature current time-overload capability limits.
Another contributor is high voltage drop occurring when active and reactive power flow through inductive reactance of the transmission network; this phenomenon limits the capability of the transmission network for power transfer and voltage support.
In general, the power system may experience uncontrolled over-voltage instability problem at some buses due to the capacitive behavior of the network and under excitation limiters that preventing generators and synchronous compensators from absorbing excess reactive power in the system. [7]
Reactive power is a more local quantity than active power since it cannot be transported as easily in power system where normally in transmission lines we have that X ≫ R. This explains why voltage problems often are local, and often only occur in part of the system. When the imbalances develop into instabilities these are called voltage instabilities or voltage collapses.
Low voltages arise at high load conditions in power system, while high voltages are closely associated with low load conditions. Depending on the time scale the voltage instabilities are classified as short-term, a couple of seconds, or long-term voltage instabilities.
3. FREQUENCY STABILITY IN POWER SYSTEMS
Frequency stability is the ability of a power system to maintain frequency in rated values following a severe system disturbance as a result of an imbalance between generation and load.
A typical fault causing frequency instability is the loss of generation, which results in an undesired and sudden unbalance between the generation and load. The controllers of systems generators alter the power delivered by the generators until a balance between power output and load consumption is re-established. [7]
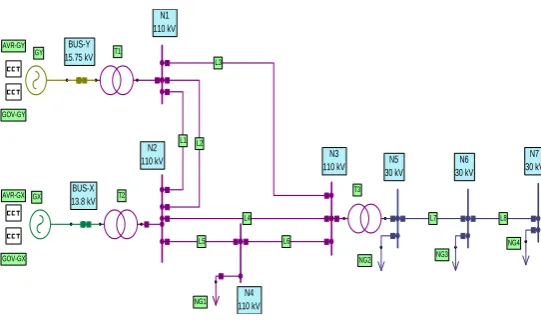
4. THE STUDIED SYSTEM AND ITS PARAMETERS
[image:2.595.308.579.502.664.2]GY GX T1 T2 N2 110 kV N1 110 kV L1 L2 N4 110 kV L5 NG1 N3 110 kV L4 L6 L3 T3 BUS-Y 15.75 kV BUS-X 13.8 kV N5 30 kV N6 30 kV N7 30 kV L7 L8 NG4 NG3 NG2 AVR-GY GOV-GY AVR-GX GOV-GX
Fig – 1: The scheme of the studied system in Neplan Sofware
© 2018, IRJET | Impact Factor value: 6.171 | ISO 9001:2008 Certified Journal | Page 1478
Table -1: Transmissions lines parameters
R (Ω/km) X (Ω/km) l (km)
L1 0.08 0.38 10
L2 0.08 0.38 10
L3 0.1 0.38 50
L4 0.12 0.42 40
L5 0.12 0.42 2
L6 0.12 0.42 39
L7 0.2 0.3 5
L8 0.2 0.3 4
Table -2: Transformers parameters
Sn
(MVA) Un1 (KV) Un2 (KV) Pk% Uk% X(1)/R(1) T1 200 15.75 110 0.25 11 43.99 T2 75 13.8 110 0.4667 12 25.69
[image:3.595.307.570.175.282.2]T3 32 110 30 0.46875 10 21.31
Table -3: Generators parameters
Sn
(MVA) Un (KV) LF type H(s) R P(MW) G1 200 15.75 SL 5.62 0.0013 G2 86 13.8 PV 2.7 0.0137
60
Table - 4: Loads parameters
Sn (MVA) Cos (phi) I(kA) Load 1 (NG1) 166.667 0.9 0.875 Load 2 (NG2) 15.789 0.95 0.304 Load 3 (NG3) 4.444 0.9 0.086 Load 4 (NG4) 5.906 0.847 0.114
5. AUTOMATIC REGULATORS BLOCK-DIAGRAMS
The generator excitation system using an automatic voltage regulator (AVR) keeps the terminal voltage magnitude of a synchronous generator to a defined standard level.
Furthermore, it plays an important role to control the reactive power and improve the stability of power system. AVR assists improving the steady-state stability of power systems.
In transient state, machine is affected by several impacts, mostly in a short time which causes several drops on the terminal voltage of machine. Using AVR has an important impact to remain voltage levels within standard levels during transients. [15]
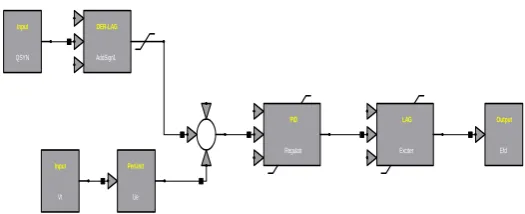
Fig – 2: Block-diagram for first generator (G1) AVR
Input QSYN DER-LAG AddSign1 S PerUnit Ue Input Vt PID Regulatr LAG Exciter Output Efd
Fig – 3: Block-diagram for second generator (G2) AVR
Input Vt PerUnit Ue S LAG control Sat ura tio n sat DE R-L AG fee dba ck S Integrator exciter Output Efd
Fig – 4: Block-diagram for first generator (G1) GOV
Input Rotor Fr S S o u r c e F n o m Constant Reg LAG Regulatr Limit1 P-lim R3 Turbine Output Torque
Fig –
5:
Block-diagram for second generator (G2) GOVInput Rotor Fr S S o u r c e F n o m Constant Reg LEAD-LAG FreqSign Limit1 Pmax Output Torque R2 Turbine
6. LOAD FLOW ANALYSIS OF POWER SYSTEM
[image:3.595.309.568.319.423.2]© 2018, IRJET | Impact Factor value: 6.171 | ISO 9001:2008 Certified Journal | Page 1479
Table - 5: Load flow analysis
As seen from the results above, voltage in the normal operation condition are within rated parameters. Line and transformer loses are in low rates, so they do not affect in undesirable voltage drops.
7. TRANSIENT STABILITY ANALYSIS
CASE 1
Synchronous generators are not equipped with AVR and GOV a)First case consists in studying system stability for several disturbances, while generators are not equipped with automatic regulators. Different simulations are made in the scheme starting from lose of generator GX in time t=0.3s
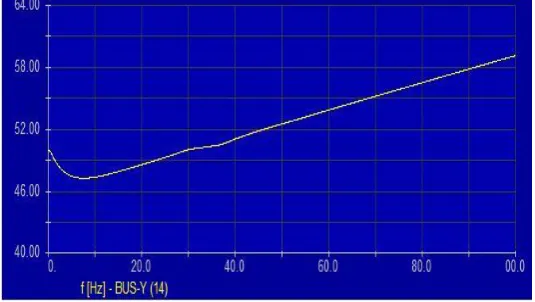
For this disturbance, frequency response, power in the generator GY and voltage in bus N1 have been taken.
Chart -1: Frequency response in BYS-Y
Chart -2: Power developed by GY
Chart -3: Voltage at BUS- N1
As it is seen from the above responses, power system loses synchronism. There is no balance between active powers, system frequency does not remain in a stable value, and bus voltage gets undesired valuesout of predetermined range.
© 2018, IRJET | Impact Factor value: 6.171 | ISO 9001:2008 Certified Journal | Page 1480
Chart -4: Frequency response in BYS-Y
Chart -5: Power developed by GY
Chart -6: Power developed by GX
As we can see, sudden loss of load, causes great transients in generated active powers. The frequency gets a stable value, but as the GOV is not present, the time that takes the frequency to stabilize is too high, approximately 100 s.
c) Another simulation made is that of a three phase short circuit in bus N3. The faults occurs in t=0.2 s, while the fault is cleared after 0.1s in t=0.3 s. The shown below responses are taken for that case.
Chart -7: Power developed by GY
Chart -8: Frequency response at BUS-Y
System frequency stabilizes for a great time of 150 seconds. In the time of short circuit and for a big time after the fault is cleared, we can see great transients of active power in balancing generator GY.
CASE 2
Generators are equipped with AVR and GOV
Different simulations are made placing several faults in the system.
© 2018, IRJET | Impact Factor value: 6.171 | ISO 9001:2008 Certified Journal | Page 1481
Chart -9: Frequency response in BUS-Y
Chart -10: Power developed by GY
Chart -11: Voltage at BUS-N3
Chart -12: Power in load L1 (NG1)
In this case, system frequency drops under unrated values, to later stabilize in a lower range. Bus voltages become lower, but the impact of AVR is visible making voltages to remain in stable values. The active power in load L1 (NG1), becomes lower in accordance with frequency drops
.
b) Another simulation is made for sudden loose of load
Chart -13: Frequency response at BUS-Y
Chart -14: Voltage at BUS- N5
Chart -15: Power developed by GY
© 2018, IRJET | Impact Factor value: 6.171 | ISO 9001:2008 Certified Journal | Page 1482 c) Three phase short circuit in bus N4, occurs in t=0.2 s, while
the fault clearing time is set in t= 0.3 s. For this case the shown below responses are taken.
Chart -16: Frequency response at BUS-Y
Chart -17: Power developed by GY
Chart -18: Current at line L5
Short circuit dynamic process is closely linked to active power fluctuations in the balancing generator, and causes an increase in transmission lines currents. As the generators are equipped with automatic regulators, system frequency stabilizes in a very short time.
8. CONCLUSIONS
In this paper power system transient stability and impact of AVR and GOV is briefly studied.
Making simulation for different system disturbances and taking responses for generators with and without AVR and GOV, a clear and simple concept about system stability and behavior during transients is given.
For generators equipped with automatic regulators, the voltage and system frequency, get a steady value after the disturbance, after the impact of the controllers. It takes a greater time for frequency to re-establish in a steady value, in the case of generator lose, and it takes a smaller time in the case of three phase circuits. From that, we can easily understand that losing of a generating unit is a larger disturbance than the short circuit fault. Bus voltages re-establish in 0.9Un after the impact of AVR, and this value is close to the predetermined voltage range.
Making simulations for missing AVR and GOV, lets us see that system frequency does not re-establish for loss of generating unit. Furthermore bus voltage takes value under normal predetermined range.
As it is shown from the study, using of AVR and GOV, plays an important role in the power system transient stability.
REFERENCES
[1] Jan Machowski,Janusz W.Bialek and James
R.Bumby,(1997),Power System Dynamics and Stability,John Wiley &Sons Ltd.
[2] P. Kundur, “Power System Stability and Control,”
McGraw, Hill, New York, 2001.
[3] Michael J. Basler and Richard C. Schaefer (2005),
“Understanding Power System Stability”. IEEE Basler Electric Company, 0-7803-8896-8/05/.
[4] [Anderson and Fouad, 1993] P.M. Anderson and A.A.
Fouad. Power System Control and Stability, Revised printing, IEEE Power System Engineering Series, IEEE Press Inc., 1993.
[5] M. Pavella and P.G. Murthy. Transient Stability of Power
Systems, Theory and Practice. John Wiley, 1993.
[6] Luonan Chen, Hideya Tanaka , Kazuo Katou , Yoshiyuki
Nakamura., “Stability analysis for digital controls of power systems,” Electric Power Systems Research , Vol. 55, No. 2, pp. 79-86, 2000. doi:10.1016/S0378-7796(99)00097-8.
[7] G¨oran Andersson, Modelling and Analysis of Electric
© 2018, IRJET | Impact Factor value: 6.171 | ISO 9001:2008 Certified Journal | Page 1483
[8] P. M. Anderson, A.A. Fouad, Power System Control and
Stability, The Iowa State University Press ,Ames, Iowa, USA, Vol I, 1977.
[9] Luonan Chen, Hideya Tanaka , Kazuo Katou , Yoshiyuki
Nakamura., “Stability analysis for digital controls of power systems,” Electric Power Systems Research , Vol. 55, No. 2, pp. 79-86, 2000. doi:10.1016/S0378-7796(99)00097-8.
[10] Gulvender, Priyajit Dash. “Study on Mathematical
Modeling of Power System Stability Analysis”. International Journal of Advanced Research in Electrical, Electronics and Instrumentation Engineering.Vol. 5, Issue 6, June 2016.
[11] Hadi Saadat, Book: “Power System Analysis”, Tata
McGraw-Hill Publishing Comp. Ltd, New Delhi, Sixteenth reprint 2009.
[12] Hadi Saadat,(1999), Book: “Power System Analysis”
,WCB McGraw-Hill International Editions.
[13] Pranamita Basu, Aishwarya Harichandan, “Power
System Stability Studies Using Matlab”, National Institute of Technology Rourkela- 769008, Orissa.
[14] B.R Gupta,(1999), Book: “Power System Analysis and
Design”, Wheeler Publishing.
[15] M V Deshpande (2006), Book: “Electric Power System
Design”, Tata McGraw-Hill Publishing Company Limited.
[16] Power Systems Dynamics. Stability and Control by K. R.