Human Cortex: State Estimates and Reference
Frames
Thesis by
Matiar Jafari
In Partial Fulfillment of the Requirements for the degree of
Doctor of Philosophy
CALIFORNIA INSTITUTE OF TECHNOLOGY Pasadena, California
2019
ã 2019 Matiar Jafari
Dedication
For my family past, present, and future. And
Acknowledgements
This work would not have been possible without the backing and support of the people listed here. This work is the product of those who shaped me before and during this time. There is no amount of words I can say to express how grateful I am for each and every person who has been there with me. I could never adequately do justice to you all, but I would like to at least acknowledge a subset of individuals who have directly impacted my work and time at Caltech.
Firstly, I would like to express my sincere gratitude to my advisor Dr. Richard A. Andersen for the continuous support of my Ph.D. work. Your patience, immense
knowledge, and resilience especially in the face of adversity have not only helped shape this work, but also my personal life.
I’d like to thank Dr. Tyson N.S. Aflalo, for being an outstanding mentor, friend, and colleague. You have helped shaped my life and career and provided me with a basis set of tools to grow and learn from. While I was not the graduate student that you asked for you took a chance on a young aspiring student who had little to no background in
computer programming. I am indebted to you for this work finally coming to fruition, my growth as a scientist, and as a person. You have taught me many lessons both directly and indirectly.
To the rest of my gracious committee Dr. David Chan, Dr. David Prober, and Dr. Ueli Rutishauser: you have exceeded all expectation and obligation, by generously offering your time and constructive input throughout the years.
The rest of my family at Caltech: Dr. Spencer S. Kellis, for supporting a taking on a naïve young student and gently guiding and supporting me through my missteps. My Greek family, Vasilieios, Sofia, and Ariadne Christopoulos for always lifting me up, listening, and wisely advising me how to go about any issues I was facing. Dr. Michelle Armenta-Salas, for always being understanding even when I was being difficult. HyeongChan Jo, for the countless memories and laughs we have shared over the years. Kelsie Pejsa, for being my biggest fan and supporter. Dr. Viktor Shcherbatyuk, for always having a joke ready to make me laugh. Also my utmost gratitude to my many other friends and colleagues for productive discussions and making this experience an unforgettable one: Dr. Christian Klaes, Dr. Boris Revechkis, Dr. Luke Bashford, Dr. David Bjanes, Varun Wadia, Sarah Wandelt, Charles Guan, Kelly Kadlec, and Isabelle Rosenthal.
Abstract
Interacting with our environment involves multiple sensory-motor circuits throughout the
human brain. How do these circuits transform sensory inputs into discernable motor
actions? Our understanding of this question is critical to behavioral neuroscience and
implementation of brain-machine interfaces (BMIs). In this thesis, we present
experiments that explore the contributions of human cerebral cortex (parietal, premotor,
and primary somatosensory cortices) to sensory-motor transformations. First, we provide
evidence in support of primary somatosensory cortex (S1) encoding cognitive motor
signals. Next, we describe a series of experiments that explore contributions of posterior
parietal cortex (PPC) to the internal state estimate. Neural correlates for the state estimate
are found in PPC; furthermore, it is found to be encoded with respect to gaze position.
Finally, we investigate reference frame encoding in regions throughout human cortex
(AIP, SMG, PMv, and S1) during an imagined reaching task. We find the greatest
heterogeneity among brain regions during movement planning, which collapses to a
largely single reference frame representation (hand-centered) during execution of the
imagined reach. However, this result is dependent upon brain region. These findings
yield new perspectives and evidence on the organization of sensory-motor
Table of Contents
Abstract ... vi
1. Introduction ... 1
1.1 Background ... 2
1.1.1. Brain Machine Interfaces ... 2
1.1.1 Reference Frames ... 12
1.1.2 Internal Models ... 16
1.1.3 State estimation in PPC ... 17
2. Neural Correlates of Cognitive Motor Signals in Primary Sensory Cortex ... 22
2.1 Introduction ... 22
2.2 Methods ... 22
2.2.1 Subject Information ... 22
2.2.2 Surgical Planning and Implantation ... 23
2.2.3 Reference Frame Task ... 23
2.2.4 Neural Recordings ... 24
2.2.5 Eye Tracking ... 25
2.2.6 Linear Analysis for Tuning ... 26
2.2.7 Reference Frame Analysis: Gradient Analysis ... 27
2.2.8 Dimensionality Reduction ... 28
2.3 Results ... 29
2.4 Discussion ... 38
3. Neural Correlates of the Internal State Estimate in Human Posterior Parietal Cortex ... 39
3.1 Introduction ... 39
3.2 Methods ... 41
3.2.1 Internal Model Task ... 41
3.2.2 Spatial Match-to-Sample Task ... 43
3.2.3 Behavioral Variable Tuning ANOVA ... 44
3.2.4 Linear Analysis for Tuning ... 45
3.2.5 Gradient Analysis ... 46
3.2.6 AUC Analysis ... 47
3.2.7 Population Decoder Analysis ... 47
3.2.8 Cross-Hand Position Classification Analyses ... 48
3.3 Results ... 49
3.4 Discussion ... 62
4. Diverse Reference Frame Representations Across Human Cortex ... 65
4.1 Introduction ... 65
4.2 Methods ... 69
4.2.2 Surgical Planning and Implantation ... 70
4.2.3 Reference Frame Task ... 71
4.2.4 Neural Recordings ... 72
4.2.5 Eye Tracking ... 73
4.2.6 Linear Analysis for Tuning ... 73
4.2.7 Reference Frame Analysis: Gradient Analysis ... 74
4.2.8 Dimensionality Reduction ... 76
4.3 Results ... 77
4.3.1 Imagined Reaching Related Activity in Human Cortex ... 79
4.3.2 Reference Frames ... 80
4.3.3 Heterogeneous Representations of Coordinate Frames ... 84
4.3.4 Population Level Encoding of Reference Frames ... 88
4.3.5 Temporal Evolution of Reference Frames ... 96
4.3.6 Decoding Accuracy ... 101
4.4 Discussion ... 104
5. Conclusion ... 111
List of Illustrations and/or Tables
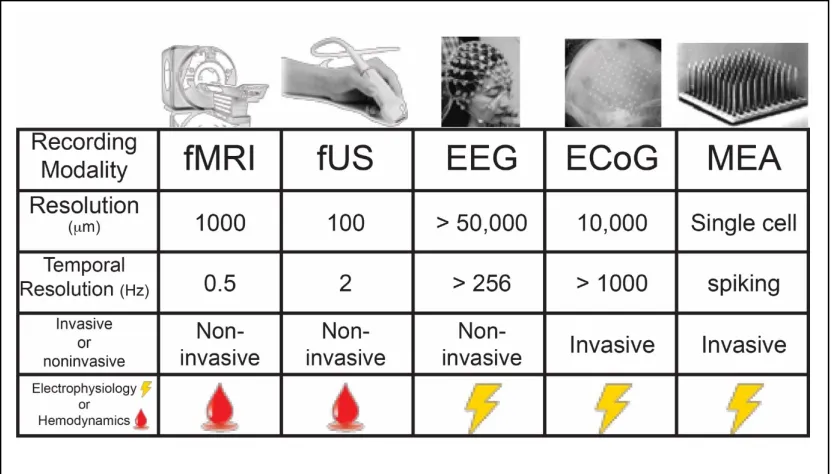
Figure 1.1. Different recording modalities ... 10
Figure 1.2. Schematic of Sensorimotor Integration ... 19
Figure 2.1. Behavioral Task, Electrode Location, and Tuning Throughout Task ... 30
Figure 2.2. Example S1 Unit, Gradient Analysis, and Distribution of Gradients of Tuned Units ... 32
Figure 2.3. Idealized Unit Responses Displaying Three Different Reference Frames ... 33
Figure 2.4. Graphical Illustration of Complex PCA Processing ... 35
Figure 2.5. Dimensionality of population level reference frames from S1 ... 36
Figure 2.6. Parallel Analysis in S1 ... 37
Figure 3.1. Schematic of Sensorimotor Integration, Task Design, and Tuning Across Epochs ... 50
Figure 3.2. Idealized, Sample, and Population Responses during the Mask Epoch ... 51
Figure 3.3. Lack of Coding for Imagined Hand Position in Working Memory Task ... 54
Figure 3.4. Distinct Representations for Hand Position and Potential Reach Targets ... 58
Figure 3.5. Direction Encoding in AIP ... 61
Table 4.1. Criteria for Categorizing Individual Units ... 75
Figure 4.1. Experimental Design, Recording Locations, and Significant Tuning Across Epochs ... 78
Figure 4.2. Eye Position Distribution for Different Task Epochs and Cued Positions ... 79
Figure 4.3. Idealized Unit Responses Displaying Three Different Reference Frames ... 82
Figure 4.4. Example Units from AIP and SMG and their Reference Frames ... 83
Figure 4.5. Heterogeneous Reference Frame Representations Across Brain Regions ... 86
Figure 4.6. Population Level Reference Frames Across Brain Regions ... 89
Figure 4.7. Comparison of Strength of Modulation for Each Vector ... 95
Figure 4.8. Graphical Illustration of Complex PCA Processing ... 97
Figure 4.9. Correlation of Reference Frame Representations over Time and Across Brain Regions . 98 Figure 4.10. Dimensionality Reduction of Reference Frames ... 99
Figure 4.11. Decoding Target Position from Unique Hand Positon ... 102
1. Introduction
From the eye-hand coordination of a skilled drummer’s rhythm to the effortless pouring
of freshly brewed coffee into a mug, we have come to observe movements as smooth,
accurate, and coordinated actions that interact and adapt to the ever-changing dynamics
of our environment. The smooth and unconscious nature of our interaction with
surroundings conceals the true complexity of the underlying neural processes. These
seemingly effortless actions are driven by a complex electrical symphony built of
intricate networks of neurons located in a multitude of sensory and motor brain areas.
The electrical potentials emerging across these areas produce precise and fluid
representations of the surrounding sensory environment, intended movement, and internal
simulation of these dynamics.
An action or behavior that interacts with our surroundings is a dynamic link between our
sensory world and our internal motor intentions. The coupling of sensory and motor are
partially characterized by the following: 1) sensory information that encodes the
spatiotemporal location of a movement goal, and 2) an estimate of the current state of the
body, limb, and relevant effector. For example, when you visually identify a desired
object in space and subsequently engage the musculature required to reach for it, your
brain must integrate sensory information about the location of the target with information
about the position of your body and effector (e.g., hand) in order to generate a smooth
These characteristics of sensory-motor control are discussed in Chapters 2, 3, and 4. In
this chapter we will provide background on the pertinent literature with respect to the
following topics: 1) a brief history and introduction to brain machine interfaces, 2)
coordinate frame (i.e. reference frame) transformations, and 3) neural evidence in
non-human primates (NHPs) of internal state estimates. These will build a groundwork upon
which Chapter two (Neural Correlates of Cognitive Motor Signals in Primary Sensory
Cortex.) and four (Diverse Reference Frame Representations Across Human Cortex) will
build upon. In Chapter three (Neural Correlates of the Internal State Estimate in Human
Posterior Parietal Cortex), we will provide single-unit evidence of an internal state
estimate of limb position in the posterior parietal cortex (PPC) of an adult human, which
to the best of our knowledge is the first human single unit evidence to show that PPC
encodes an internal state estimate.
1.1
Background
1.1.1.
Brain Machine Interfaces
In 1924, a psychiatrist named Dr. Hans Berger arguably made the first giant leap towards
how we try to understand the brains function. His discovery of electroencephalography
(EEG) was just the beginning and it would take almost half a century (1976) until Dr.
Jacques Vidal at UCLA published his seminal paper “Real-time detection of brain events
in EEG.” Vidal and colleagues went on to show the first evidence that they could detect
and classify individual evoked responses with reliability, and furthermore coined the term
that by recording from the brain he and his team could utilize brain signals effectively
enough to control a cursor through a two-dimensional maze (Vidal, 1973; Wolpaw and
Wolpaw, 2012).
The annual incidence of spinal cord injury (SCI) is estimated to be 40 cases per million
population in the United States, approximately 12,500 new SCI cases per year. These
cases exclude those who die at the scene of the accident (National Spinal Cord Injury
Statistical Center, 2015). Unfortunately, many high-level spinal cord injuries result in
tetraplegia, that is, the total or partial paralysis of all four limbs and torso as well as loss
of sensation below the level of injury. Per consequence, many tetraplegic patients are
unable to perform many activities of daily living (ADL), such as eating and bathing.
Fortunately, recent advances in neuroprosthetics and brain-machine interfaces (BMIs)
have helped propel the translation of nearly a half century’s worth of NHP BMI work to
human clinical trials in tetraplegic participants. While BMIs have numerous potential
applications, the scientific community has identified that enabling direct brain-machine
communication for tetraplegic patients would have a significant impact on both the
personal and financial aspects of SCI patients’ lives: the long term aim of such research is
to provide autonomy for patients to perform ADLs.
Prior to the initiation of the first intracortical BMI clinical trials (Hochberg et al., 2006)
the field was built upon decades of NHP research. Early evidence began to accumulate in
NHPs reliably modulated single neurons when given visual feedback of an analog signal
correlated to their spiking activity, in an operant conditioning paradigm (Fetz et al.,
1969). This fortuitous finding came while Fetz and colleagues were trying to determine
the motor analog to sensory receptive fields, wherein it was established that many of the
operantly rewarded responses were associated with active limb movements (Fetz and
Baker, 1973). As the rewarded unit was continuously driven by the animal for a reward,
the associated movements became more discrete and often dropped out entirely, further
adding that the central volitional drive on cells can be modulated independent of
peripheral input (Fetz, 2007). These findings along with a series of other impressive
demonstrations of neural control set the foundation for the field now referred to as
brain-machine interfaces (BMIs) (Wolpaw and Wolpaw, 2012).
Brain-machine interfacing (BMI) refers to a wide array of techniques and applications
that all share the characteristic of using signals directly from the brain to control an
external device and/or using electrical or magnetic stimulation methods to “write”
information to the brain. Interfaces technologies can be invasive or noninvasive; thus, the
application of different recording techniques are often decided by technical and surgical
constraints. Examples of recording methods that measure neuronal electrical potentials,
either directly or indirectly, include electroencephalography (EEG), electrocorticography
(ECoG), and intracortical microelectorde arrays (MEAs). EEG measures electrical
potentials at the scalp that reflect the activity of billions of neurons whose summed
ECoG is an invasive technique that involves implanting an array of electrodes underneath
the skull, now capable of measuring the local field potentials of more specific cortical
neuron populations. MEAs measure local field and single unit activity by implanting
small 4 mm x 4 mm intracortical arrays in carefully localized brain areas of interest.
There are also methods of measuring brain activity indirectly through neurovascular
coupling for the purpose of a BMI control signal. These techniques include functional
magnetic resonance imaging (fMRI), functional near-infrared spectroscopy (fNIRS) and
functional ultrasound (fUS). For more detail on these methods, we direct the reader to
Wolpaw and Wolpaw, 2012. In clinical practice, the number of BMI applications and
recording techniques are still narrow. The most commonly implanted BMI is the cochlear
implant, where auditory sensory information is conveyed to the user via electrical
impulses from a medical device that replaces the function of a dysfunctional inner ear
(House, 1976). More recently, BMI applications aimed to replace (Collinger et al., 2013)
or assist (Norman et al., 2018) motor function in people that are severely paralyzed due to
neurological injury. For example, BMIs have been shown to be capable of controlling
cursors, robotic limbs, and functional electrical stimulation (FES) of the user’s own body
(Aflalo et al., 2015; Ajiboye et al., 2017; Chaudhary et al., 2015; Collinger et al., 2013;
Hochberg et al., 2006). As a result, BMI technology and science has garnered increasing
attention within academic, private, and public domains.
As the number of independent neural signals we can record from grows, much BMI
techniques from various fields including control theory, information theory, and artificial
intelligence. BMI-neuroprosthetic applications, e.g. control of robotic limbs and
computer cursors, has primarily leveraged the dynamics of neural firing rates in cortical
regions where the subjects’ motor intentions are hypothesized to be encoded. The link
between firing rates of various motor related cortices has been established with half a
century of scientific progress demonstrating that these populations can accurately predict
overt motor intentions. This was expanded upon by Georgopoulous et al. (1982) with a
demonstration that a simple linear sum of the preferred directions of neurons with
overlapping tuning curves could predict arm movements. These findings, along with
others in other cortical regions, helped propel the field forward toward extracting
movement parameters from populations of neurons.
Traditionally, a BMI model is fit during a training period, wherein the brains
representations of movements are recorded in parallel with the subject mimicking or
attempting an instructed action. During this time the subject has no overt control and is
rather attempting or imagining the movement so as to create a training set of data with
stereotyped actions. For example, a subject will be asked to concurrently attempt the
same movements as a predetermined cursor trajectory is displayed on the screen. The
neural data from this training set will then be used by a neural encoder to relate the neural
activity that with a given label or movement direction. These models are then used during
a testing period to decode neural information in an attempt to predict the user’s
multitude of varying linear and non-linear methods, a fast-growing and important topic
outside the scope of this work. For recent work, we refer the reader to (Glaser et al.; Kao
et al., 2015; Pandarinath et al., 2018).
Neural decoding in a BMI context leverages the electrical potentials of many neurons
firing as the basis set upon which predictions on the world are made. Hence, it is
important to know what kinds of information can be and are encoded in a given brain
region within the context of the desired BMI. For example, researchers have shown that
activity in motor and parietal cortices could be used to drive movements in a BMI context
(Aflalo et al., 2015; Ethier et al., 2012; Hochberg et al., 2006; Kim et al., 2008; Serruya
et al., 2002). In contrast, others have shown that location based information could be
predicted by leveraging the information encoded in hippocampal cells (Davidson et al.,
2009; Zhang et al., 1998). Therefore, decoding information from the brain is not only
useful in the context of BMIs but also for determining the amount of information the
brain encodes as it pertains to the external world (i.e., behavioral variables, movements,
sensations, etc.) and how the available information is differentially parcellated across
brain areas (Hernández et al., 2010; van der Meer et al., 2010; Quiroga et al., 2006;
Sugata et al., 2016).
One of the more commonly utilized areas for BMI control is primary motor cortex (M1).
encodes low-level motor output and is a final common pathway for the cortical control of
movement. Its primary downstream projections are to the spinal cord. As a result, M1
produces reliable, low-dimensional signals that correlate well with motor states such as
velocity. These qualities make it desirable for decoding movement states and dynamics
(Georgopoulos et al., 1982; Hochberg et al., 2006; Holdefer and Miller, 2002; Morrow
and Miller, 2003; Russo et al., 2018), hence its utility in BMIs for spatial cursor or
robotic limb control. Furthermore, another advantage to recording from M1 is its
topographical representation of motor intent. That is, M1 is divided into separate regions
controlling the movement of different muscles and body parts as described in the earliest
work by Penfield (Penfield and Boldrey, 1937). Briefly, leg movements are largely
elicited on the dorsal medial aspect of M1 and progress to shoulder elbow, wrist, and
hand movements more laterally and ventrally, followed by the digits, face, and mouth.
This topographical organization enables a spatially intuitive map on which BMIs can be
designed. Furthermore, later work went on to show that the densest connections were
found to be to the hand area of M1. This is to say, M1 is often-though to be an ideal
location for MEA placement for the implementation of BMI for spatial motor control
tasks (He et al., 1993; Nuyujukian et al., 2018; Rathelot and Strick, 2006).
Another area that has been used for BMI purposes is the posterior parietal cortex (PPC).
The PPC in contrast to M1 encodes higher level intentions and plays a pivotal role in the
synergy required for sensory-motor transformations in the brain (Aflalo et al., 2015;
The encoding of higher level intentions in PPC along with the ability to decode
trajectories make PPC another proven area upon which human BMIs have been
successfully implemented (Aflalo et al., 2015; Revechkis et al., 2014). We expand on the
posterior parietal cortex and its subdivisions in a later section.
It is clear that the specialization of cortical areas is pivotal to the implementation of a
BMI. However, another important aspect of the application of BMIs is the modality of
neural code that is analyzed. Most neurons use action potentials (APs) to transmit
information. This information is a product of electrical potentials reaching a threshold, at
which time a “spike” is seen and the potential travels down the neurons axon towards the
synapses of all its downstream post-synaptic neurons. The rate at which a series of APs
occur in a single neuron is one example of neural encoding that researchers leverage.
This is called a “firing rate” (FR). Electrodes are also capable of sensing the summed
activity of large populations of neighboring neurons, the “local field potential (LFP).
While FRs and LFPs are in the time domain, researchers have shown that neural codes in
the frequency domain can also be used to robustly decode information as it pertains to a
task (Adrian and Zotterman, 1926; Butts et al., 2007; Singh and Levy, 2017; Stein et al.,
2005; VanRullen et al., 2005). Much of the techniques that try to determine electrical
potential changes in the brain parenchyma utilize signals that pertain to the AP.
Interestingly, with the advent of functional magnetic resonance imaging (fMRI)
researchers found that measuring blood oxygenation levels in regions of the brain is also
signals associated with hemodynamic methods such as fMRI do not retain the
spatiotemporal qualities of invasive electrophysiological methods, they have the
advantage of being noninvasive and capable of large-structure or whole-brain imaging.
Another factor, briefly discussed above, in consideration of BMI recording techniques is
invasive versus noninvasive strategies and the required spatial and temporal resolutions
desired (Figure 1.1). Invasive strategies for recording neural activity such as
microelectrode arrays (MEAs) and electrocorticography (ECoG) are yet unmatched for
spatiotemporal resolution. MEAs are implanted directly in superficial cortical areas and
allow for direct recording of single neuronal action potentials as well as local field
potentials (LFPs) from the summed electrical currents of surrounding neurons. ECoG
uses similar recording strategies as EEG; however, due to the invasive nature of ECoG
[image:19.612.108.524.162.399.2]resolution is increased due to the fact that electrodes are placed underneath the cranium,
Figure 1.1 Different recording modalities and their associated resolutions,
yielding greater spatial resolution when compared to EEG. Substantial improvements in
the spatial resolution of ECoG can be achieved with the use of closely spaced subdural
grids and strips of electrodes yielding < 5 mm2 resolution (Buzsáki et al., 2012). Given
the above regarding the techniques that utilize electrophysiology more recent
implementations of MEAs and ECoG have been shown to reliably be useful for the
implementation of different BMIs ranging from decoding motor imagery with MEAs in
tetraplegic human subjects and decoding speech in humans with high density ECoG
signals (Aflalo et al., 2015; Chartier et al., 2018; Hochberg et al., 2006).
In contrast to the invasive techniques discussed above, EEG, being the oldest of the
recording modalities, is the most widely used recording modality; however, it is limited
by the distorting and attenuating effects of the tissues and bone that electrical potentials
must travel through. Consequentially, single neuronal firing is highly unlikely to be found
using this modality, rather the recorded signal from a single electrode more closely
relates to a lower resolution (smoothed) version of the LFP in an area about 10 cm2
(Buzsáki et al., 2012). Modalities for recording neural activity that utilize hemodynamics
as a proxy for neural activity have the advantage of being more non-invasive and
sacrificing spatio-temporal resolution (BOLD response and temporal limitations)
(Baumann et al., 2010). However, one advantage of fMRI and more recent methods like
function ultrasound (fUS) is the greater field of view, allowing for in some cases whole
brain imaging that can be of advantage when desiring cortico-cortical interactions
(Wander et al., 2016). Given the technical limitations of different recording modalities it
advancements improve this tradeoff it is something that researchers must weigh heavily
when determining the desired BMI implementation.
1.1.1
Reference Frames
As you are reading this, imagine you momentarily look away and reach for your bottled
water. After taking a sip, you place the bottle back and continue reading. After some
time, you reach again for your bottled water while you continue reading. This time you
do not shift your gaze to the bottle. Our ability to complete such a task may not seem a
significant one. While both reaches were to the same location in space, the image of the
bottle on your retina was different, the latter being in your periphery. While the reach
itself can be thought of a vector that starts at the location of your hand and ends at the
bottle, the brain must still transform the retinotopic (sensory) coordinates of the bottle to
the explicit muscle (motor) based coordinates that will yield the appropriate reach. In this
section, we aim to answer the question: How are these robust transformations between
multiple coordinates executed at the neural level?
Our brain performs a remarkable number of subconscious coordinate transformations to
enable smooth interactions with our environment (Andersen and Cui, 2009; Chivukula et
al., 2019). In reaching for the bottle in the above example, the brain determines the
appropriate axes to represent in space the configuration of the arm (effector) and the
position of the cup (object) to bring one to the other. How does the brain reconstruct the
different signals: proprioceptive information, visual information, and motor feedback.
Understanding the coordinate transformations that the brain intrinsically computes in the
process of motor control is essential in eventually utilizing cortical neural signals for
BMI applications. This is vital as algorithms used in BMIs must know what behavioral
effectors modulate neural activity in order to yield the best control.
Single neuron data from both humans and NHPs suggest that spatial locations are
represented in multiple reference frames and can vary within and across sensory
modalities (Avillac et al., 2005; McGuire and Sabes, 2009, 2011). For instance, visual
stimuli can be encoded with respect to the eye or the head, and tactile stimuli may
likewise be encoded with respect to the eyes or body parts (e.g., hands) (Buneo et al.,
2002; Pesaran et al., 2006b, 2010). There appear to be anatomically defined, regional
preferences for the coordinate frames utilized. Both visual and auditory stimuli are
encoded in a common gaze-centered reference frame by neurons in most regions of the
PRR, but in hand-centered coordinates by area 5d (Andersen and Cui, 2009; Crawford et
al., 2011; Bremner and Andersen, 2012). However, a recent growing body of evidence is
suggestive of gradients of representations including mixed or intermediate reference
frames being used throughout the motor system (Batista et al., 2007; Chang and Snyder,
2010; Colby and Duhamel, 1996; McGuire and Sabes, 2011; Pesaran et al., 2006). An
explanation as to why a distribution of reference frames may exist is postulated to be due
to a reduction in planning variability (McGuire and Sabes, 2009). Moreover, reference
behavioral demands, ensuring that the most relevant postural and spatial information is
encoded at each behavioral stage(Bremner and Andersen, 2014; Chang and Snyder, 2010;
Chang et al., 2009).
The process of converting sensory stimuli into motor commands (sensory-motor
transformation) has historically been postulated to occur through the remapping of
disparate modalities into a common reference frame(Avillac et al., 2005). Neurons in
distinct brain areas were predicted to have receptive fields (RFs) with positions invariant
of reference frame(Duhamel et al., 1997). However, multiple multisensory areas (such as
the superior colliculus) demonstrate partially shifting RFs(Pouget and Snyder, 2000;
Trotter and Celebrini, 1999). For instance, when an eye movement is executed, the neural
representation of spatial location for eye centered RFs must update. Although these
representations change with eye movement, they do so by less than the change in eye
position, which suggests, and indeed requires, a shift in the RF itself. These findings also
extend to auditory RFs for the same neural units (Pouget et al., 2002). Moreover, the
amplitude of the neural response may be modulated by eye position, creating a
phenomenon referred to as a “gain field” (Andersen et al., 1985; Pouget and Snyder,
2000).
The multiple modalities and nuances of reference frames across brain areas and even at
reference frames are maintained, transformed, and integrated. Several hypotheses have
been put forward to unify reference frame neural encoding (Chivukula et al., 2019). In
one such hypothesis, a mixture of reference frames appears to be heterogeneously
distributed around the brain. This may explain partial shifts in RFs, and gain fields
(Pouget et al., 2002). Another, more recent concept, mixed selectivity, is increasingly
recognized as fundamental to the coding and implementation of brain functions (Rigotti
et al., 2013). Mixed selectivity dictates that neurons behave differently in different
contexts, belonging to different ensembles that encode explicit but highly
context-dependent information (Fusi et al., 2016). The common neural substrate may provide a
basis for the transfer of learning: motor skills acquired through one ensemble may be
recruited by others (Zhang et al., 2017). This provides an alternative viewpoint for gain
fields and multiple reference frames; a single neuronal population may encode many
types of information in a context dependent manner. A direct consequence of this is that
overlapping activity at the population level may afford the brain significant
computational savings through shared resources, such as different views of the object,
different starting configurations of the effector, even information from different brain
areas (Fusi et al., 2016; Zhang et al., 2017). Within the framework of mixed selectivity,
neurons can greatly enhance the diversity and dimensionality of neural representations
that can be encoded by a subset of neurons (Rigotti et al., 2013). This has important
implications for cortical neuroprosthetics, foremost amongst them that large volumes of
data may be extracted from cortical signals derived from strategic neuronal applications.
For example, PPC encodes rich, high-level cognitive processing and may thus serve as
al., 2015; Cohen and Andersen, 2004; Zipser and Andersen, 1988). In Chapters 2 and 4
we investigate reference frame representations and the common modes of tuning found
across areas during a delayed cognitive reaching task.
1.1.2
Internal Models
Our lives are filled with situations upon which we must act faster than our senses allow
us. The sensation of catching a falling cup, a major league pitcher throwing a curveball
for a strike, or serving a tennis ball with spin, our lives are filled with these scenarios in
which we must evaluate and integrate information from our bodies and environment to
compensate for physically inescapable sensory delays. A growing body of literature has
begun to amount evidence in support of the theory that the brain utilizes internal models
during controlled movements, such as those mentioned above.
Internal models utilize outgoing motor signals and sensory feedback to internally
simulate the dynamics of behavior during motor control (Shadmehr and Krakauer, 2008;
Wolpert and Ghahramani, 2000; Wolpert et al., 1995a, 1995b). Two categories of internal
models exist: forward and inverse. Forward models, predict future states of the motor
system given the current motor command without the associated sensory input (Jordan
and Rumelhart, 1992; Wolpert and Ghahramani, 2000; Wolpert et al., 1995a). Thus, the
primary function of a forward model is to predict the relationship between our motor
actions and their sensory outcomes. Conversely, an inverse model does the opposite.
and the motor actions that will elicit the desired state (for more on inverse models see
(Gomi and Kawato, 1996; Katayama and Kawato, 1993)). Given the above,
computational models suggest that to do this one must maintain an internal state estimate
via efferent motor commands and afferent sensory input. This internal state estimate is
stored and integrated further as more motor and sensory information is collected.
Integrating this information over time produces a much more stable internal estimate that
effectively reduces the noise from motor signals and delayed sensory information.
To do this the brain must maintain an internal state estimate of the body and the PPC has
substantially gained evermore evidence that this is where it is stored. The PPC is thought
to be the location where this estimate is stored due to the location of this region. PPC
associates multiple sensory modalities and subsequently transforms the association into a
representation for guiding motor actions (Andersen and Buneo, 2002; Andersen et al.,
1997; Colby, 1998). Furthermore, the PPC sits at an intersection of the dorsal visual
pathway of the brain where it receives efferent and afferent motor and sensory signals
making it a strong candidate for integrating the internal state estimate with information
regarding these incoming signals (Desmurget and Grafton, 2000a; Goodale, 1998; Inoue
et al., 1998).
1.1.3
State estimation in PPC
Strong evidence in support of this theory was published in the seminal work published by
Rushworth and colleagues followed by Wolpert and colleagues in NHPs and a case report
areas of the PPC, SPL, and IPL, wherein they found that reaches made in the dark (using
proprioception) were dysfunctional when lesions to the SPL were present, but not IPL. In
contrast, reaches made in the light (using vision) were dysfunctional when lesions in the
IPL were present, and not the SPL (Rushworth et al., 1997) . Furthermore, Wolpert and
colleagues followed this with their reporting of patient PJ’s inability to maintain an
internal representation (Wolpert et al., 1998). Patient PJ suffered from an extra-axial cyst
encroaching upon the cortex of the left superior parietal lobe. She presented with a
progressively worsening symptoms in her right arm. The symptoms initially began with
jerking of her right arm and two years later was marked by an increasingly uncertain
sense of arm position if her vision of the arm was occluded or out of view. If vision of the
arm was not present she reported that over time under a static load the arm disappeared.
and colleagues in so far that she could maintain constant and stable representations of the
hand if she was given visual feedback.
PPC is known to be involved in not just the specification of a movement plan but also the
control of ongoing movements. Perhaps some of the better evidence in support of this can
be found in the studies done by Grea et al. (2002) where they observed an inability for a
patient with bilateral parietal lesions to reach toward a target if it jumped to a new
location during the movement to the initial target location. The patient continued to the
initial location as if the target had not been displaced (Gréa et al., 2002). Similarly, TMS
studies in subjects with normal parietal function show similar deficits in reaching when
given a pulse of stimulation as the reach begins to the initial target (Desmurget et al.,
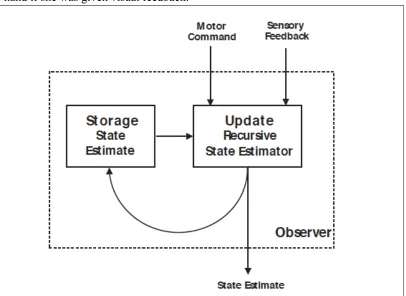
Figure 1.2 Wolpert and colleagues schematic of sensorimotor integration. The
[image:28.612.105.511.111.407.2]1999). These studies suggest that either integration of novel sensory information, as it
regards to the target jumping during the reach, is affected by a lesion or TMS stimulation.
These findings fit in well with Wolpert and colleagues’ findings that suggest PPC serves
as an observer shaping the internal state estimate of the arm as it is recursively updated.
An inability to maintain this estimate would lead to deficits in monitoring the state of the
effector and correcting ongoing movements, as was found in the studies mentioned here.
State prediction can also be used in imagined movements. Imagined movements which
are found to share the same time course as attempted movements despite the lack of
sensory feedback is suggestive of the brain maintaining a state estimate. Interestingly,
Sirigu and colleagues found that patients with PPC lesions had significantly different
imagined time courses for the same attempted movements (imagined movements were
usually faster) (Sirigu et al., 1996). In contrast patients with motor cortex lesions were
found not to have differences in these same attempted and imagined movement despite
difficulty with the attempted movements. The production of imagined and attempted
movements differ in that imagined movements rely solely on the prediction and must
change the weight of incoming sensory feedback to zero (Shadmehr and Krakauer, 2008).
Deficits in adjusting the weight of sensory feedback would result in deficient estimates of
imagined movements. These findings when put together can be explained by the same
observer model described by Wolpert and colleagues (Fig 1.2). The most recent
physiological evidence in NHPs of state estimates being stored and updated in PPC show
possible link with the internal model (Mulliken et al., 2008). In Chapter 3 we investigate
and provide to the best of our knowledge the first single unit human evidence that
internal state estimates are maintained and stored in PPC of a tetraplegic subject during a
2. Neural Correlates of Cognitive Motor Signals in Primary
Sensory Cortex
2.1
Introduction
Somatosensory cortex (S1) is largely studied and understood in its role as the primary
sensory region for processing somatic sensory signals from the body. However, recent
work highlights a more direct role in motor production: S1 neurons can respond to
passive movements alone, active movements alone, or both (London and Miller, 2013;
Nelson, 1987) and neurons become activated prior to movement initiation. S1 neurons
project to the spinal cord (Rathelot and Strick, 2006; Rathelot et al., 2017), and electrical
or optical stimulation of S1 elicits motor movements (Matyas et al., 2010; Penfield and
Boldrey, 1937; Welker et al., 1957). Taken together, these results indicate a direct role of
S1 in the production motor behavior. However, in many of these studies it is hard to
disentangle the degree to which neural signals may reflect motor variables per se or
aspects of sensory processing.
2.2
Methods
2.2.1
Subject Information
A 32-year-old male tetraplegic subject was recruited who suffered a complete C5/C6
spinal cord injury and consented 1.5 years’ post-injury to participate in a clinical trial of a
BMI system consisting of intracortical stimulation and recording. Subject FG has residual
discriminatory ability in the posterior radial section of the upper arm and forearm that is
also accompanied with paresthesia. All sensations and motor ability are consistent with
the level of the sustained injury. The subject remains intact of all other motor control and
sensations above the injury other than those noted above. The study and all procedures
were approved by the California Institute of Technology (Caltech), Institutional Review
Boards (IRB) of the University of Southern California (USC), and Rancho Los Amigos
National Rehabilitation Hospital (RLA). Surgical implantation took place at Keck
Hospital of USC. All future study sessions with this subject discussed here were run at
RLA.
2.2.2
Surgical Planning and Implantation
Surgical planning for subject FG followed the protocols described in (Aflalo et al., 2015;
Salas et al., 2018). Based off these experiments analysis of the fMRI data was done in
order to determine and identify the areas to implant. Subject FG was implanted in PMv,
SMG, and S1. All areas except S1 were implanted with 96-channel Neuroport
microelectrode arrays (Blackrock Microsystems, Salt Lake City, UT). S1 was implanted
with two 7x7 microelectrode arrays (48 channels per array).
2.2.3
Reference Frame Task
Experimental sessions with subject FG were performed at Rancho Los Amigos National
motorized wheelchair seated so that the task screen covered approximately 45 degrees of
visual angle. The subject was asked to minimize any and all head movements throughout
the task and was placed in front of the screen with a researcher monitoring his head
movements. Subject FG was seated in his motorized wheel chair throughout the duration
of the task. At the beginning of each trial the subject was cued to fixate their gaze and
imagine their right hand (dominant and contralateral to recording arrays) at one of four
locations marked by a circle and hand image, respectively. After 3 seconds a circle was
shown above the cued eye and hand positions for 1.25 seconds wherein the subject
continued to hold their gaze and imagined hand fixations. A change in the color of the
fixation marker was the cue for the subject to begin his imagined reach to the target
above. The subject was asked to make an imagined reach and maintain the imagined
ending position (target location) until the execution epoch was over (2 seconds). The
execution epoch was then followed by an inter-trial interval (ITI) of 2 seconds.
Each run consisted a total of 64 trials for each unique combination of the four eye, hand,
and target positions. This task was run 3 times (192 total trials, 3 repetitions)
consecutively with a 2-5 minute break between each run. All imagined reaches were
asked to be made within the frontal plane of the subject. Each session recording was
separated out by at least a week.
Initial placement of all arrays was predetermined based on pre-operative fMRI imaging,
placement may have differed if the initial location was occluded by vasculature seen
during the operation (Aflalo et al., 2015). Neural activity from each array was amplified,
digitized, and recorded at 30 KHz using the Neuroport neural signal processor (NSP).
The Neuroport system, composed of the arrays and NSP, has received FDA clearance for
less than 30 days of acute recordings. However, for the purposes of this study we
received FDA IDE clearance for extending the duration of the implant (IDE number:
G130100).
Thresholds at -4.5 times the root-mean-square were set after high pass filtering the full
bandwidth signal sampled, using the Blackrock Central software suite (Blackrock
Microsystems). Waveforms collected consisted of 48 samples, 10 prior to threshold
crossing and 38 samples after. These recordings were then sorted (both single and
multi-unit) using k-mediods clustering using the gap criteria to estimate the total number of
clusters (Tibshirani et al., 2001; Zhang et al., 2017). Offline sorting was then reviewed
and adjusted as needed following standard practice (Harris et al., 2016). On average
across 4 days of recordings in S1 we analyzed 163 sorted units per session. All sorting
was done prior to analysis and blind to channel or unit responses found during the task.
Further spike sorting methods can be found in Zhang et al., 2017.
Subject FG’s eye position was monitored using a 120 Hz binocular eye tracking system
(Pupil Labs, Berlin, Germany). If the subject’s gaze shifted off the cued eye position the
task was terminated and ran again ensuring that gaze position remained fixed to the cued
eye position. Eye positions were synced to the task and allowed online determination of
eye position.
2.2.6
Linear Analysis for Tuning
We defined a unit as selectively tuned if the unit displayed a significant tuning based on a
linear regression analysis. We created a matrix that consisted of indicator variables for
each unique condition separated by either a single behavioral variable or pair, similar to
(Zhang et al., 2017). There were 64 unique conditions (4 eye, hand, and target positions)
indicator variables. Firing rate was estimated as a linear combination of these indicator
variables: FR is firing rate, Xc is the vector indicator variable for condition c, ßc is the
estimated scalar weighting coefficient for condition c, and ß0 is the intercept.
𝐹𝑅 = % 𝛽𝑐𝑋𝑐 + 𝛽𝑜
+
Windows were 750 ms in duration and window start times were stepped every 500 ms.
This was done for all units in each sliding window. The significance of each fit was
< 0.05, FDR-corrected). Units that were found to be significant in this analysis were then
determined to be tuned and further analyzed in the reference frame analysis.
2.2.7
Reference Frame Analysis: Gradient Analysis
For every individual unit three trials per condition were analyzed. Trials were
subsequently aligned to the cue execution epoch (0 s). The delay epoch is defined as -1 s
to -0.25 s. Gradient analysis was used to determine the degree of modulation each
behavioral variable had on the firing rate of the unit when comparing across each unique
combination of variable pairs (Hand-Gaze (HG), Target-Gaze (TG), and Target-Hand
(TH)) (Bremner and Andersen, 2012; Buneo et al., 2002; Peña and Konishi, 2001;
Pesaran et al., 2006). For each tuned unit we created a four by four matrix (response
matrix) representing each unique behavioral variable position and its associated mean
firing rate. We averaged across trials and the third variable. Gradients were determined
using the gradient function in Matlab 2019a (Mathworks). For each gradient a resultant
angle and length are generated indicating the modulation by each variable and its strength
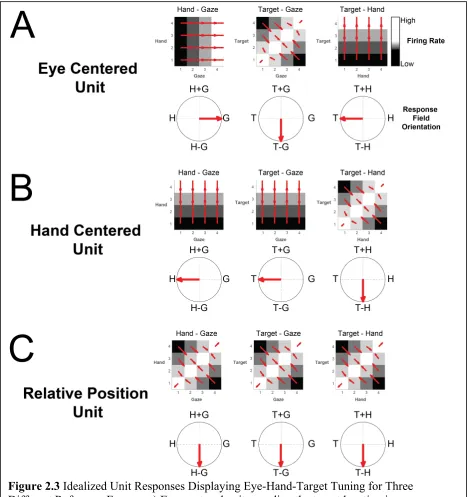
(Fig. 2.3). However, as we can see in Fig 2.3A often times the gradients show a
symmetrical pattern that would result in cancellation of symmetrical angles. To avoid
this, we double each angle in the matrix and represent each angle from 0º to ±180º.
Therefore, the summed resultant angle is represented by 0º for left-right patterns of
gradients, ±180º for up-down patterns of gradients, and -90º for gradients pointed at the
diagonal as seen in Fig 2.3A. The summed resultant angle and length, however, cannot be
variable and combinations of variables to help with interpretation. For example, in figure
2.3A hand only (H) modulation would be found at ±180º, gaze only (G) modulation is
seen at 0º, H+G at 90º, and H-G at -90º. Therefore, we can use the angle of the resultant
angle as a proxy for overall orientation bias for a variable or variable pair.
2.2.8
Dimensionality Reduction
We used population level dimensionality reduction analyses to determine the most
common modes of reference frame encoding over time in a brain area. The firing rates for
all units, trial averages, and time points were arranged in a matrix (unique trials by unit)
and reduced down using principal component analysis (Fig. 2.4). For the first 20
components we then ran a gradient analysis for each time window. Time windows were
100 ms in duration and response field angles and lengths were acquired from the start of
the cue hand-eye epoch to the end of the cue execution epoch. Analyses done with larger
steps showed similar results. Next, we converted all resultant angles and lengths into
complex numbers to account for both variables (resultant angle and length) and utilized
complex principal component analysis to identify the most common mode of tuning.
Previous work on geophysical data sets have successfully used similar methods for
identifying dynamics (Horel, 1984). A matrix of each complex value for each time point
and each component was then created and reduced to find the components that explained
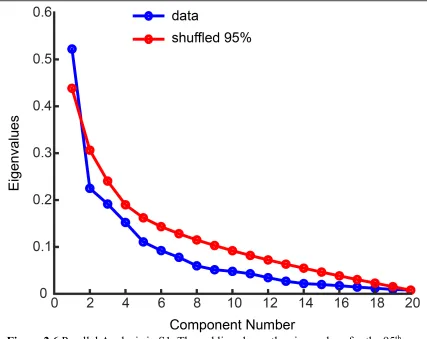
the greatest variance. Furthermore, we used parallel analysis to determine which
components from this dimensionality reduction were significant (Fig 2.6) (Franklin et al.,
2.3
Results
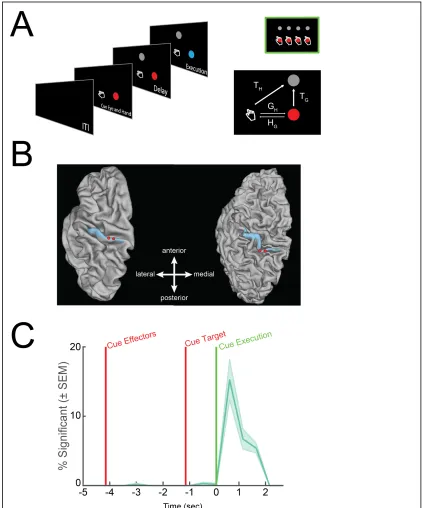
To understand if S1 processes reach intentions in the complete absence of sensation or
expected sensations we recorded single unit activity from multi-channel arrays implanted
in the sensory cortex (Fig 2.1B) of a 34-year-old tetraplegic male (FG) during a delayed
imagine reaching paradigm. The arrays were implanted in S1 as part of an ongoing
clinical trial in which we recently showed that microstimulation delivered through these
same multi-channel arrays evokes localized and naturalistic cutaneous and proprioceptive
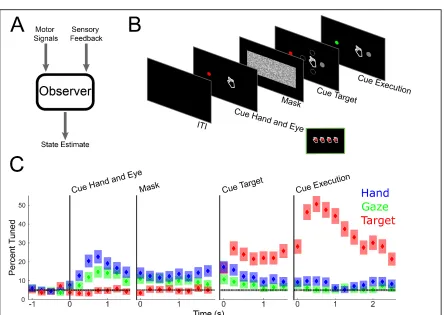
sensations (Salas et al., 2018). Our paradigm (Fig 2.1A), adapted from previous
non-human primate studies (Bremner and Andersen, 2012; Pesaran et al., 2006),
systematically manipulated fixation, imagined initial hand, and reach target locations at
distinct points in the trial. Importantly, the subject is capable of moving his eyes and thus
direct his gaze to the fixation targets. However, the paralyzed subject did not move his
arm, but instead used motor imagery to imagine moving his hand to the initial hand cue
location and subsequently move to the final target location. This design allowed us to
one, understand how activity in S1 relates to storing information about arm location,
movement plans, and movement execution; and two, characterize the reference frame of
these signals, e.g., whether movement variables are coded relative to the initial imagined
We performed a sliding window analysis to understand whether and when neurons in
sensory cortex become active for our cognitive motor task: for each unit, we used a linear
model with interactions to explain firing rate as a function of fixation, initial imagined
hand, and target locations (Fig 2.2A, p < 0.05 FDR corrected for number of units per time
slice, window size: 750 ms, step size: 500 ms). We find negligible selectivity following
cueing of the hand and eye positions indicating no neural coding for true eye position or
the imagined position of the arm. We also find negligible selectivity following target
presentation indicating no encoding of the spatial location of the target or planning
activity related to the upcoming motor action. Finally, we found that a significant
proportion of the population was selective following the instruction to initiate the
imagined reach. Thus, sensory cortex is engaged during a cognitive motor task despite
the absence of overt movement and sensory feedback, but only during imagined
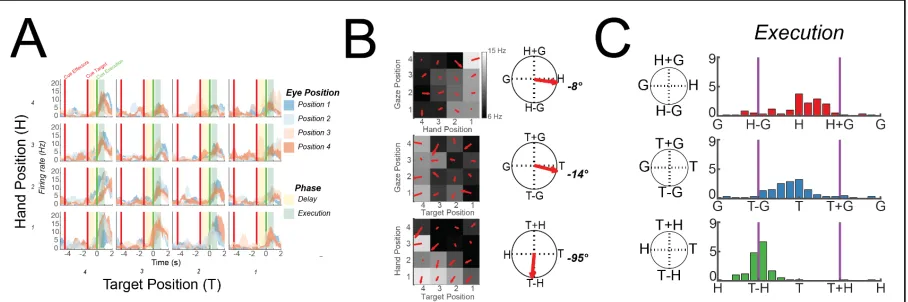
We found that nearly all the neurons selective during the movement execution phase
coded movement as the reach vector: the direction of imagined movement of the hand. In
other words, selective units coded the location of the target relative to the initial imagined
hand position (or, by symmetry, hand position relative to the target). This result was
found using a gradient analysis pioneered in NHPs (Buneo et al., 2002): neural responses
for each unit were organized into response matrices where the firing rate is coded for
each hand, eye, and target position. A gradient field is then computed which describes
how the firing rate is sensitive to changes in the behavior variables. Finally, the resultant,
or vector sum, of the gradient field summarizes the net effect of behavioral manipulations
which can be used to determine whether neural activity encodes target position relative to
gaze position (T-G), the target position relative to the hand (T-H), the hand position
relative to gaze direction (H-G), or some combination of these vectors (see Fig 2.3). A
[image:41.612.106.560.73.224.2]representative response matrix for a neuron coding the position of the target relative to
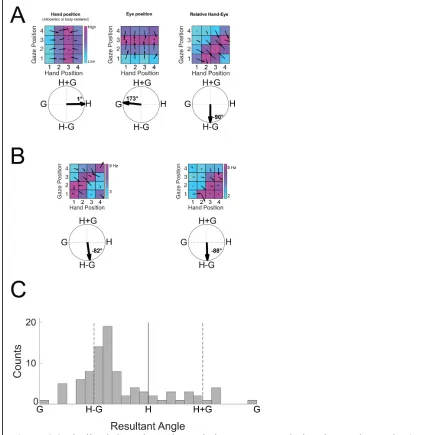
Figure 2.2 Example S1 Unit, Gradient Analysis, and Distribution of Gradients of Tuned
Units. a, Peristimulus time histograms for all 64 conditions (3 trials; mean ± standard deviation). Each of the 16 subplots shows the response of the unit to a particular
the hand and the population distribution of response gradients is shown in Figure 2.2B
Figure 2.3 Idealized Unit Responses Displaying Eye-Hand-Target Tuning for Three
Different Reference Frames. a) Eye-centered unit encoding the target location in eye
and C. Interestingly, despite no neural coding for imagined hand position prior to
reach incorporates the internal estimate of hand position when computing the reach
[image:44.612.112.540.67.511.2]response.
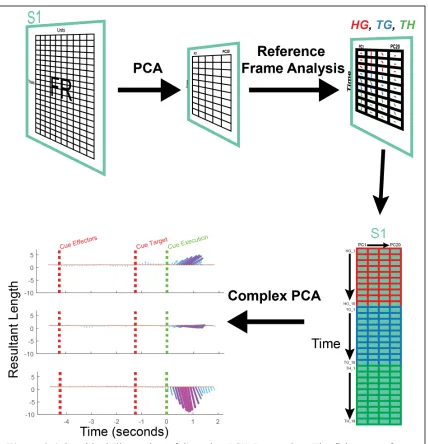
Figure 2.4 Graphical Illustration of Complex PCA Processing. The firing rates for
all units, trial averages, and time points were arranged in a matrix (unique trials by unit) and reduced down using principal component analysis (top-left). For the first 20 components we then ran a gradient analysis for each time window. Time windows were 100 ms in duration and response field angles and lengths were acquired from the start of the cue hand-eye epoch to the end of the cue execution epoch (top-right). Next, we converted all resultant angles and lengths into complex numbers to account for both variables (resultant angle and length) and utilized complex principal
Single unit analysis shows that the population is dominated by units coding the reach
vector. To verify that this interpretation is an adequate summary of S1 encoding, we used
complex principal component analysis (cPCA) to characterize the full temporal dynamics
of the reference frame of the population as a whole (Fig 2.4). The gradient analysis
described above summarizes the sensitivity of a neuron to behavioral variables using the
[image:45.612.102.571.256.596.2]resultant of the gradient, a 2D vector that can be described by a length and angle. cPCA
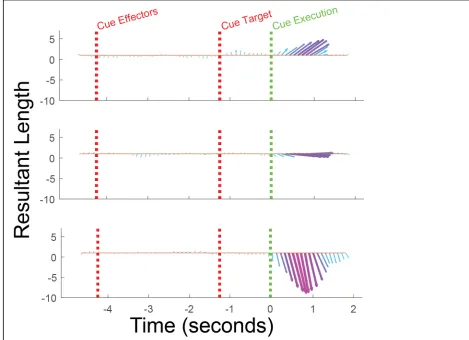
Figure 2.5 Dimensionality of population level reference frames from S1. a, Shows the most
was used as it is capable of handling our situation where data samples for each
observation are described by both a length and angle (Horel, 1984). We find that coding
of the reach vector strengthens and peaks around 750 ms after the cue to execute the
imagined reach (Figure 2.5). Further, only the first cPCA component was significant
(parallel analysis (Franklin et al., 1995), α < 0.05, Figure 2.6). This suggests that reach
coding in S1 is dominated by a single homogeneous representation of the reach vector
[image:46.612.112.539.167.506.2]exclusively during execution of the imagined reach.
Figure 2.6 Parallel Analysis in S1. The red line shows the eigenvalues for the 95th
2.4
Discussion
We have shown the first single unit evidence that cognitive imagery of movements is
represented in the primary somatosensory area of human cortex demonstrating S1
neurons track motor intentions in the complete absence of sensation. Activity is restricted
to the time of imagined execution with negligible activity while the subject must actively
maintain the position of the limb in memory, maintain fixation at distinct spatial
locations, and maintain movement plans. These results suggest that the role of S1 in
motor production is restricted to the time of movement execution. Lastly, we show S1
activity codes the reach vector, coding motor intention relative to the imagined position
of the hand. These findings are important, as we show deafferented regions of S1 encode
functional information that can be leveraged for future neuroprosthetic applications.
Furthermore, a possible concern is that these results are unique to individuals who have
lost their main peripheral input. However, recent findings from our lab and others have
shown these representations are largely stable and reorganization does not result in the
production of novel functional sensory representations (Flesher et al., 2016; Makin and
Bensmaia, 2017; Salas et al., 2018). These results implicate a role of primary
somatosensory cortex in cognitive imagery, and of S1 in motor production in the absence
of sensation, and suggest that S1 may provide a source of control signals for future
3. Neural Correlates of the Internal State Estimate in
Human Posterior Parietal Cortex
3.1
Introduction
The sensory information that informs movement, comes from a mixture of modalities,
and is noisy, frequently incomplete, and delayed (Desmurget and Grafton 2000,
Faisal, Selen et al. 2008, More and Donelan 2018). Increasing evidence suggests that
the brain overcomes these limitations by utilizing an internal model or mental
representation of the body and state of the world (McNamee and Wolpert 2018;
Desmurget and Grafton, 2000; Miall and Wolpert, 1996). For example, the brain can
use motor command signals to predict how the arm will move and therefore predict
upcoming sensory states (Jordan and Rumelhart, 1992; Wolpert et al., 1995a). During
movement, these predictions can compensate for sensory processing delays (Scott
2016) which can have a destabilizing effect when sensory feedback is used to guide
movement, and can ensure that motor output commands compensate for changing
forces that occur during movement (Johansson, Riso et al. 1992, Flanagan and Wing
1993). Such models may also be used before movement to prospectively simulate
potential actions and thus understand their possible outcomes prior to committing to a
specific action (Cisek and Kalaska 2004). This internal model of the state of the body
The posterior parietal cortex (PPC) has been hypothesized to encode such a state
estimate. The posterior parietal cortex is well-situated for this role as a functional
interface between multi-modal sensory and motor representations (Jones and Powell
1970, Mountcastle, Lynch et al. 1975). Regions of PPC have long been known to play a
critical role in representing the state of the body (Graziano, Cooke et al. 2000, Graziano
and Botvinick 2002, Ehrsson, Spence et al. 2004). Neural activity recorded in non-human
primates during reaching is consistent with coding the state-estimate (Mulliken,
Musallam et al. 2008) and the region has long been associated with visuomotor planning
(Andersen and Buneo 2002). Lesions to PPC can disrupt an individual’s ability to
maintain an internal estimate of the state of their bodies (Wolpert, Goodbody et al. 1998),
while electrical stimulation can generate the perception of movement, although no such
movement has occurred (Desmurget, Reilly et al. 2009). Transient inactivation of PPC
using transcranial electrical stimulation during movement can impact error-correction in
ways consistent with disruption of the state estimate (Desmurget, Epstein et al. 1999).
However, there is little direct electrophysiological recording evidence for internal models
in PPC as experiments are complicated; the variables of the state estimate are highly
correlated with sensory input and motor output signals that are used to construct the
internal estimate. In the most direct evidence to date Mulliken and Andersen found that
neural data on average occurs at zero lag with respect to behavior indicated a possible
link with the internal model (Mulliken et al., 2008). However, individual neurons covered
the entire spectrum from delayed to anticipatory signals, leaving ambiguity as to whether
units were encoding a state estimate as such, or simply mixtures of sensory and motor
In an ideal world, we would want an experiment in which sensory and motor variables
can be completely dissociated from the output of the internal model. The ability to
measure changes in the internal estimate of limb state in the absence of sensory feedback
would provide strong evidence for PPC encoding a state estimate. Here we adopt this
approach in a tetraplegic human. Motor imagery has been proposed to be the
manipulation of an internal state in the absence of overt movement. Here we ask whether
an internal estimate of the position the limb is updated and maintained in a motor
imagery task that controls for a variety of factors. The data comes from a single subject,
participant NS.
3.2
Methods
3.2.1
Internal Model Task
The subject was positioned so that the screen occupied approximately 25 degrees of
visual angle. The task performed by the subject was a center-out imagined reaching task
with systematic manipulation of the initial imagined arm configuration and eye fixation
point. Figure 3.1B illustrates the behavioral paradigm. At the start of each trial, the
subject was asked to fixate her eyes on a small red circle and imagine her hand at the
location of a small icon of a hand. All possible combinations of four fixation and hand
given 1.75 seconds to fixate and use motor imagery to position her hand at the instructed
cue locations. This 1.75 seconds time was determined based on the participant’s feedback
as it gave her ample time to reach the target prior to the next task epoch. A dynamic
white noise mask was then displayed for 2 seconds to extinguish the hand cue from the
participant’s vision. Critically, during this masking epoch, there was no sensory
information available to the subject about the location of the imagined hand position. The
mask was then removed revealing the original cued hand position as well as the position
of a spatial reach target. The reach target was displayed at one of four positions (up,
down, left, or right) equidistant from the hand cue. The subject did not make any
imagined movements during this target cue epoch. After a variable interval (1.25-1.75
seconds, randomly sampled from a uniform distribution) the fixation point changed color
instructing the subject to initiate an imagined reach to the cued target location. This
epoch lasted for 2 seconds and the subject was asked to maintain the final endpoint
location until the end of the epoch. For each possible unique combination of the fixation
and starting hand location, we presented all four target positions Thus, in total, there were
64 possible cue configurations (4 eye x 4 hand x 4 target positions). We performed two
runs, each lasting approximately 11 minutes, in which each cue configuration was once
with the order randomly determined. Our primary interest was in the pattern of neural
activity during the masked interval prior to target presentation. Thus, we had 8 repetitions
for each of the 16 hand and fixation locations.
We chose the center-out configuration of reach targets for several reasons. As shown in
position of the hand and target which is functionally equivalent to the direction of
movement from the starting hand position to the target. Given previous studies showing
that potential reach targets can be encoded in higher-order motor regions (Cisek and
Kalaska 2010), we chose the center surround arrangement to ensure that initial hand
position conveyed no information about potential reach direction and therefore implicit
planning signals would not be correlated with initial hand position. In contrast, in the
previous target arrangement, starting hand position was at least partially predictive of
target direction due to the constraints of the monitor (e.g. for the far left starting hand
position all movements were either upwards or to the right while for the far left hand
position all movements were upward or towards the right.) Further, the inline
arrangement is not optimal for a hand-target relative reference frame: the angular range
of directions is relatively small, only targets above the starting hand positions were
tested, the set of angles that are tested are hand position dependent (e.g. when the starting
position is to the right, all movements are either upward or directed to the left), and
direction is partially confounded with movement distance (e.g. when the hand is placed to
the far right, the target to the far left is over three times the distance as the target directly
above the hand.) Finally, the center-out arrangement also allowed us to compare coding
for the relative position of the hand and eye with the relative coding for the hand and
reach target (see below).
The spatial match-to-sample task was designed to be similar to the internal model task
with several key modifications. As in the internal model task, the trial began with the
presentation of a fixation cue and hand icon cue, each at one of four spatial locations. The
spatial locations of the fixation and hand icon cues were identical to the internal model
task. As in the internal model task, the subject was instructed to fixate the fixation cue;
however, in the spatial match-to-sample task, the subject was instructed to simply
remember the spatial location of the icon without any accompanying motor imagery. As
above, all possible combinations of four fixation and hand icon cues were tested for a
total of 16 possible configurations (4 eye x 4 hand), and as before the task epoch lasted
1.75 seconds. The dynamic mask was then presented for 2 seconds. Following the
dynamic mask the hand icon was presented for one second. For half the trials, the
position of the icon was presented at the same spatial location as originally cued while for
the other half of the trials, the position of the icon was moved from its original location to
one of the other three possible locations (randomly selected from a uniform distribution).
Finally, a response screen was presented and the subject verbally reported whether the
position of the hand icon was the same before and after the dynamic masking stimulus.
We collected eight repetitions of each unique hand and eye combination in a
pseudorandom fashion (with each hand eye position tested once prior to repetition.)
3.2.3
Behavioral Variable Tuning ANOVA
We performed a sliding-window 4x4x4 ANOVA to quantify the percent of the neural