www.wjpr.net Vol 4, Issue 1, 2015. 1520
IMPLEMENTATION OF QBD TO ANALYTICAL METHOD
DEVELOPMENT PROCESSES
Nayana Nanasaheb Narawade1*, Jyotsna Balasaheb Jadhav2, and Reshmavati Dhanrag Patil3
1*
Department of Pharmaceutical Chemistry, M.V.P.Samaj‟s College of Pharmacy, Near K.T.H.M. Campus, Gangapur road, Nashik-422002, Maharashtra, India.
2
Department of Quality Assurance Techniques, M.V.P.Samaj‟s College of Pharmacy, Near K.T.H.M. Campus, Gangapur Road, Nashik-422002, Maharashtra, India.
3
Department of pharmaceutics, M.V.P.Samaj‟s College of Pharmacy, Near K.T.H.M. Campus, Gangapur road, Nashik-422002, Maharashtra, India.
ABSTRACT
Recent pharmaceutical regulatory documents have stressed the critical importance of applying quality by design (QbD) principles for in-depth process understanding to ensure that product quality is built in by design. QbD tools, for example risk assessment and design of experiments, enable enhanced quality to be integrated into the analytical method, enabling earlier understanding and identification of variables affecting method performance. The different ways several authors have treated single QbD steps of method development are reviewed and compared. Since the adoption of the ICH Q8 document concerning the development of pharmaceutical processes following a Quality by Design (QbD) approach, there have been many discussions on the opportunity for analytical method developments to follow a similar approach. As per the FDA, implementing the Quality by Design (QbD) approach for the analysis of commercially available mixtures is hypothesized to enhance the pharmaceutical industry via facilitating the process of analytical method development and approval.
KEYWORDS- QbD, Design of Experiment, Design Space, Process Analytical Technology (PAT), Analytical Target Profile (ATP).
Volume 4, Issue 1, 1520-1535. Review Article ISSN 2277– 7105
Article Received on 08 Nov 2014,
Revised on 03 Nov 2014, Accepted on 28 Dec 2014
*Correspondence for Author Nayana Nanasaheb Narawade Department of Pharmaceutical Chemistry,
M.V.P. Samaj‟s College of
Pharmacy, Near K.T.H.M.
Campus, Gangapur road,
Nashik-422002,
www.wjpr.net Vol 4, Issue 1, 2015. 1521 INTRODUCTION
Recently, the US Food and Drug Administration introduced quality by design (QbD) as a fundamental pharmaceutical quality model to be considered in the development of pharmaceutical products and processes. QbD principles have also been supported by International Conference on Harmonisation (ICH) guidelines Q8(R2),[1] Q9,[2] and Q10.[4] ICHQ8(R2) on pharmaceutical development gives a basis for risk mitigation via the in-depth product and process understanding gained in pharmaceutical development, whereas ICHQ9 on quality risk management develops the principles and some of the tools of quality risk management for assessment, control, communication, and review of the risks of the quality of the medicinal product. ICH Q10 on pharmaceutical quality systems complements ICH Q8(R2) and ICHQ9 by establishing a model for a pharmaceutical quality-management system that would facilitate innovation and continuous improvement throughout the lifetime of the product.[4]
As per ICH Q8(R2) Quality by Design (QbD) is a systematic approach to development that begins with predefined objectives and emphasizes product and process understanding and process control, based on soundscience and quality risk management. A more systematic approach to development (also defined as quality by design) can include, for example, incorporation of prior knowledge, results of studies using design of experiments, use of quality risk management, and use of knowledge management throughout the lifecycle of the product. Such a systematic approach can enhance achieving the desired quality of the product and help the regulators to better understand a company‟s strategy. Product and process
www.wjpr.net Vol 4, Issue 1, 2015. 1522 Fig.1- Analytical method development in QbD.
Element of QbD in Analytical Method
1) Analytical Target Profile(ATP)
www.wjpr.net Vol 4, Issue 1, 2015. 1523 Fig.2- Experimental design for a three dimensional method optimization.
2) Quality Target Product Profile (QTPP)
QTPP is defined as a “prospective summary of the quality characteristics of a drug product
that ideally will be achieved to ensure the desired quality, taking into account safety and efficacy of the drug product”.[1]
Applying this definition to analytical methods means that, first, the separation objectives should be well defined.[8] Even if the objectives can vary, in general the target of the optimization is maximum selectivity with minimum run time, all within a known robust working region.[8] For an API this implies separation from the impurities while meeting methodperformance criteria based on regulatory requirements,[6] for example validation data as defined by the ICH.
3) Critical Quality Attribute (CQA)
CQA is a “physical, chemical, biological or microbiological property or characteristic that
should be within an appropriate limit, range, or distribution to ensure the desired product quality”. [1]
In analytical methods, CQAs are key response variables, so the chromatogram will be related to a mathematical representation of quality. CQAs can be classified into two major categories: “must have” and “intend to have”. For instance, resolution of a pair of adjacent peaks must be not less than 1.5, and is intended to be not less than 1.8.[6]
4) Critical Process Parameters (CPP)
www.wjpr.net Vol 4, Issue 1, 2015. 1524
observed. Hence, to define an analytical DS, a wisely selected number of factors, also called critical processparameter (CPP)-operating factors (e.g.gradient time in chromatography, and concentration of reagents in immunoassays) that impact on the analytical technique under development have to be studied simultaneously.Usually, the CPPs are obtained from a risk analysis and aprioritization strategy.[9]
Process capability index (CpK) = Upper limit of specification - Lower limit of specification 6 standard deviation
5) Risk Assessment
Risk assessment is a valuable science-based process used in quality risk management ( that can aid in identifying which material attributes and process parameters potentially have an effect on product CQAs.(Q8) As per ICHQ9 Risk Assessment is defined as a systematic process of organizing information to support a risk decision to be made within a risk management process. It consists of the identification of hazards and the analysis and evaluation of risks associated with exposure to those hazards.[2]
Risk assessment tools can be used to identify and rank parameters (e.g., process, equipment, input materials) with potential to have an impact on product quality, based on prior knowledge and initial experimental data.[1]
There are two risk assessment tools.
1. Failure Mode Effects Analysis (FMEA). 2. Ishikawa Diagrams (Fishbone diagrams).
A. Failure Mode Effects Analysis( FMEA)
In FMEA the variables are ranked on the basis of the likelihood failure will occur (probability), affect on the analytical results (severity), and difficulty of detection (detectability), resulting in a risk priority number (RPN). Factors with an RPN above a cut-off level can then be evaluated by subsequent studies whereas factors with alower RPN can be eliminated from further study.[6]
Risk Priority Number = Probability × Severity × Detectability.
“Fig. 3” illustrates the FMEA outcome for a process chromatography step in a biotech
www.wjpr.net Vol 4, Issue 1, 2015. 1525
include gradient slope, temperature, flow rate, product loading, end of pool collection, buffer A pH, start of pool collection, volume of wash 1, buffer B pH, buffer C pH and bed height.Process characterization focused on parameters such as temperature, that have a high impact on the process (severity = 6), occur frequently in the manufacturing plant (occurrence = 6) and are difficult to quickly correct if detected (detection = 7). In contrast, parameters such as equilibration volume, with a low impact on the process (severity = 3), low occurrence (occurrence = 2) and a limited ability to detect and correct (detection = 5), were not examined in process characterization.[10]
Fig.3-Pareto chart showing RPN scores for the operating parameters for a
chromatography step in a biotech process. Parameters that had RPN scores higher than
the cutoff (RPN = 50) were further examined in process characterization.
B. Ishikawa Diagrams(Fishbone diagrams)
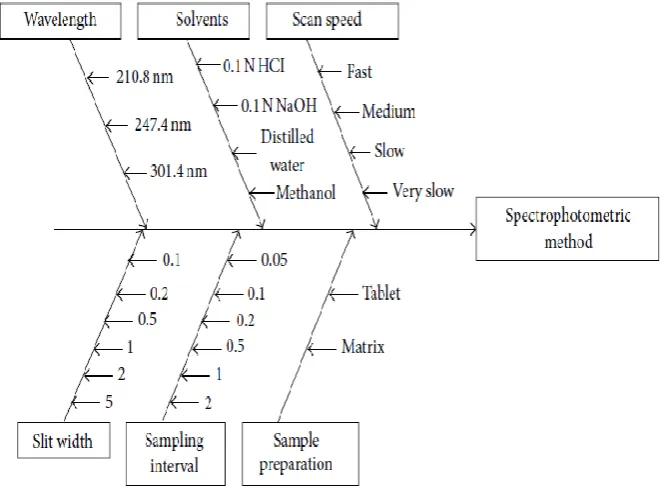
Ishikawa diagrams segregate risks into different categories, for example those associated with instrumentation, materials, methods, measurements, laboratory climate, and human factors. “Fig.4” explains the ishikawa diagram for HPTLC method development which separates risk
www.wjpr.net Vol 4, Issue 1, 2015. 1526 Fig.4- Ishikawa diagram for HPTLC method development.
6) Design Space
The multidimensional combination and interaction of input variables (e.g.material attributes) and process parameters that have been demonstrated to provide assurance of quality. Working within the design space is not considered as a change. Movement out of the design space is considered to be a change and would normally initiate a regulatory post approval change process. Design space is proposed by the applicant and is subject to regulatory assessment and approval.[8]
Fig. 5 Design Space.
[image:7.595.198.397.528.695.2]www.wjpr.net Vol 4, Issue 1, 2015. 1527
one fixed condition, but under a range of conditions.[12, 13] Changes within the DS are not regarded as changes of the method and need no further regulatory approval. It is possible to either “establish independent Design Spaces for one or more unit operations, or to establish a single Design Space that spans multiple operations”. This leads to the proposition by Monks
et al. that DS in chromatography could be regarded as two entities: one column design space (CDS) and one eluent design space (EDS). When a robust column with a known equivalent column was found, establishment of the DS of all the other factors was carried out on the selected column.[12]
In “Fig. 6” The working point is in the middle of the cube and represents a result of the best critical resolution. Three different resolution maps are shown here as individual parts of the whole Design Space.The shortcomings of an OFAT approach or of a 2D model are presented in “Fig. 6” where an edge of the cube presents an OFAT method and a plane inside is presenting a 2D model. In Fig. 6we can see three planes, each of them corresponding to a 2D resolution map.[8]
Fig.6 Presentation of the Design Space for three factors described by 2D planes.
7) Design of Experiment
www.wjpr.net Vol 4, Issue 1, 2015. 1528
experiments as low as possible. DoE can be split up into two main categories: screening designs and response-surface designs.[9]
a) Screening Designs
Screening designs estimate the effects of factors on selected responses. When too many factors (four or more) seem to affect the responses and have been revealed by the FMEA prioritization, these designs can be used to select those having the largest effects on the responses. The remaining significant factors will be studied in a subsequent DoE (e.g. method optimization).
In the screening designs, well known are the Plackett and Burman designs that study factors at two levels. In liquid chromatography (LC), Plackett and Burman designs are also used to estimate the robustness of an optimal separation. [9]
Fig. 7- Mean response surface for run-time with respect to pH and % acetonitrile
obtained from the central composite design applied to the hypothetical analytical
method example.
In “Fig. 7” the desired maximum run-time cannot exceed 20 min. Hatched region:
www.wjpr.net Vol 4, Issue 1, 2015. 1529 b) Response-Surface Designs
The second category of DoE corresponds to designs used to predict and to optimize the responses.[14,15] These DoEs are three-level, full factorial designs, central composite designs, and Box-Benkhen[16] and Doehlert designs.[17] D-optimal designs can also be selected in order to answer particular requirements (e.g. constraints on the levels of factors, or specific models).[18] It involves understanding the relationship between the factors to assess the behaviour of the response, and the effects on the response. These designs are used to find the combination of factors that predict the optimal response with good precision. More than two levels of each factor are usually required in order to fit quadratic or higher order terms {e.g., when pH is a factor in LC, it may be required to study pH up to the third-order term: pH+pH2+pH3}. Response-surface designs are key tools to define the DS of analytical methods. They study a large experimental domain, understanding the behaviour of the responses and the CQAs with respect tothe studied factors, and they provide a model to predict the value of the CQAs within the range of these levels of factors.
8) Control Strategy (CS)
A planned set of controls, derived from current product and process understanding that ensures process performance and product quality. The controls can include parameters and attributes related to drug substance and drug product materials and components, facility and equipment operating conditions, in-process controls, finished product specifications, and the associated methods and frequency of monitoring and control.[3]
www.wjpr.net Vol 4, Issue 1, 2015. 1530
because the two compounds involved were easily obtained. This case is particularly lucky; in general, the system suitability test may need to be augmented with additional controls to properly manage risk. In this sense, a more common strategy could be the definition of accepted ranges for all the critical resolution values. This can be achieved on the basis of the values measured during the system-repeatability study, because system precision provides valuable information about the variability of the analytical system.[19, 20, 21]
9) Product Lifecycle Management and Continual Improvement
Throughout the product lifecycle, companies have opportunities to evaluate innovative approaches to improve product quality.Process performance can be monitored to ensure that it is working as anticipated to deliver product quality attributes as predicted by the design space. This monitoring could include trend analysis of the manufacturing process as additional experience isgained during routine manufacture. For certain design spaces using mathematical models, periodic maintenance could be useful to ensure the model‟s performance. The model maintenance is an example of activity that can be managed within a company„s own internal quality system provided the design space is unchanged. Expansion,
reduction or redefinition of the design space could be desired upon gaining additional process knowledge. Change of design space is subject to regional requirements.[1]
Life cycle approach differs from that of the traditional approach of method development. It includes continuous improvement of method performance and the design space allow flexibility for Continuous improvement in analytical method can be done without prior regulatory approval because of design space made previously (Market al., 2010).[5]
10)Process Analytical Technology(PAT)
www.wjpr.net Vol 4, Issue 1, 2015. 1531
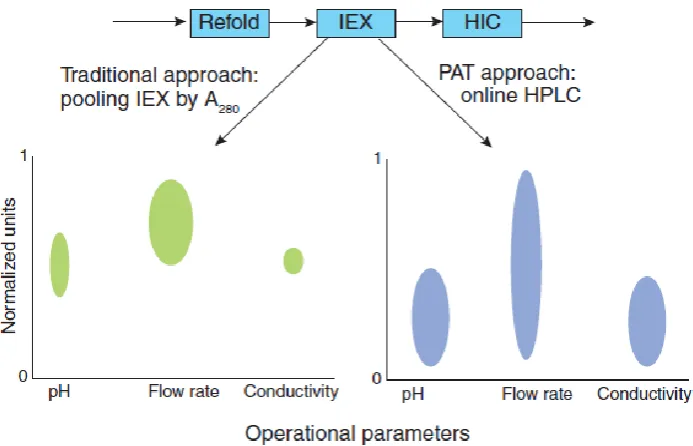
Besides the obvious usefulness of PAT in ensuring that the process operates within the approved process design space, PAT can also be useful for having a broad process design space.
“Fig. 8” explains case study involves an ion exchange (IEX) chromatography step that
removes an impurity (Impurity 1) from the product to levels below the drug substance Specifications. In the traditional approach, pooling of sucha column is performed by UV absorbance at 280 nm. The key advantage is the simplicity of implementing UV-based pooling criteria in a manufacturing environment. This approach works well for bind and elute applications where the whole peak is collected from baseline to baseline and the protein concentration is linearly correlated to the absorbance signal for the range under consideration. However, in the case of a high-resolution separation where a part of the peak is being collected to pool the product and remove one impurity or multiple impurities, this approach is not optimal because absorbance-based methods are not able to differentiate between product and other proteins or other species that have a similar absorbance profile. Thus, if the impurity levels in the feed material vary from lot to lot, poolpurity will also vary. This could result in lot rejection if the load material had a higher level of Impurity 1 than the IEX column is capable of clearing.
www.wjpr.net Vol 4, Issue 1, 2015. 1532 Fig. 8- Case study of PAT.
Table 1- Comparison of pool purity for feed material with different product quality for
a hydroxyapatite chromatography column.
Run % Load Purity % HA Pool Purity % HA Yield
1 2
65.5 71.3
93.0 93.2
60.4 65.0
[image:13.595.82.519.532.674.2]K.E. Monks et al applied Quality by Design (QbD) principles to the development of high pressure reversed phase liquid chromatography (HPLC) methods. They have evaluated four critical parameters in HPLC – gradient time, temperature, pH of the aqueous eluent and stationary phase within the Quality by Design framework by the means of computer modeling software, DryLab® 2010 and a column database, to a satisfactory degree. [12]
Fig. 9 - 3-D resolution spaces modelning gradient time, temperature and pH of eluent A
simultaneously for HALO C18 column (150 mm×4.6 mm, 2.7 _m), ACE C18
column(150 mm×4.6 mm, 3 _m) and HALO amide column (100 mm×4.6 mm, 2.7 _m),
www.wjpr.net Vol 4, Issue 1, 2015. 1533
In “fig. 9” The value of the critical resolution (Rs,crit) is represented as a color so that warm colors show large Rs,crit values and cold colors, low values. Specifically, red regions are above baseline resolution (Rs,crit> 1.5) and blue lines signalize peak overlaps(Rs,crit = 0).
CONCLUSION
An approach for applying Quality by Design principles to the Analytical method development process is presented in this article. In this paper, a QbD approach for analytical method development that consists of developing a full understanding of the intended purpose, developing predictive solutions, designing a meaningful system suitability solution that helps to identify failure modes, and following design of experiments approach to the method development has been presented.It is then of core importance to demonstrate that the level of quality required for the CQAs can be met with high probability. In particular, a control strategy of the analytical method will have to be defined in order to assure and to monitor its daily performance. Finally, the achievement of a DS is meaningless in itself if the DS is not completely included in a quality system that has a global risk-management plan.
REFERENCES
1. ICH Harmonised Tripartite Guideline. Pharmaceutical Development Q 8(R2) (2009) International Conference on Harmonisation of technical requirements for registration of pharmaceuticals for human use.
http://www.ich.org/fileadmin/Public_Web_Site/ICH_Products/Guidelines/Quality/Q8_R1 /Step4/Q8_R2_Guideline.pdf. Accessed 14 Jun 2012.
2. ICH Harmonised Tripartite Guideline. Quality Risk Management Q9 (2005) International Conference on Harmonisation of technical requirements for registration of pharmaceuticals for human use.
http://www.ich.org/fileadmin/Public_Web_Site/ICH_Products/Guidelines/Quality/Q9/Ste p4/Q9_Guideline.pdf. Accessed 14 Jun 2012.
3. ICH Harmonised Tripartite Guideline. Pharmaceutical Quality Systems Q10 (2008) International Conference on Harmonisationof technical requirements for registration of pharmaceuticals forhuman use.
http://www.ich.org/fileadmin/Public_Web_Site/ICH_Products/Guidelines/Quality/Q10/St ep4/Q10_Guideline.pdf. Accessed 14 Jun 2012.
www.wjpr.net Vol 4, Issue 1, 2015. 1534
5. Sangshetti JN, Deshpande M, Arote R, Zaheer Z, Shinde DB. (Quality by design approach: Regulatory need). Arebian J. Chem, 2014.
6. Vogt FG, Kord AS. (Development of Quality-By-Design Analytical Methods). J Pharm Sci, 2011; 100(3): 797-812.
7. Schmidt AH, Molnar I. (Using an innovative Quality-by-Design approach for development ofa stability indicating UHPLC method for ebastine in the API and pharmaceutical formulations). J. Pharm. Biomed. Anal, 2013: 65-74.
8. Molnar I, Rieger HJ, Monks KE. (Aspects of the “Design Space” in high pressure liquid chromatography methoddevelopment). J Chromatogr A, 2010; 1217: 3193–3200.
9. Rozet E, Lebrun P, Debrus B, Boulanger B, Hubert P. (Design Spaces for analyticalmethods). Trends Anal. Chem., 2013; 42: 157-167.
10.Anurag S Rathore& Helen Winkle. (Quality by design for biopharmaceuticals). Nat. Biotechnol., 2009; 27(1): 26-34.
11.Jadhav ML, Tambe SR. (Implementation of QbD Approach to the Analytical MethodDevelopment and Validation for the Estimation of PropafenoneHydrochloride in Tablet Dosage Form). Chromatography Research International, 2013.
12. Monks KE, Rieger HJ, Molnár I. (Expanding the term “Design Space” in high performance liquidchromatography (I)). J Pharm Biomed Anal, 2011; 56: 874– 879. 13.Huang J, Kaul G, Cai C, Chatlapalli R, Harnandez-Abad P, GhoshK, Nagi A. (Quality by
design case study: An integrated multivariate approach to drug product and process development). Int J Pharm, 2009; 382: 23–32.
14.Bezerraa MA, SantelliRE, Oliveira EP, VillarLS, Escaleira LA. (Response surface methodology (RSM) as a tool for optimization inanalytical chemistry). Talanta, 2008; 76: 965–977.
15.Ferreira SLC, Bruns RE, Silva EGP, Santos WNL, Quintella CM, David JM. (Statistical designs and response surface techniques for the optimization of chromatographic systems). J Chromatogr A, 2007; 1158: 2–14.
16.Box GEP, Behnken DW. (Some New Three Level Designs for the Study of Quantitative Variables). Technometrics, 1960; 2(4): 455-475.
17.Doehlert DH. (Uniform Shell Designs). Journal of the Royal Statistical Society, 1970; 19(3): 231-239.
www.wjpr.net Vol 4, Issue 1, 2015. 1535
19.Furlanetto S, Orlandini S, Giannini I, Beretta G, Pinzauti S (Pitfalls and success of experimental designin the development of a mixed MEKCmethod for the analysis of budesonide andits impurities). Electrophoresis, 2009; 30: 633–643.
20.Giannini I, Orlandini S, Gotti R, Pinzauti S, Furlanetto S (Cyclodextrin-MEEKC for the analysis of oxybutynin and its impurities). Talanta, 2009; 80: 781–788.
21.Orlandini S, Gotti R, Giannini I, Pasquini B, Furlanetto S (Development of a capillary electrophoresis method for the assay of ramipril and its impurities: An issue of cis–trans isomerization). J Chromatogr A, 2011; 1218: 2611–2617.
22.Gnoth S, Jenzsch M, Simutis R, Lübbert A. (Process Analytical Technology (PAT): Batch-to-batch reproducibility of fermentation processes by robust process operational design and control).J.Biotechnol, 2007; 132: 180–186.