Spatial Analysis of Distribution Patterns of Healthcare
Facilities in Osun State, Nigeria
Fadahunsi, J. T.
1,*, Kufoniyi, O.
2, Babatimehin, O. I.
11Department of Geography, Obafemi Awolowo University, Nigeria 2Department of Estate Management, Obafemi Awolowo University, Nigeria
Copyright©2017 by authors, all rights reserved. Authors agree that this article remains permanently open access under the terms of the Creative Commons Attribution License 4.0 International License
Abstract
The study examined the distribution patterns and developed a model for determining the optimum location of healthcare facilities in Osun State, Nigeria. These were with a view to improving the spatial distribution of and equitable access to healthcare facilities in the State. Primary and secondary data were used in the study. The primary data comprised the geographic coordinates of all the healthcare facilities in the State, while the secondary data included the list of all the healthcare facilities in the State. The cartographic model for determining the optimum location of healthcare facilities was developed. The data were analysed using percentage and Geographical Information System (GIS) analysis tools such as nearest neigbour ratio (NNR), buffering, overlay and query. The study identified 919 healthcare facilities of four categories, namely, primary (603, 65.6%), private (262, 28.5%), secondary (51, 5.6%) and tertiary (3, 0.3%) in the State. Primary and private healthcare facilities depicted clustered patterns of distribution; while secondary and tertiary depicted random distribution patterns. Using the secondary healthcare facilities as a case study, the developed cartographic method revealed both the optimum number and locations of additional facilities required, at 10km buffer distance to meet the set standards. The study identified that additional seven secondary healthcare facilities are required in four of the 30 LGAs of the State. The model also holds for primary, private and tertiary healthcare facilities by simply varying the buffer distance at 5km, 5km and 20km respectively. The study concluded that there were inequalities in the spatial distribution of healthcare facilities in the study area.Keywords
Healthcare Facilities, Distribution Patterns, GIS, Osun State, Cartographic Model1. Introduction
Access to healthcare services is essential for the well-being of humans. Studies have shown that the location of healthcare facilities do not always correspond to the
needs of the population in most States of Nigeria. This has resulted in poor healthcare delivery. Overt attention has also not been given to the need for equitable distribution of these facilities which are germane to good healthcare delivery Njoku and Akpan [1]; Ahmed and Mohamad [2]; Ayoade [3]; Fadahunsi [4].
In Osun state of Nigeria, explicit consideration has not been given to the need for equity in the distribution of the healthcare facilities. This has led to the emergence of many settlements within the State where healthcare facilities are sparsely provided Ogunjumo [5]; Iyalomhe and Iyalomhe [6]. Attempt to address such inequity in the distribution of these healthcare facilities may require the use of information management tool such as the Geographic Information System (GIS). As a result, this study examined distribution patterns of healthcare facilities in Osun State, Nigeria using GIS technique, with a view to improving the spatial distribution of and equitable access to healthcare facilities in the State. This is important because the health status of residents has implications on their productivity and the development of the State.
Contextual Framework
The theory used in this study is the central place theory. The theory was articulated by Christaller [7] to show the relationship between the presence of a service and the population needed to support it, the size of the hinterland within which such a population was contained and the size and the central place itself.
travel in order to enjoy a given service refers to the market area for the goods or the distance traveled to obtain a good or service which is dependent on price, transportation cost, necessity of goods and preferences Aigbe [8].
Christaller’s concepts of threshold and range and the ordering principle largely explain the ordering of healthcare facilities in Nigeria Gbakeji [9]. At the primary level, the Primary Health Care (PHC) centres exist, the Comprehensive Health Center, General and State hospitals are at the secondary level while the Teaching Hospitals are at the tertiary level. The hierarchical order is largely a product of the interacting influence of threshold and range principles, determined by the nature of service rendered Onokerhoraye [10]. Clearly, the central place theory provides an appropriate theoretical background for the understanding of the spatial configuration of healthcare
facilities in Osun State.
The Study Area
Osun State was carved out of Oyo State on August 27, 1991. Its capital is Osogbo. It is located in South West of Nigeria. Osun State is landlocked and occupies a land mass of approximately 14,875 square kilometers. It lies between Latitudes 060 55′ N and 080 07′ N; and Longitudes 040 06′ E and 050 05′ E. Ondo and Ekiti States bound Osun State on the East, on the West by Oyo State, on the North by Kwara State and to the South by Ogun State (see Figure 1). The state is currently made up of 30 Local Government Areas (LGAs) and has estimated population of 3,763,074 in 2014 Osun State Hospitals Management Board [11].
[image:2.595.128.470.279.735.2](Source: Osun State Government, 2013)
Data Sources
Primary and secondary data were used in the study. The primary data were the geographic coordinates of all the healthcare facilities in the State obtained using Global Positioning System (GPS) receiver. The secondary data comprised the list of all the healthcare facilities in the state, collected from the Osun State Hospitals’ Management Board and Orthophotomaps (scale 1: 2,000) covering the state, collected from the Office of the State Surveyor-General. Roads, rivers, railway line, LGA boundaries and settlements were extracted from the Orthophotomaps.
2. Data Analysis and Results
Distribution Pattern of Healthcare Facilities
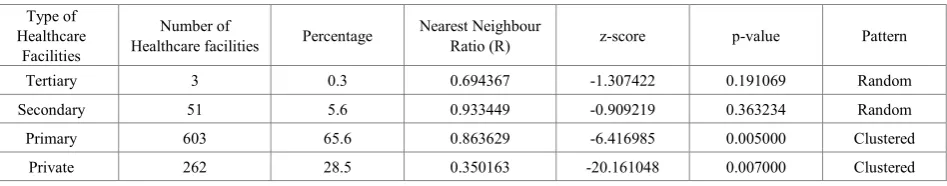
The distribution patterns of existing healthcare facilities in the state were examined using percentage and nearest neigbour ratio (NNR) analysis tool of ArcGIS. A summary of the distribution of healthcare facilities in Osun State is provided in Table1. The table shows that at the time of this study, there were 919 healthcare facilities in the State; these include three (0.3%) tertiary healthcare facilities, 51 (5.6%) secondary healthcare facilities 603 (65.6%) primary healthcare facilities and 262 (28.5%) private healthcare facilities.
It should be noted that the values of nearest neighbour analysis, R, range between two theoretical extremes, 0 and 2.1491. The more closely the points are clustered together, the closer the value of R close to 0, the closer R gets to 1,
the more randomly spaced the points are, and the closer the value of R to 2.1491, the more uniformly spaced the data are.
In analyzing the pattern of distribution patterns of existing healthcare facilities in the State, nearest neighbour ratio tool within ArcGIS 10.2 was used. Using tertiary healthcare facilities as example, the nearest neighbour ratio of 0.69 is less than 1 which indicates that the distributional pattern of facilities is random though with emerging signs of a tendency towards a regular distribution. The z-score of -1.31 falls between -1.96 to +1.96 as a result the p-value of 0.19 (i.e. +0.19 standard deviations away from the mean) is larger than the 0.05 critical level, hence the pattern is random. Similarly, the pattern for secondary is random while that of primary and private healthcare are cluster (Table 1 and Figure 2a).
[image:3.595.65.539.485.578.2]In summary, the results of the Nearest Neighbour Ratio (NNR) for tertiary, secondary, primary and private healthcare facilities are given in figures 2a, 2b, 3a and 3b respectively. It indicates that primary (R = 0.86, z = -0.62, p = 0.01) and private (R = 0.35, z = -0.62, p = 0.01) healthcare facilities depicted clustered patterns of distribution; while secondary (R = 0.93, z = -0.91, p = 0.36) and tertiary (R = 0.69, z = -1.31, p = 0.19) healthcare facilities depicted random distribution patterns. The identified spatial pattern in this analysis indicated disorderly and inefficient distribution of healthcare services in the State. This can lead to high infant and maternal mortality, spread of diseases, self-medication and patronizing of quackery.
Table 1. Summary of the distribution of healthcare facilities in Osun State
Type of Healthcare
Facilities
Number of
Healthcare facilities Percentage Nearest Neighbour Ratio (R) z-score p-value Pattern
Tertiary 3 0.3 0.694367 -1.307422 0.191069 Random
Secondary 51 5.6 0.933449 -0.909219 0.363234 Random
Primary 603 65.6 0.863629 -6.416985 0.005000 Clustered
Private 262 28.5 0.350163 -20.161048 0.007000 Clustered
a
[image:4.595.139.459.66.724.2]b
a
[image:5.595.139.454.78.722.2]b
Determination of Model for Optimum Location of Healthcare Facilities
Cartographic model was developed for the optimal locations of healthcare facilities in the study area using secondary healthcare facilities as a case study. The constraints and criteria for selecting a proposed site for a secondary healthcare facility as adopted by Obateru [12], Abbas et. al. [13], and Osun State Government [14] were employed for this study. The summary of the constraints and criteria are as follows:
i. The minimum distance between two secondary healthcare facilities should be 500m and maximum distance of 10km.
ii. A healthcare facility should be within 5km of residential area.
iii. A healthcare facility should be more than 45m offset from a major road.
iv. A healthcare facility should be more than 45m offset from a railway line.
v. A healthcare facility should be more than 45m from a major river.
Procedure for Identification of Optimum Site for Secondary Healthcare Facilities
The cartographic model developed for the location of new secondary healthcare facilities is shown in Figure 4 using constraints (i)-(v) above. All these constraints and criteria were considered, examined and analysed one after the other to locate suitable sites and finally a most suitable site for the secondary healthcare facilities. The basic GIS analyses functions employed include buffering, overlay and querying operations.
The following steps were undertaken to implement the model for the identification of suitable location of the secondary healthcare facilities in the study area as indicated in the model using ArcGIS software,
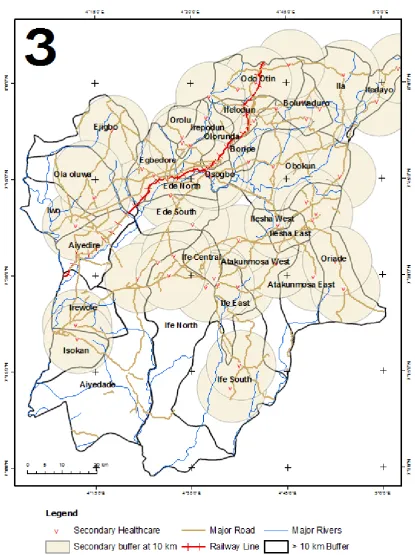
Step 1: From GIS database, a digital map was generated showing the existing locations of the secondary healthcare facilities, major roads, major rivers, railway lines and towns in the study area (see Figure 5).
Step 2: Buffer of 500m and 10km were drawn around the existing secondary healthcare facilities by buffer tool of the ArcGIS software. Similarly, using the same procedure, buffers of 45m each were drawn from the locations of existing major roads, major rivers and railway line. Also, a buffer of radius 5km was drawn round all the towns (see Figure 6).
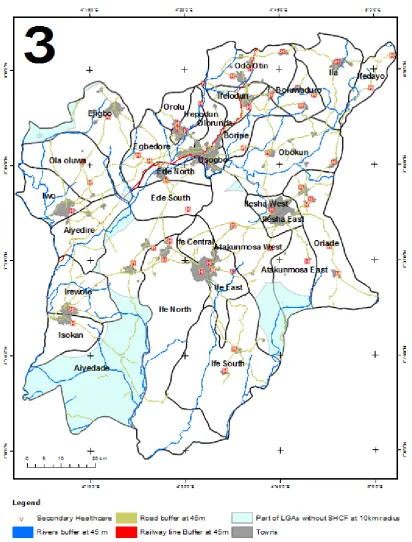
Step 3: The buffers of the existing secondary healthcare facilities were erased using erase tool of ArcGIS leaving LGAs without secondary healthcare facilities (see Figure 7).
Step 4: Layers of existing secondary healthcare facilities, towns, all LGAs (areas) without secondary healthcare facilities; and buffered roads, rivers and railway line were overlaid. The result of the operation is shown in Figure 8.
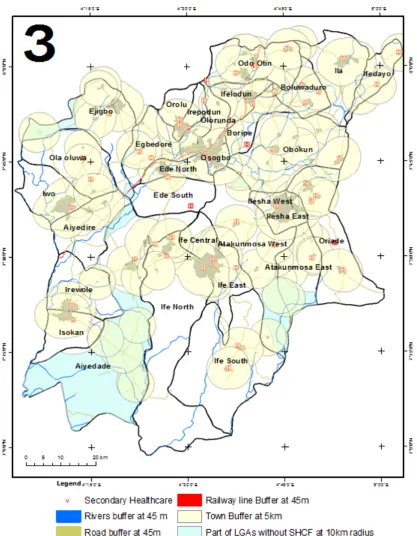
Step 5: Layers of existing secondary healthcare facilities, towns, all LGAs (areas) without secondary healthcare facilities; and buffered roads, rivers railway line and towns were overlaid. The result of the operation is shown in Figure 9.
The developed cartographic model revealed both the optimum number and locations of additional secondary healthcare facilities required at 10km buffer distance to meet the set standards. Thus, additional seven secondary healthcare facilities are required at Ife-Odan in Ejigbo LGA; at Odeyinka, Orile-Owu, Oloyin and Ajegunle in Ayedade LGA; at Oke-Ibode in Atakumosa West LGA and at Faforiji in Atakumosa East LGA. The model also holds for primary, private and tertiary healthcare facilities by simply varying the buffer distance at 5km, 5km and 20km respectively.
3. Conclusions
The study reveals that there were 919 healthcare facilities in the State; these include three (0.3%) tertiary healthcare facilities, 51 (5.6%) secondary healthcare facilities 603 (65.6%) primary healthcare facilities and 262 (28.5%) private healthcare facilities. Primary and private healthcare facilities depicted a clustered pattern of distribution while secondary and tertiary healthcare facilities depicted random distributional patterns.
After a number of analyses involving such GIS analytical tools as buffering, overlay and query, it was discovered that seven additional secondary healthcare facilities were required. This study has also effectively showcased the capability of GIS as a veritable tool for decision support system for examining the spatial distribution and site selection of new healthcare facilities.
REFERENCES
[1] Njoku, E, and Akpan, P. E., 2011. Locational Efficiency of Healthcare Facilities in IkotEkpene Local Government of Akwa-Ibom State: The Role of Geographical Information System (GIS). Journal of Educational and Social Research, 3(9), pp. 93-98.
[2] Ahmed, A. and Mohamad, A., 2013. GIS for Health Services,
Journal of Engineering Sciences, Assiut University, Faculty
of Engineering, 41(3), pp. 12-23.
[3] Ayoade, M. A., 2014. Spatial Accessibility to Public Maternal Health care facilities in Ibadan,
Nigeria.International Journal of Social Sciences, 26(1), pp. 13-28.
[4] Fadahunsi, J. T., 2016. Spatial Analysis of Accessibility and Utilisation of Healthcare Facilities in Osun State, Nigeria, unpublished PhD Thesis in Geography submitted to the Department of Geography, ObafemiAwolowo University, Ile-Ife, Nigeria.
[5] Ogunjumo, A. Omisore, O. and Amusan, A., 2005.Bivariate Analysis of Factors of Location of Public Health care Facilities. Journal of the Nigerian Institute of Town
Planning, 28(1), pp. 105-118.
[6] Iyalomhe, G. B. S. and Iyalomhe, S. I., 2012. Health-Seeking Behavior of Rural Dwellers in Southern Nigeria: Implications for Healthcare Professionals.
International Journal of Tropical Disease and Health, 2(2),
pp. 62-67.
[7] Christaller, W. 1966. (Translated by Baskin, C. W) The
Central Places of Southern Germany, Englewood Cliffs, N.
J. Prentice Hall.
[8] Aigbe, G. O. 2010. Utilization of Maternal and Child Healthcare Facilities in Lagos State, Nigeria. Ife Research
Publications in Geography, 9(1), pp. 208-220.
[9] Gbakeji, J. O. 2014. Location Theory and Public Facilities: A Case Study of Health-Care Facilities in Ughelli-South Local Government Area of Delta State, Nigeria, Civil and
Environmental Research (6)6, pp.92-97.
[10] Onokerhoraye, A. G.(1999. Access and Utilization of Modern Health Care Facilities in the Petroleum-producing Region of Nigeria: The Case of Bayelsa State Takemi Program in International Health Harvard School of Public Health, 665 Huntington Avenue Boston.
[11] Osun State Hospitals Management Board, 2014 Monthly Report of Patients Torn-over Deliveries and Deaths in all the Health Facilities of Osun State Hospitals for the month of March, 2014, Osogbo
[12] Obateru, O. I., 1986. Land Subdivision Guide, Ibadan: Evans Brothers (Nigeria Publishers) Limited.
[13] Abbas, I. I., Auta, S. Z. and Na’iya, R. M., 2012. Health Care Facilities Mapping and Database Creation Using GIS in Chikun Local Government, Kaduna State, Nigeria. Global Journal of Human Social Science Geography and
Environmental GeoSciences, 12(1), pp. 10-18.
[14] Osun State Government, 2013. Official Diary of Osun State
of 2013, Osogbo: Osun State Ministry of Information and