Bibliometrics: Help or Hoax for Quality?
F. Galetto
Department of Management and Production Engineering, Corso Duca degli Abruzzi, 24, 10129 TURIN , Italy *Corresponding Author: [email protected]
Copyright © 2014 Horizon Research Publishing All rights reserved.
Abstract
Higher Education Institutions should provide students good teaching with good professors who have good knowledge of the matter they are teaching. Unfortunately, many times, the opposite happens: career leaps depend on “bibliometric indexes” (Impact Points, h-index, s-index, RG-index, s-index...).Until today, incompetent lecturers teach wrong ideas because they do not know Probability Theory and Reliability Theory. There is a must: professors must use the Scientific Approach when they teach, they must know what scientificness entails. Cases of incompetent teaching are presented: the Bass model, invented by Bass in 1969, is used here to show how Bass itself made errors in the first time, and later, many professors copied, with irrational attitude, his ideas and diffused them to much more many students, all over the world. The same is for the fuzzy theory applied to Quality, for inventory management, for six sigma.Keywords
Success-Index, Bass Model, Fuzzy Logic, Linguistic Variables, Inventory Management, Six Sigma, Reliability, Quality, Scientific Approach1. Introduction
Higher Education is seen many times as a Production System, and students are considered as its “Customers”. Books and magazines are suggested to students, attending “Quality Courses” at Universities. Some of them are good some are not so good. Students use papers from magazines for their teaching; some papers have good Quality some are not very good. Therefore it seems important to stand-back a bit and meditate, starting from a managerial point of view.
In order to “measure” Quality (?) various bibliometric indices (e.g., h-index, s-index, Impact Points, RG-index, citations, …) have been devised, based on informetric models. Research Quality (?) in many universities is based on these indexes: if you are cited many times you are a better professor than if you are not!That’s the harsh reality…
Let’s imagine that in one university there is a Quality Engineering Group (QEG, comprising four lecturers, all graduated CUM LAUDE, and teaching "Quality matters"; they are also in the ResearchGate with high Impact Points and RG-index!). Until today, incompetent lecturers teach
wrong ideas because they do not know Probability Theory and Reliability Theory.Any rational person shall expect that those people will teach good ideas and will write “Quality papers on Quality matters”. Do those people act correctly or wrongly? We will see it.
There is a must: professors must use the Scientific Approach when they teach, they must know what scientificness entails.
Therefore it seems important to stand-back a bit and meditate, starting from a managerial point of view. The author cannot solve this huge problem: the Universities Managment MUST solve it; the author can only use very fewcases of incompetent teaching: the Bass model, invented by Bass in 1969, to show how Bass itself made errors in the first time, and later, many professors copied, with irrational attitude, his ideas and diffused them to much more many students, all over the world. The same is for the fuzzy theory applied to Quality, for inventory management, for six sigma. The basic theories needed to understand are Probability, Reliability and Mathematics: nothing more is necessary. 1.1. Some Preliminary Ideas
They are very important, in the authors' opinion. If the redear wants to skip them he can do, at his own risk.
In order to show how those teachers failed to attain the university goal (i.e. to prepare students for the future,), the paper will use an application of the so called Six Sigma approach, in an automotive setting: a company [not Italian] making disc brakes needed important improvement and blinded by consultants decided to apply Six Sigma because (as they say) " solve every quality problem, allowing big savings for companies that use it".
One student to be graduated by a Turin university was appointed head of a team of five engineers and F. Galetto a "neutral observer" [actually he tried to let them work scientifically, BUT he did not succeed: they were deaf to any scientific influence, as we shall see]; the student attended the Quality Engineering Course [during his M. Sc. studies]: the lessons were provided by professors members of the “Quality Engineering Group (QEG)” (all graduated CUM LAUDE).
(see the following figures).
We will use, as well, ideas of papers written by the QEG, and leave the reader to judge scientifically their contribution to Quality.
We provide here definitions found in books:
In the Six Sigma application they say that " solve every quality problem, allowing big savings for companies that use it". Notice: processes, … tools, … problem-solving, … new product development, … statistical methods, …, scientific method,… We shall see IF it is true. We first will analyse the scientificness, in the next section.
became popular due to J. Welch (CEO of General Electric) who reported big saving in 1998!The DMAIC [Define-Measure-Analyse-Improve-Control] methodology is absolutely ineffective during product development of products and/or processes; it’s sometimes useful for process improvement (see the real case).For product development of products and/or processes the DFSS [Design For Six Sigma] methodology is called; Taguchi fans search for “Robust Design”. I met many of them: nobody knew anything about Reliability!!!! (a very important dimension of Quality).ASI [American Supplier Institute] for DFSS propose five steps: Identify (project), Define (requirements), Develop (concept), Optimize (design), Verify (and launch), using TM [Taguchi Methods]. They claim that the new products are “better, faster and cheaper, with more reliability, lower warranty costs, higher market share”, measuring everything with the SN ratio! I met many of them: nobody knew anything about Reliability, and Preventive Maintenance!!!!
See the stupid ideas of Montgomery! Compare this with FAUSTA VIA (see later)… and think!
Others points are related to s-index, Fuzzy Theory and Control Charts, Inventory Management, ….
In order to show how teaching fails to attain his goal (i.e. to prepare students for the future), the paper will use also a very spread model in Universities, the BASS Diffusion Model. At Turin Politecnico, at least seven lecturers teach this model, saying something like [we use "italic letters" for "reported sentences"]"The Bass model is a very useful tool for forecasting the adoption (first purchase) of an innovation (more generally, a new product)…A key feature of the model
is that it embeds a <<contagion process>> between those who have adopted the innovation and those who have not yet adopted it." The ideas [according to the Bass's Basement Research Institute] were given to P. Frevert, in Bass office, "The probability of adopting by those who have not yet adopted is a linear function of those who had previously adopted." He wrote down the mathematical expression of this idea in the form f(t)/[1-F(t)]=p+qF(t). He later, in 1969, published the paper [1] who has been one of the most cited papers, since then! In [1] that probability f(t)/[1-F(t)]=p+qF(t) is named “likelihood” (why?).
At Turin Politecnico, in [2], you find "The Bass model is a centrepiece in the literature on new products…." and "The Bass model is a classic tool for the analysis of new products introduction from the marketing field…." and in some courses "The Bass model can be interpreted as a survival model (in the state of non-adopters) and is defined by a hazard function λ(t), which is the probability of adopting the product in (t, t+dt), under the condition of not having adopted up to t; if f(t) is the probability density function of the random variable “time to adoption” and F(t) the distribution function, λ(t)=p+qF(t), p=probability of innovative adoption, q=probability of imitative adoption." In [2], as well, (with other errors) one finds "…basically there are two probabilities of adoption and the second one q ...; p+q is the probability of adoption of the last customer."
Using Reliability Theory, the author will show that the previous divulgers do not know Probability Theory and provide their students wrong ideas; however, if their students would use their intelligence they could understand they got wrong ideas.
[image:2.595.340.518.487.624.2]Is there any Quality in wrong teaching? Teaching must be scientific for future managers. Deming says (figure 1):
Figure 1. Deming ideas
Based on an idea by Kosmulski, who (2011) proposed to classify a paper as “successful” when receiving more citations than those made, the QEG (inAn informetric model for the success-index appeared on Scientometrics, 2012) proposed to classify a publication as “successful” when it receives more citations than a specific comparison term (CT). We will see how wrong it is.
Let's now consider the method for Control Charts for Service, as given in the papers "On line Service Quality
De
mi
ng
De
m
Control: the Qualitometro Method", (1998) Quality Engineering, 633-643, "Control Charts for linguistic variables: a method based on the use of linguistic quantifiers", (1998) International Journal Of Production Research, n° 16 99, 3791-3801, "Service Qualimetrics: the Qualitometro II Method", (99-2000) Quality Engineering, 13-20.
To understand F. Galetto findings it is important to provide immediately the ideas of the QEG [in the above papers]. Three excerpts of their papers are given.
1st Excerpt from the paper "On line Service Quality Control: the Qualitometro Method", Quality Engineering.
«Another delicate question is the numerical coding for judgements expressed on interview questionnaires. … During data elaboration, scales are converted into numerical interval scales, and symbols are interpreted as numbers. … The scalarization of collected data presents two main problems. The first is in introducing through coding an arbitrary metric, resulting in a wrong interpretation of gathered data; the second is a hidden assumption for an identical scale "interpretation" by any interviewed individual and a rigidity of this scale in time, especially for periodic service users. Scalarization may generate "distortion" effect, modifying the collected data partially or completely. … In other words, the original information, "arbitrarily" enriched or directed to simpler aggregation and elaboration, may be highly modified if compared with the one really expressed by customers, with intuitable consequences.»
2nd Excerpt from "Control Charts for linguistic variables: a method based on the use of linguistic quantifiers", IJOPR.
«Ordered linguistic scales mainly differ from numeric or ratio scales because the concept of distance is not defined. The ordering is the main property attributed to such scales. For example, on a production line for fine liqueurs, a visual control of the corking and closing process might have the following possibilities: (a) 'reject', (b) 'poor quality', (c) 'medium quality', (d) 'good quality', (e) 'excellent quality'. The monitoring of production, using sampling control technique, is aimed at recognizing and, possibly, correcting unfavourable trends and out-of-control conditions. In order to do this the five classifications listed above could be attributed to some numerical values, leading to the construction, for example, of standard X-R charts. Although the numerical conversion of the verbal information simplifies subsequent analysis, it also gives rise to two problems. The first is concerned with the validity of encoding a discrete verbal scale into a numerical form. This approach introduces properties that were not present in the original linguistic scale (for example, is it legitimate to assume that the difference between the 'reject' state and the 'poor quality' state is the same as that between the 'medium' and 'high quality'?) [notice:'high quality' does not exist (in the "possibilities"!] Moreover, unlike scales used for physical measurements, ordered linguistic scales do not have either metrological reference standard or a measurement unit (QEG, 1995a, 1998). The second problem is related to the
absence of consistent criteria for the selection of the type of numerical conversion. It is obvious that changing the type of numerical encoding may determine a change in the obtained results. Introducing arbitrary weight for quality categories may condition substantially the way of interpreting the process evolution. For example, if we assign to each quality level for a five level scale, the series of numbers: 1, 2, 3, 4, 5, or the series: -9, -3, 0, 3, 9, we obtain two different results. In this sense the analyst of the problem does directly influence the acceptance of results. Consequently, by attributing numbers to verbal information we might effectively [sic] move away from the original logic of the evaluator. In this way any conclusion drawn from the analysis on 'equivalent' numerical data could be partially or wholly distorted. The problems highlighted above can be alleviated if we resort to analysis tools able to avoid the arbitrary conversion of information. … The fuzzy operator that is used in the paper allows for this flexibility in the decision logic.»
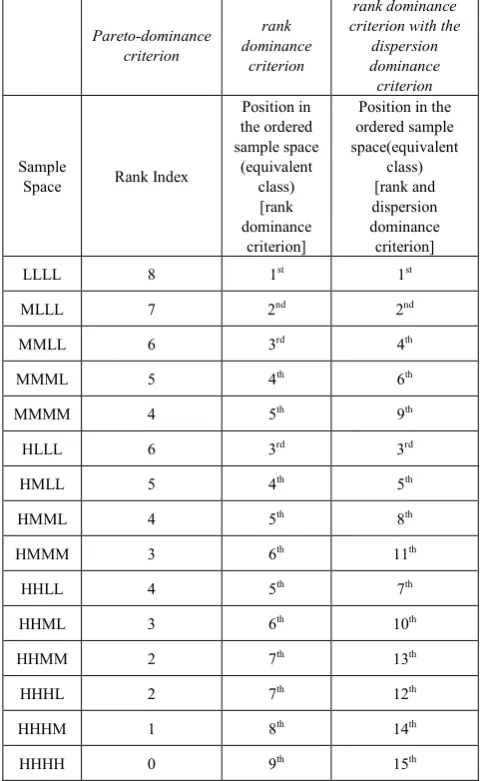
The "new" ideas of the QEG are in the paper "Ordered Samples Control Charts for Ordinal Variables" published in Quality and Reliability Engineering International [named by my students "the Qualitometro III Method"].The new three "tenors", of the QEG, say «The paper presents a new method for statistical process control when ordinal variables are involved. This is the case of a quality characteristic evaluated by on ordinal scale. The method allows a statistical analysis without exploiting an arbitrary numerical conversion of scale levels and without using the traditional sample synthesis operators (sample mean and variance). It consist of different approach based on the use of a new sample scale obtained by ordering the original variable sample space according to some specific ‘dominance criteria’ fixed on the basis of the monitored process characteristics. Samples are directly reported on the chart and no distributional shape is assumed for the population (universe) of evaluations”.»
concerned with the validity of encoding a discrete verbal scale into a numerical form. The numerical codification implies fixing the distances among scales levels, thus converting the ordinal scale into a cardinal one; the second is related to the absence of consistent criteria for the selection of the type of numerical conversion. It is obvious that changing the numerical encoding may determine a change in the obtained results. In this way the analyst directly influences the acceptance of results. Therefore, any conclusions drawn from the analysis on ‘equivalent’ numerical data could be partially or wholly distorted»(as in Qualitometro I and in Qualitometro II).
Also books, used in universities, have the same problems. We consider now the case of inventories, as given in Brandimarte, P., Zotteri G. (2006) Introduction to Distribution Logistics, STATISTICS IN PRACTICE, Wiley Interscience and Hopp W., J., Spearman M., L.,Factory Physics (2nd ed.), McGraw-Hill Higher Education.
This can be related to "preventive replacement before out-of-stock".
Inventories are stockpiles of raw material, supplies, components, work in progress and finished goods that appear at numerous points throughout a firm's production and logistic channel.
Having these inventories on hand cost at least 20% of their value per year.Therefore, carefully managing inventory levels makes good economic sense, because in recent years the holding of inventories has been roundly criticised as unnecessary end wasteful. Actually good management of inventories improve customer service and reduce costs.
To show F. Galetto ideas we consider here "stockout", or "type I Service" model, as I found it in books and papers (more details on the probabilistic behaviour are given later). The costs involved are:
Aλ/Q, the "average" order cost per year
/Q p ) ( F
-(1 LT R
λ
, the cost of stockout [p is the cost perstockout, in euro] FLT(R) is the CD of demand during the lead time LT
LT) -Q/2
h(R+
λ
, "average" inventory cost per year being λ the rate of demand.Therefore "If stockouts are permitted and lead time is LT > 0, if demand is random, the formula to be minimised is the
rate cost
average =
/Q p )) ( F -(1 LT) -Q/2 h(R /Q
Aλ + + λ + LT R λ
= (where R is the
trigger quantity for launching the order Q, p is the penalty for stockouts and FLT(d) is the probability distribution of the demand d, during the lead time LT". Actually the formula is inconsistent, because it is based on an intuitive [not proved] extension of the formula for <<"constant" demand, no stockouts permitted and lead time zero>>.Notice that this formula is the same as that in case of "everything known" and constant!
No scientific proof of the formula is ever provided! Understanding that the formula is wrong is very easy. [1- FLT(R)] is the probability that the demanded quantity XLT, for the lead time LT, is larger than R: P[XLT>R]. That
does not take into account that stockout occurs only if the replenishment order arrives LATE, later than all R units are sold! The probability of stockout depends on the competition of two stochastic processes: the demand versus the replenishment.Actually Aλ/Q+h(R+Q/2-λLT)+(1-FLT(R))pλ/Q
is an inconsistentformula.
We provide the basic ideas of Reliability Theory [13], [14], useful for the Bass model analysis and other methods (e.g. inventory, …).
Let T be the random variable “Time to failure” of an item, and 0__t, the mission interval, whose duration is t. The reliability R(t) is the probability that no failure happens in the mission, f(t) being the pdf,
∫
∞ = − = > =t f xdx
t F t T P t
R( ) [ ] 1 () ( ) (1)
The mean of the r.v. is the Mean Time To Failure
∫
∫
∞ = ∞= =
0
0 ( ) ()
]
[T xf xdx R t dt
E
MTTF (2)
The failure rate, as any good student knows, is neither a (conditional) probability density nor a (conditional) probability; it is the ratio
) ( / ) ( )
(t f t R t
h = (3)
Hence it is easily derived that
] ) ( exp[ ) (
0
∫
−= th xdx
t
R (4)
When the failure rate is constant, failures are distributed “in the most random manner”: the conditional reliability does not depend on past life.
It is easily seen that the knowledge of the failure rate h(t) is enough to obtain any reliability characteristic [R(t), MTTF, MTTF(t), F(t), f(t)].
The Mean Time To Failure, related to the interval 0__t, is
∫
= tR x dx t
MTTF
0 ( ) )
( (5)
In section 2, we provide some ideas on scientificness.
1.2. “Scientificness”
We provide the reader some ideas on the need of the scientific attitude that all the teachers must have [3].
incompetents he met since then grew dramatically (also with documents. F. Galetto got from ERASMUS students (Fijiu Antony et al., 2001, Sarin S. 1997).
2nd Premise: "The wealth of nations depends increasingly on the quality of managers." (A. Jay [4]) and “Universities grow future managers.” (F. Galetto)
Entailment: due to that, the author with will try, again, to send the important consequent message: let us, all of us, be scientific in all Universities, that is, let us all use our rationality. "What I want to teach is: to pass from a hidden non-sense to a non-sense clear." (L. Wittgenstein). End
"In my university studies …, in most of the cases, it seemed that students were asked simply to regurgitate at the exams what they had swallowed during the courses." M. Gell-Mann “The Quark and the Jaguar...” [1994])}. Some of those students later could have become researchers and then professors, writing “scientific” papers and books … For these last, another statement of the Nobel Prize M. Gell-Mann is relevant: "Once that such a misunderstanding has taken place in the publication, it tends to become perpetual, because the various authors simply copy one each other."....>>, similar to "Imitatores, servum pecus" [Horatius, 18 B.C.] and "Gravior et validior est decem virorum bonorum sententia quam totius multitudinis imperitiae" [Cicero]. When they teach, "The result is that hundreds of people ... " [Deming (1986), fig. 1], because those professors are unable to practice maieutics [µαιευτικητεχνη], the way used by Socrates for teaching [the same was for Galileo Galilei in his"Dialogue on the Two Chief World Systems"]. Paraphrasing P. B. Crosby, in his book "Quality is free", we could say"Professors may or may not realize what has to be done to achieve quality. Or worse, they may feel, mistakenly, that they do understand what has to be done. Those types can cause the most harm." What do have in common Crosby, Deming and Gell-Mann statements? The fact that professors and students betray an important characteristic of human beings: rationality [the “Adult state” of E. Berne (see fig. 2)]. Human beings are driven by curiosity that demands that we ask questions (“why?. …, why?”) and we try to put things in order (“this is connected with that”): curiosity is one of the best ways to learn, but “learning does not mean understanding”; only twenty-six centuries ago, in Greece, people began to have the idea that the “world” could be “understood rationally”, overcoming the religious myths: they were sceptic [σκεπτοµαι=to observe, to investigate] and critic [κρινω=to judge]: then and there a new kind of knowledge arose, the “rational knowledge”.
Till today, after centuries, we still do not use appropriately our brain! A peculiar, stupid and terrific non-sense! During his deep and long experience of Managing and Teaching (more than 40 years), F. Galetto always had the opportunity of verifying the truth of Crosby, Deming and Gell-Mann statements.
To understand each other we need to define the word “scientific”.
A document (paper or book) is “scientific” if it “scientifically (i.e. with “scientific method”) deals with
matters concerning science (or science principles, or science rules)”. Therefore to be “scientific” a paper must both concern “science matters” and be in accordance with the “scientific method”.
The word “science” is derived from the Latin word “scire” (to know for certain) {derived from the Greek words
µαθησις, επιστηµη, meaning learning and knowledge,
which, at that time, were very superior to “opinion” [δοξα], while today opinion of many is considered better than the knowledge of very few!}; Knowledge is strongly related to “logic reasoning” [λογικοςνους], as it was, for ages, for Euclid, whose Geometry was considered the best model of “scientificness”. Common (good) sense is not science! Common sense does not look for “understanding”, while science looks for “understanding”! “Understanding” is related to “intelligence” (from the Latin verb “intelligere” ([intus+legere: read into]: “intellige ut credas” i.e. understand to believe. Unfortunately "none so deaf as those that won't hear".
Let us give an example, the Pythagoras Theorem: "In a right triangle, the square of the length of the hypotenuse equals the sum of the squares of the lengths of the other two sides." Is this statement scientific? It could be scientific because it concerns the science of Geometry and it can be proven true by mathematical arguments. It is not-scientific because we did not specify that we were dealing with the “Euclidean Geometry” (based, among others, on the “parallel axiom”: from this only, one can derive that the sum of the interior angles of a triangle is always π): we did not deal “scientifically” with the axioms; we assumed them implicitly.
So we see that “scientificness” is present only if the set of statements (concerning a given “system”) are non-contradictory and deductible from stated principles (as the rules of Logic and the Axioms).
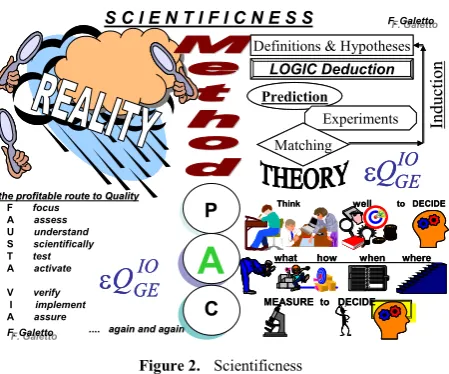
Figure 2. Scientificness
So we see that “scientificness” is present only if the set of statements (concerning a given “system”) do not contradict the observed data, collected through well designed experiments [“scientific” experiments]: only in the XVII century, due to Galilei, Descartes, Newton, … we learned that. Since that time only, science could really grow.
When we start trying to learn something, generally, we are in the “clouds”; reality (and truth) is hidden by the clouds of our ignorance, the clouds of the data, the clouds of our misconceptions, the clouds of our prejudices; to understand the phenomena we need to find out the reality from the clouds: we make hypotheses, then we deduct logically some consequences, predicting the results of experiments: if predictions and experimental data do match then we “confirm” our idea and if many other are able to check our findings we get a theory. To generate a theory we need Methods. Eric Berne [11], the psychologist father of “Transactional Analysis”, stated that everybody interacts with other people through three states P, A, C [Parent, Adult, Child, (not connected with our age, fig. 2)]: the Adult state is the one that looks for reality, makes questions, considers the data, analyses objectively the data, draws conclusions and takes logic decisions, coherent with the data, methodically. Theory [θεωρια] comes from the Adult state! Methods [µεθοδος from µετα+οδος = the way through (which one finds out…)] used to generate a Theory come from the Adult state!
People who take for granted that the truth depends on “Ipse dixit” [αυτοςεϕα, “he said that” (F. Bass “said that”, the QEG “said that”, and published his ideas on a very important Management Magazine, "Management Science")], behave with the Parent state. People who get upset if one finds their errors and they do not consider them [“we are many and so we are right”, they say!] behave with the Child state. [see the books of the Palo Alto group]
To find scientifically the truth (out of the clouds) you must Focus on the problem, Assess where you are (with previous data and knowledge), Understand Scientifically the message in the data and find consequences that confirm (or disprove) your predictions, Scientifically design Test for confirmation (or disproval) and then Activate to make the Tests. If you and
others Verify you prediction, anybody can Implement actions and Assure that the results are scientific (FAUSTA VIA): all of us then have a theory. scientificness is there (fig. 2), (F. Galetto)
From these two examples it is important to realise that when two people want to verbally communicate, they must have some common concepts, they agree upon, in order to transfer information and ideas between each other; this is a prerequisite, if they want to understand each other: what is true for them, what is their “conventional” meaning of the words they use, which are the rules to deduce statements (Theses) from other statements (Hypotheses and “previous” Theses): rigour is needed for science, not opinions.
Many people must apply Metanoia [µετανοια = change their mind (to understand)] to find the truth.
Here we accept the rules of Logic, the deductive Logic, where the premises of a valid argument contain the conclusion, and the truth of the conclusion follows from the truth of the premises with certainty: any well-formed sentence is either true or false. We define as Theorem “a statement that is proven true by reasoning, according to the rules of Logic”; we must therefore define the term True: “something” (statement, concept, idea, sentence, proposition) is true when there is correspondence between the “something” and the facts, situations or state of affairs that verify it; the truth is a relation of coherence between a thesis and the hypotheses. Logical validity is a relationship between the premises and the conclusion such that if the premises are true then the conclusion is true. The validity of an argument should be distinguished from the truth of the conclusion (based on the premises).
This kind of truth is found in mathematics.
Human beings evolved because they were able to develop their knowledge from inside (the deductive logic, with analytic statements) and from outside, the external world, (the inductive logic, with synthetic statements), in any case using their intelligence; the inductive logic is such that the premises are evidence for the conclusion, but the truth of the conclusion follows from the truth of the evidence only with a certain probability, provided the way of reasoning is correct. The scientific knowledge is such that any valid knowledge claim must be verifiable in experience and built up both through the inductive logic (with its synthetic statements) and the deductive logic (with its analytic statements); in any case, a clear distinction must be maintained between analytic and synthetic statements.
This was the attitude of Galileo Galilei in his studies of falling bodies. At first time, he formulated the tentative hypothesis that “the speed attained by a falling body is directly proportional to the distance traversed”; then he deduced from his hypothesis the conclusion that objects falling equal distances require the same amount of elapsed time. After “Gedanken Experimente”, Designed Experiments made clear that this was a false conclusion: hence, logically, the first hypothesis had to be false. Therefore, Galileo framed a new hypothesis: “the speed attained is directly proportional to the time elapsed”. From
ε
Q
GEIOε
Q
GEIOThink well to DECIDE
what how when where
MEASURE to DECIDE
Think well to DECIDE
what how when where
MEASURE to DECIDE
F. Galetto
F. Galetto
F focus
A assess
U understand
S scientifically
T test
A activate
V verify
I implement
A assure
.... again and again
.... again and again
the profitable route to Quality
the profitable route to Quality
Definitions & Hypotheses
LOGIC Deduction Prediction
Experiments Matching
Definitions & Hypotheses
LOGIC Deduction Prediction
Experiments
Matching Induc
tion
Induc
tion
P
A
C
ε
Q
GEIOε
Q
GEIO [image:6.595.67.292.74.261.2]this, he was able to deduce that the distance traversed by a falling object was proportional to the square of the time elapsed; through Designed Experiments, by rolling balls down an inclined plane, he was able to verify experimentally his thesis (it was the first formulation of the 2nd law of Mechanics).
Such agreement of a conclusion with an actual observation does not itself prove the correctness of the hypothesis from which the conclusion is derived. It simply renders that premise much more plausible.
For rational people (like were the ancient Greeks) the criticism [κρινω = to judge] is hoped for, because it permits improvement: asking questions, debating and looking for answers improves our understanding: we do not know the truth, but we can look for it and be able to find it, with our brain; to judge we need criteria [κριτεριον]. In this search, Mathematics [note µαθησις] and Logic can help us a lot: Mathematics and Logic are the languages that Rational Managers must know! Proposing the criterion of testability, or falsifiability, for scientific validity, Popper emphasized the hypothetic-deductive character of science. Scientific theories are hypotheses from which can be deduced statements testable by observation; if the appropriate experimental observations falsify these statements, the hypothesis is refused. If a hypothesis survives efforts to falsify it, it may be tentatively accepted. No scientific theory, however, can be conclusively established. A “theory” that is falsified, is no longer scientific.
“Good theories” are such that they complete previous “good” theories, in accordance with the collected new data.
A good example of that is Bell's Inequality. In physics, this inequality was used to show that a class of theories that were intended to “complete” quantum mechanics, namely local hidden variable theories, are in fact inconsistent with quantum mechanics; quantum mechanics typically predicts probabilities, not certainties, for the outcomes of measurements. Albert Einstein [one of the greatest scientists] stated that quantum mechanics was incomplete, and that there exist “hidden” variables that would make possible definite predictions. In 1964, J. S. Bell proved that all local hidden variable theories are inconsistent with quantum mechanics, first through a “Gedanken Experiment” and Logic, and later through Designed Experiments. Also, the great scientist, A. Einstein, was wrong in this case: his idea was falsified. We see then that the ultimate test of the validity of a scientific hypothesis is its consistency with the totality of other aspects of the scientific framework. This inner consistency constitutes the basis for the concept of causality in science, according to which every effect is assumed to be linked with a cause.
The scientific community as a whole must judge [κρινω] the work of its members by the objectivity and the rigour with which that work has been conducted; in this way the scientific method should prevail.
In any case, the scientific community must remember: Any statement (or method) that is falsified, is no longer scientific.
Here we assume that the subject of a paper is concerning a science (like Mathematics, Statistics, Probability, Quality Methods, Management, …); therefore to judge [κρινω] if a paper is scientific we have to look at the “scientific method”: if the “scientific method” is present, i.e. the conclusions (statements) in the paper follow logically from the hypotheses, we shall consider the paper scientific; on the contrary, if there are conclusions (statements) in the paper that do not follow logically from the hypotheses, we shall not consider the paper scientific: a wrong conclusion (statement) is not scientific.
"To understand that an answer is wrong you don't need exceptional intelligence, but to understand that is wrong a question one needs a creative mind." (A. Jay). “Intellige ut credas”.
Right questions, with right methods, have to be asked to “nature” (fig. 2).“Intellige ut credas”.
It is easy to show that a paper, a book, a method, is not scientific: it is sufficient to find an example that proves the wrongness of the conclusion. When there are formulas in a paper, it is not necessary to find the right formula to prove that a formula is wrong: an example is enough; to prove that a formula is wrong, one needs only intelligence; on the contrary, to find the right formula, that substitutes the wrong one, you need both intelligence and ingenuity. I will use only intelligence and I will not give any proof of my ingenuity: this paper is for intelligence … For example, it's well known (from Algebra, Newton identities) that the coefficients and the roots of any algebraic equation are related: it's easy to prove that ± −c/ais not the solution (even if you do not know the right solution) of the parabolic equation
0
2+bx+c=
ax , because the system x1+ x2 = -b/a , x1x2 = c/a is
not satisfied (x1 and x2 are the roots).
The literature on “Quality” matters is rapidly expanding. Unfortunately, nobody, but me, as far as I know, [I thank any person that will send me names of people who take care …], takes care of the "Quality of Quality Methods used for making Quality" (of product, processes and services). “Intellige ut credas”.
Figure 3. The “pentalogy”
F. Galetto is eager to meet one of them, fond of Quality as he is. If this kind of person existed, he would have agreed that "facts and figures are useless, if not dangerous, without
A
PC
A
PC
F focus
A assess
U understand
S scientifically
T test
A activate
V verify
I implement
A assure
.... again and again
.... again and again the profitable route to Quality the profitable route to Quality
ε
Q
GEIOε
Q
GEIOF. Galetto
F. Galetto
F. Galetto
F. Galetto
εQIO
GE
εQIO
a sound theory" (F. Galetto), "Management need to grow-up their knowledge because experience alone, without theory, teaches nothing what to do to make Quality" (Deming) because he had seen, like Deming, Gell-Mann and F. Galetto "The result is that hundreds of people are learning what is wrong. …. devastating effects of incompetent teaching and faulty applications." [Deming (1986)]
During 2006, F. Galetto experienced the incompetence of several people who were thinking that only the “Peer Review Process” is able to assure the scientificness of papers, and that only papers published in some magazines are scientific: one is a scientist and gets funds if he publishes on those magazines! Using the scientific method one can prove that the referee analysis does not assure quality of publications in the magazines of fig. 3.
The symbol ε
Q
GEIO [which stands for the “epsilonQuality”] was devised by F. Galetto to show that Quality depends, at any instant, in any place, at any rate of improvement, on the Intellectual hOnesty of people who always use experiments and think well on the experiments before actually making them (Gedanken Experimente) to find the truth” [Gedanken Experimente was a statement used by Einstein; but, if you look at Galileo life, you can see that also the Italian scientist was used to “mental experiments”, the most important tool for Science; Epsilon (ε) is a Greek letter used in Mathematics and Engineering to indicate a very small quantity (actually going to zero); "epsilon Quality" conveys the idea that Quality is made of many and many prevention and improvement actions].
Many times F. Galetto spoiled his time and enthusiasm at conferences, in University and in Company courses, trying to provide good ideas on Quality and showing many cases of wrong applications of stupid methods [see references]. He will try to do it again … by showing, step by step, one case (out of the hundreds he could document).... in order people understand that Quality is a serious matter. The Nobel price R. Feynman (1965) said that "for the progress of Science are necessary experimental capability, honesty in providing the results and the intelligence of interpreting them… We need to take into account of the experiments even though the results are different from our expectations." It is apparent that Deming, Feynman, and Gell-Mann are in agreement with ε
Q
GEIO ideas of F. Galetto. Once upon a time, A.Einstein said "Only two things are infinite: the Universe and the Stupidity of people; and I’mnot sure about the former". Let us hope that Einstein was wrong, this time. Anyway, before him, Galileo Galilei had said [in the Saggiatore] something similar "Infinite is the mob of fools".
All the methods, devised by F. Galetto, were invented and have been used for preventing and solving real problems in the Companies he was working for, as Quality Manager and as Quality Consultant: several million € have been saved. Companies will not be able to survive the global market if they cannot provide integrally their customer the Quality they have paid for. So it is of paramount importance to know correctly what Quality means. Quality is a serious and difficult business; it has to become an integral part of
management.
2. Informetrics and the
Success
-Index
Based on an idea by Kosmulski, who (2011) proposed to classify a paper as “successful” when receiving more citations than those made, the QEG (in An informetric model for the success-index appeared on Scientometrics, 2012) proposed to classify a publication as “successful” when it receives more citations than a specific comparison term (CT). In the intention of the QEG authors CT should be a suitable estimate of the number of citations that a publication – in a certain scientific context and period of time – should potentially achieve. According to this definition, the success-index is defined as the number of successful papers, among a group of publications examined, such as those associated to a scientist or a journal. QEG gave particular emphasis to a theoretical sensitivity analysis of the success-index (s-index).
For a generic group of papers, the s-index is defined as the number of papers with a number of citations greater than or equal to CTi, i.e., a generic comparison term associated to the i-th publication: CTi is an estimate of the number of citations that a publication—in a certain scientific context and period of time—should potentially achieve. A score is associated to each of the (P) publications of interest:
< =
≥ =
i i i
i i i
CT c when score
CT c when score
0 1
where ci are the citations received by the i-th publication. This achievement determines the condition of success.
The s-index is
∑
== P
i i
score
1 QEG members consider a paper
as a product coming out form a production process, and use one of the most popular informetrics, the law of Lotka
𝑓𝑓(𝑗𝑗) = 𝐾𝐾/𝑗𝑗𝑎𝑎 with K> 0 and a>1. K represents the number of
articles with exactly 1 citation. In bibliometrics, according to its parameters, Lotka's law allows to describe the distribution of citations of different groups of papers. The QEG members (all graduated CUM LAUDE, teaching “Quality matters” and in the ResearchGate with high Impact Points!!!)model the s-index, assuming to analyse a homogeneous group of papers, i.e. a group of papers belonging to the same discipline of interest. Under this hypothesis the CTis the same for all the papers; then we have = ∑ 𝐾𝐾/𝑗𝑗∞ 𝑎𝑎
𝐶𝐶𝐶𝐶 .
The QEG than have a great idea [!?]: they replace the integer variable j with a continuous variable j and then replace the sum with an integral 𝑠𝑠 = ∫ 𝑘𝑘/𝑗𝑗∞ 𝑎𝑎
𝐶𝐶𝐶𝐶 𝑑𝑑𝑗𝑗 where K
becomes k (due to the continuity). The QEG members (all graduated CUM LAUDE, and teaching “Quality matters”) do that for finding some easy formulas by integration BUT they do not realise that they make a big mess. They find
𝑠𝑠 = 𝑎𝑎−1𝑘𝑘 𝐶𝐶𝐶𝐶1−𝑎𝑎 and 𝑃𝑃 = ∫ 𝑘𝑘/𝑗𝑗∞ 𝑎𝑎
1 𝑑𝑑𝑗𝑗 =
𝑘𝑘
𝑎𝑎−1 and then
𝑠𝑠 = 𝑃𝑃 𝐶𝐶𝐶𝐶1−𝑎𝑎 Since the QEG members do not know much
proving that their QEG s-index is wrong. As a consequence all the calculations made by the integral formula are wrong. An alternative model, copying Egghe 2007, can be considering the total number (C) of citations instead of the number (P) of articles, which is the “mean” of the density; so
𝐶𝐶 = ∫ 𝑗𝑗 𝑘𝑘/𝑗𝑗∞ 𝑎𝑎
1 𝑑𝑑𝑗𝑗 =
𝑘𝑘
𝑎𝑎−2and 𝑠𝑠 = 𝐶𝐶(𝑎𝑎 − 2)/(𝑎𝑎 − 1) 𝐶𝐶𝐶𝐶1−𝑎𝑎.
After that, the QEG members make a sensitivity analysis of the model. Their natural question arising from the definition of the s-index is: "What does it happen varying CT?" They, treating CT as a random variable with a certain standard deviation, try to see how the uncertainty related to its estimation propagates on the s-index. BUT they do more: they assume that the s-index can be seen as a non-linear function of three random independent variables: CT, a and P with expected values
(
µCT,µα,µP)
and standard deviationsP
CT σ σ
σ , α, of the three random variables.
Obviously the three random independent variables are NOT INDEPENDENT. Then the members of QEG revert to consider only the variable CT; they assume an average value for "a" around 2, and find 𝜎𝜎𝑠𝑠2≅(𝜇𝜇𝑃𝑃/𝜇𝜇𝐶𝐶𝐶𝐶2 )2𝜎𝜎𝐶𝐶𝐶𝐶2 . Then they
assume that CT it is normally distributed (due to the central limit theorem, a great NONSENSE!) Moreover CT is not a continuous variable and the calculations of s are related to the “zeta” Riemann function 𝜁𝜁(𝑎𝑎) and make simulations, with data P=718, C=6641 and a=2.12, and with mean
{
10,11,,30}
∈ CT
µ
and standard deviation=1!!!Citing the QEG (in the ResearchGate with high Impact Points!) and their findings, F. Galetto, according the QEG ideas, provided a “good” score to their paper, also if they make mathematical and statistical errors with calculation error as big as 10%!
In the next section we shall see the implications of the Reliability concepts on the Bass model that it is taught to students, as shown in the introduction.
3. The “Reliability” Bass Model
We deal here with the Bass model, using the Reliability Theory.
The Bass model is used for studying the diffusion of products (but also of ideas, and of companies’ certifications, …).
Let T be the random variable “Time to purchase (diffusion of …)” of a product, and 0__t, the time interval (whose duration is t), in which we want to make forecasting. F(t) is the probability that a product is purchased before time t, while R(t) is the probability that no purchase happens in the interval 0__t; f(t) is the pdf of the random variable “Time to purchase”; the formula that, according to Bass and his followers, provides "The probability of adopting by those who have not yet adopted is a linear function of those who had previously adopted." is, given, in the introduction, as
) ( )]
( 1 /[ ) ( )
(t = f t −F t = p+qF t
λ
(6)Comparing (6) and (3), it becomes evident that all those bad divulgers do not know Probability Theory: as a matter of fact, the λ(t) dimensions are number/time [as for f(t), probability density function] and therefore λ(t) is not a number, as a probability must be [0≤λ(t) ≤1]; λ(t) is neither a probability density function, as well, because, due to (4),
∞ =
∫
0∞h(x)dx (7)Therefore all the people, all over the world, that claim that “λ(t) is a probability …”, make a wrong statement. Are they “scientific” people?
4. How Many Thousands are They, Bass
Included?
As a consequence, the parameters p and q in the Bass formulation of the model
λ
(t)= p+qF(t) are not probabilities: they are not numbers; on the contrary they are numbers/time. λ(t), p and q are “adoption rates”, “purchasing rates”, not probabilities!Figure 4. Shape of F(t)%,…, with p=0.001, q=0.1
0 10 20 30 40 50 60 70 80 90 100
0 10 20 30 40 50 time60 70 80 90 100
Figure 5. Shape of F(t),…, with p=0.1, q=10
Figure 6. Conditional probability (no purchase)
Figure 7. Shape of F(t),…, with p=0.018, q=0.67 0
0,1 0,2 0,3 0,4 0,5 0,6 0,7 0,8 0,9 1
0 0,1 0,2 0,3 0,4 0,5 time0,6 0,7 0,8 0,9 1
R(t) F(t)
MTTF(t) h(t)/q
conditional probability, no innovation
0 0,1 0,2 0,3 0,4 0,5 0,6 0,7 0,8 0,9 1
0 10 20 30 40 50 60 70 80 90 100
0 10 20 30 40 50 60 70 80 90 100
0 4 8 12 16 20quarter24 28 32 36 40 44
R(t)% F(t)%
[image:10.595.145.462.77.281.2] [image:10.595.146.464.525.728.2]So the quantitiesλ(t), p and q, can take any positive value, from 0 up to ∞, with dimension “time-1”: e.g. 100000 adoptions/century! [which obviously is < 1 if one use hours as time unit of measurement! but, nevertheless, λ(t), p and q are not probabilities].
In [2] one finds the “probabilities” p=0.001 and q=0.1, and there is no unit of measurement for time t {we assume t measured by days [24 hours]}. Figure 4 shows the graphs of the functions. Notice that F(t) and h(t)/q have a very similar shape, and MTTP(t) [indicated as MTTF(t)] tends to E[T].
Using, on the contrary, the "rates" p=0.1/[100 days] and q=10/[100 days], and time t measured by 2400 hours [0.1, in fig. 5], one gets the same kind of shape; actually any formula depends on the products [pure numbers!] p*t. q*t and q*MTTP(t).
We name Mean Time To Purchase the mean of the random variable T,
∫
∫
∞ = ∞ = = 00 ( ) ( )
]
[T xf x dx R t dt
E
MTTP (8)
The purchasing (diffusion, …) rate is, obviously, neither a (conditional) probability density nor a (conditional) probability; it is [see (6)]
) ( / ) ( )
(t f t R t
h = (9)
The knowledge of the purchasing rate h(t) is enough to obtain any purchasing characteristic [R(t), MTTP, MTTP(t), F(t), f(t)].
The Mean Time To Purchase, related to the interval 0__t, is
∫
= tR x dx t
MTTP
0 ( ) )
( (10)
Now using the hypothesis of professor F. Bass, one gets from (6) the non-linear differential equation
)] ( 1 )][ ( [ )
(t p qF t F t
f = + − (11)
Using R(t), the probability that no purchase happens in the interval 0__t, one gets from (6) and (10) the non-linear integral equation ] ) ( exp[ ] ) ( exp[ )
(t = − p+qt q
∫
0tR x dxR (12)
whose solution is
+ − + + = ] ) ( exp[ ) ( ln ) / 1 ( ) ( t q p q p q p q t
MTTP (13)
The Mean Time To Purchase (diffusion, …) is
q h h q p q p
MTTP=ln[( + )/ ]/ =ln[ (∞)/ (0)]/ (14) We can get a deep insight of the model by rewriting (12) in the form
{
[ ( )]}
exp ] exp[ )(t pt qt MTTPt
R = − − − (15)
From (15) we see that innovation (with innovation rate p, constant) exploits its exponential influence for the time t, while imitation (with imitation rate q, constant) exploits its influence mainly for the time t-MTTP(t); the shape of the conditional probability R(t)/exp(-pt), the probability that no purchase happens in the interval 0__t, given that no
innovation purchase happened in the interval, depends essentially on t-MTTP(t) and on the imitation rate q; a typical shape is in figure 6. After MTTP, R(t) decreases exponentially and MTTP(MTTP) ≅ MTTP.
When the rate p is constant, all innovation purchases are distributed “in the most random manner”: the conditional probability of no innovation purchase does not depend on the past innovation purchases of the product.
The point of maximum of f(t) is found through the equation R′′(t)=0, that is the value of the abscissa of the inflection point of R(t).
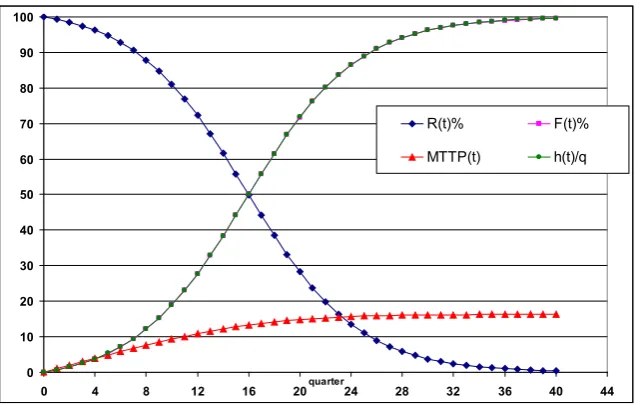
Let us now use some data from the Bass paper [1].In [1] one finds the "plausible [according to Bass] probabilities" p=0.018 and q=0.67, and there is no unit of measurement for time t{since the forecast is by year, we assume t measured by years [4 quarters]}. Figure 7 shows the graphs of the functions.
Notice that F(t) and h(t)/q have a "very very" similar shape (they cannot be seen apart), and MTTP(t) tends to E[T].
The peak is after 4 years (16 quarters); this is also the MTTP (in this case).
One can generalise the diffusion model by
]
)
(
)
(
exp[
]
)
(
exp[
)
(
00
x
dx
x
R
x
dx
t
R
=
−
∫
tα
∫
tβ
(16)where α(x) and β(x) are any positive functions [rates] of time x.
If advertising can influence the innovation purchases, it is logic not to consider p=constant, but, on the contrary, α(t) increasing in the first part of the life cycle of the product.
It is important to notice that the integral equation (16) [found by F. Galetto] is able to deal with several others diffusion models, e.g. the Verhulst (logistic growth) model [15], or Malthus (exponential growth) model [16], or Volterra (competitive growth) model [17].
We mention here some points of the conclusions of F. Bass [1]; he wrote: "The growth model developed in this [1] paper for the timing of initial purchase of new products is based upon an assumption that the probability of purchase at any time is related linearly to the number of the previous buyers. There is a behavioural rationale for this assumption. The model implies exponential growth of initial purchase to a peak and then exponential decay. In this respect it differs from other new product growth models." This Bass statement is a nonsense: it is enough looking at formula (15) and at figure 7: everything depends on the time interval "of initial purchase"!
Looking at figure 7, it is evident that F(t) is not exponential and therefore f(t) [its derivative is not exponential] from time 0 to the time of inflection point. Again, looking at figure 7, it is evident that F(t) is not exponential and therefore f(t) [its derivative is not exponential] from the time of inflection point up to ∞. Only after the time t such that MTTP(t)≅MTTP, one can see the "exponential decay"!
Probability and Reliability Theory [but they have high informetric scores!!!].
[image:12.595.346.518.396.579.2]Therefore students’ learning is as in figure 1 (Deming) Equally important is figure 8, based on M. Gell-Mann ideas:
Figure 8. Gell-Mann ideas
We hope that professors will consider their duty to teach scientifically, in order to satisfy the learning need of their students and of the whole society.
5. Qualitometro I/II/III: "Quality
Engineering", and "Quality and
Reliability Engineering
International"
In section 1 we provided citations to QEG members’ papers, making their papers “good”.
Before going on, let the reader ask himself: «if F. Galetto, acting as a scientist (as a µαθητης), criticises the findings of "a member of the Editorial Board (as found in a book) of the journals Quality Engineering and International Journal of Quality and Reliability Management", what is the probability that the scientific community accept his ideas?»
Let's now consider the method for Control Charts for Service, as given in the QEG papers mentioned in section 1. To understand F. Galetto findings it is important to provide immediately the ideas of the QEG [in the above papers]. Three excerpts of their papers are given; the first two were given in section 1.
1st Excerpt(see section 1)from the paper "On line Service Quality Control: the Qualitometro Method", Quality Engineering.
2nd Excerpt(see section 1)from "Control Charts for linguistic variables: a method based on the use of linguistic quantifiers", IJOPR.
QEG members were very unfortunate with their example regarding "a five level scale, the series of numbers: 1, 2, 3, 4, 5, or the series: -9, -3, 0, 3, 9, we obtain two different results.", because, due to the isomorphism, the two results are EQUIVALENT: since the data of fig. 10 can be used (for
a 5 level scale) the result is 'medium quality' for each scale!!! "…1, 2, 3, 4, 5, or the series: -9, -3, 0, 3, 9, we obtain two different results." is a FALSE statement.
3rd Excerpt from the paper "Service Qualimetrics: the Qualitometro II Method", Quality Engineering.
«Questionnaires are used to perform service quality evaluation … Proper scales for this purpose are linguistic scales. Linguistic scales used in the questionnaire possess the ordinal property only. The method … is able to handle information expressed on linguistic scales without any artificial numeric scalarization. … Refusal of an arbitrary encoding of scale levels means that a method must be devised for introducing an average operator on a scale where the distance concept ("norm") is not defined, only the ordering property is. … The main novelty of the method are as follows:
• No arbitrary and artificial encoding of collected information, •Aggregation of collected information using methods and tools proper for linguistic scale treatment.»
Reading those 3 papers F .Galetto understood [as a
µαθητης] the following 1♣) using numbers is wrong, and 2♠) it is correct ONLY to use fuzzy logic [Yager] and linguistic variables [Zadeh] in order to avoid the "tyranny of numbers", an important thing because "… forcing the decision maker to supply information with greater precision than he is capable of providing… may lead to incorrect answers …".
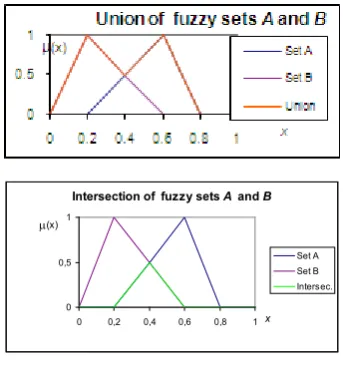
Figure 9. Operations on Fuzzy sets
What must do a serious scientist (a µαθητης) when a new "theory" ["theory" (??) as Qualitometro pretends to be] is proposed? A serious scientist starts studying and understanding scientifically (fig .2 and FAUSTA VIA). That did Galetto: he studied fuzzy logic/linguistic very well.
Before going on the reader needs some basics of "Fuzzy Theory". We cannot provide them here due to allowed space limitations for the paper. (in fig. 9 we give only ∩ and ∪
operations. The GOM of the two fuzzy… are triangular) It is important to remark here that all the "fuzzy operations" on the "fuzzy sets"are based on "classical operations on the classical mathematical functions as the GoM (Grades of Membership) are". [i.e. on the classical sets
Intersection of fuzzy sets A and B
0 0,5 1
0 0,2 0,4 0,6 0,8 1x
µ(x)
operations ∩ and ∪!!!!]
We have used membership functions with triangular shape: this choice has been made only for the sake of simplicity; actually, the fuzzy literature shows many other classes of the membership functions.
It is logic that, from the above, one deduces that "NO Grade Of Membership ⇒ NO Fuzzy Theory". In order to analyse correctly the "Qualitometro method" we need also the following information (see fig. 10).
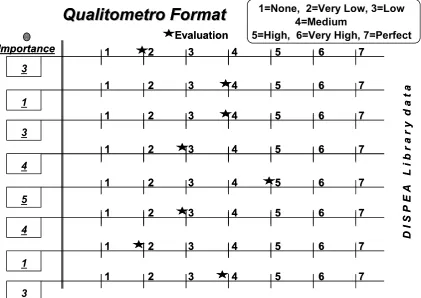
As done by the QEG, in the Qualitometro method (see fig. 10), let’s assume that "quality data" are collected on 8 "quality characteristics" gj [called "criteria"]; an evaluator provides an evaluation "gj(e)" to jth criterion (jth "quality characteristic") and assigns an importance I(gj) to each evaluation criterion; both evaluation and importance are given on a 7 points linguistic scale [None, Very Low, Low, Medium, High, Very High, Perfect]. (see the Qualitometro Format, where some real data are presented; for example, the 1st "quality characteristic" was rated as Very Low = g1(e), with Importance graded as Low=I(g1)). Many times the points linguistic scale [N, VL, L, M, H, VH, P] are transformed into numbers and therefore the "original linguistic" evaluations and importances provided by the evaluator, through a scalarization, are converted into numbers (e.g. 1, 2, 3, 4, 5, 6 ,7); then the numbers are used for any elaboration (e.g. expected values and control limits computation).This attitude is strongly criticised by QEG
members who (for their "Qualitometro Method") say "It is worthwhile to emphasize that the provided aggregation does not perform any arbitrary scalarization of information given by evaluators on linguistic scales. … Refusal of an arbitrary encoding of scale levels means that a method must be devised for introducing an average operator on a scale where the distance concept ("norm") is not defined …".
They then aggregate the 8 criteria into a "quality" q, using (they say!) fuzzy logic with the formula q=Min[Max[NegI(gj), gj(e)]], claiming that this formula is derived by "Fuzzy Theory" (as given in Yager).
Yager invented his method, capable of dealing with non-numeric data, in 1981, with the paper "A new methodology for ordinal multiobjective decision based on fuzzy sets". He stated that the decisions made by a Decision Maker (DM) are based on a certain number of "criteria" gj; for each criterion the data are collected on a 7 points linguistic scale [None, Very Low, Low, Medium, High, Very High, Perfect]. Criteria can have different importance I(gj). An evaluator [sometimes the Decision Maker (DM) himself] provides an evaluation "gj(e)" to jth criterion and assigns an importance I(gj) to each evaluation criterion; both evaluation and importance are given on the same 7 points linguistic scale. The criteria are aggregated into a "decision function" q (called "quality" by the service quality evaluators), using fuzzy logic with formula q=Min[Max[NegI(gj), gj(e)]]: QEG actually copied Yager(see Gell-Mann, fig. 8).
Figure 10. Qualitometro format for collecting data (with Linguistic Variables): actual data
Qualitometro
Qualitometro
Format
Format
Importance Evaluation
1=None, 2=Very Low, 3=Low
5=High, 6=Very High, 7=Perfect4=Medium
1 2 3 4 5 6 7
1 2 3 4 5 6 7
1 2 3 4 5 6 7
1 2 3 4 5 6 7
1 2 3 4 5 6 7
1 2 3 4 5 6 7
1 2 3 4 5 6 7
1 2 3 4 5 6 7
3
1
1 3
3 4 4
5
D
I S P
E A
L
i b
r a
r y
d
a
t a
Qualitometro
Qualitometro
Format
Format
Importance Evaluation
1=None, 2=Very Low, 3=Low
5=High, 6=Very High, 7=Perfect4=Medium
1 2 3 4 5 6 7
1 2 3 4 5 6 7
1 2 3 4 5 6 7
1 2 3 4 5 6 7
1 2 3 4 5 6 7
1 2 3 4 5 6 7
1 2 3 4 5 6 7
1 2 3 4 5 6 7
3
1
1 3
3 4 4
5
D
I S P
E A
L
i b
r a
r y
d
a
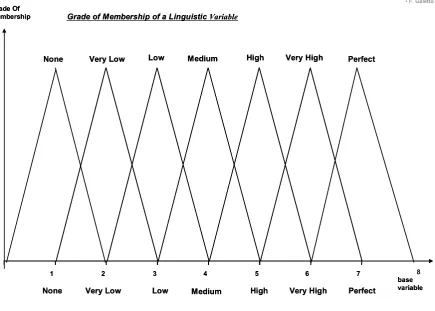
[image:13.595.97.519.419.717.2]Figure 11. Grade of Membership functions for Linguistic Variables [defined by Fausto Galetto]
Figure 12. Points from the Qualitometro format of figure 10 (format for collecting data left) and NUMERIC Method (right, FG)
•F. Galetto •F. Galetto
3 2
1 4 5 6 7
base variable Grade Of
Membership
None Very Low Low Medium High Very High Perfect
Grade of Membership of a LinguisticVariable
•F. Galetto •F. Galetto
None Very Low Low Medium High Very High Perfect 3
2
1 4 5 6 7
base variable Grade Of
Membership
None Very Low Low Medium High Very High Perfect
Grade of Membership of a LinguisticVariable
•F. Galetto •F. Galetto
None Very Low Low Medium High Very High Perfect
8
Linguistic data are coded as
0, 1, 2, 3, 4, 5, 6
[6 is the first “perfect number”]
NOTICE
: the data are collected
as “numbers” in the format
The criteria are aggregated into a
"
decision function
" q
(called "quality" by the
service quality evaluators)
, using
fuzzy logic
with
formula
q=Min[Max[NegI(gj), gj(e)]].
0 1 2 3 4 5 6
0 1 2 3 4 5 6 g (e )
[image:14.595.84.522.426.697.2]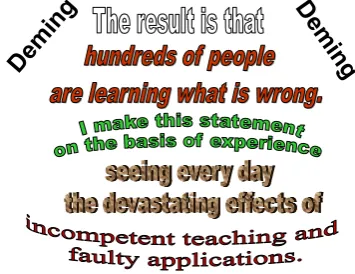
![Table 2. Data on the quality of 40 items [10 samples of 4] and their "scalarization" with mean and range (right hand)](https://thumb-us.123doks.com/thumbv2/123dok_us/8776737.901871/19.595.132.478.272.468/table-data-quality-items-samples-scalarization-range-right.webp)