Structural Calibration of the Rates of Amino Acid Evolution in a Search for Darwin in Drifting Biological Systems
Christina Toft13 and Mario A. Fares12*
1Evolutionary Genetics and Bioinformatics Laboratory, Department of Genetics,
University of Dublin, Trinity College, Dublin, Ireland
2Integrative Systems Biology Group, Institute of Molecular and Cellular Biology
(CSIC‐Universidad Politécnica de Valencia (UPV)), Valencia, Spain.
3Current address: Department of Evolution, Genomics and Systematics, Uppsala
University, Uppsala, Sweden.
*Correspondence Author: Mario A. Fares
Address: Department of Genetics, University of Dublin, Trinity College, Dublin 2, Dublin, Ireland.
Institute of Molecular and Cellular Biology (CSIC‐Universidad Politécnica de Valencia (UPV)), Valencia, Spain.
Phone number: 34 1 3879934
Email address: [email protected]
Keywords: Darwinian Evolution, Natural Selection, Endosymbiotic Bacteria, Calibrated Evolution
ABSTRACT
INTRODUCTION
“That natural selection will always act with extreme slowness I fully admit” ‐ The Origin of Species (1857). With this statement, Darwin acknowledged the relative slowness of natural selection. This remark remains generally true, although exceptions highlight the occasionally saltational nature of evolution. For example, protein evolutionary rates usually shift between groups of organisms with different biological properties or distinct population dynamics. These shifts are generally correlated with functional changes in proteins that enable organisms to adapt to new environments. However, changes in environmental conditions are also accompanied by non‐selective processes induced by genetic drift such as gene loss or accelerated rates of evolution in no‐ longer important (functionally redundant) genes (16). Although many studies have been conducted to identify adaptive evolution, little effort has been invested in disentangling the variation in protein’s evolutionary rate caused by adaptive processes from that due to genetic drift. Resolving this question is fundamental to shedding light on the evolvability of proteins and hence in evaluating the potential of proteins to generate functional innovation.
Different methods based on the ratio between the rates of non‐ synonymous and synonymous nucleotide substitutions (ω = dN/dS) have been
devised to identify selection indiscriminately in all types of biological systems. Although such conservative measures of the intensity of selection can in theory distinguish between adaptive evolution (ω > 1), neutrality (ω = 1) and purifying
selection (ω < 1), they are subject to limitations. In particular, these methods
to the core of a protein makes it difficult to identify punctual events of adaptive evolution using ω because such events are generally masked by strong purifying
selection that operates at these sites during most of their evolution. Conversely, residues with little functional importance can show high rates of amino acid substitutions that, when the number of synonymous changes is small, can lead to inflated ω values erroneously supporting adaptive processes. Rather than being
an exception, this problem underlies many biological systems that present complex population dynamics resulting from a change in their lifestyle. Accurate identification of selection in these biological systems may shed light on the molecular mechanisms enabling ecological innovation. Symbiosis is one of the most striking examples of biological innovation. Indeed, insects that have established symbiosis with proteobacteria have colonized a myriad of ecological niches, leading to the astonishing diversity of insect species (Price 1991). Buchnera aphidicola, the primary symbiotic bacterium of aphids, and Candidatus
Blochmannia sp, the primary symbiotic bacterium of carpenter ants, are among
generations in an irreversible fashion, a phenomenon previously recognized as an example of Muller’s ratchet (Muller 1964). The strong effect of genetic drift in these bacteria makes it difficult to identify positively selected molecular changes that may have been beneficial for adaptation to the endo‐cellular lifestyle.
MATERIALS AND METHODS Genomes and Alignments
We used four genomes of Buchnera aphidicola (hereafter Buchnera), the primary symbiotic bacterium of aphids, including strains Acyrthosiphon pisum (BAp: NC_002528), Schizaphis graminum (BSg: NC_004061), Baizongia pistaciae (BBp: NC_004545) and Cinara cedri (BCc: NC_008513). We did not use the two recently sequenced BAp genomes (Moran, McLaughlin, and Sorek 2009) to avoid biased results due to over‐representation of one of the endosymbiotic genomes. In addition, these two new BAp genomes only represent intra‐population variability at the very recent time scale while we were more interested in the variability at the species level. We also used the genomes of the endosymbiotic bacterium of carpenter ants Blochmannia, including Candidatus Blochmannia pennsylvanicus (Bp: NC_007292) and Candidatus Blochmannia floridanus (Bf:
NC_005061). We used 85 complete genomes of gamma‐3 proteobacteria to compare the evolutionary dynamics between free‐living and endosymbiotic bacteria (see table 1 of Supplementary Information). These 85 genomes were those containing orthologs for the genes present in the endosymbiotic bacteria studied in this work. With each of the genes from the genomes of endosymbiotic bacteria we performed Blast searches to find their homologs in other genomes. We considered homologous genes only those showing reciprocal top best Blast hits with scores of less than or equal to 10‐4. For each one of the genes we built
protein multiple sequence alignments using the ClustalW program with the default parameters (Thompson, Higgins, and Gibson 1994).
All available protein structures for gamma‐3 proteobacteria (mainly in Escherichia coli: Ec) were downloaded from the protein data bank (PDB:
http://www.rcsb.org/pdb/). In total, we downloaded 1,000 (but 1075 different
chains) structures (Accession numbers in Table 4 of Supplementary Information). In those protein structures with several chains or subunits we blasted each of the subunit amino acid sequences against the representative sequence in gamma‐3 proteobacteria and stored that chain of the protein structure sequence with the highest score. These structures represented approximately 20% to 25% of the proteome of Ec. This set of structures also contained 221 proteins in Buchnera (about 50% to 80% of the remaining genes in BAp and BCc, respectively) and 335 proteins from Blochmannia (constituting about 50% to 60% of the proteins set conserved in Blochmannia genomes). None of the main functional categories contained in the cluster of orthologous groups (COG), were over‐represented (we found no significant enrichment of any of the categories for any of the structures, and the proportion of represented proteins in the three main categories varied only between 28% and 37%). Despite this, we found significant differences in the rates of evolution of crystallized proteins versus non‐crystallized ones in Buchnera (T‐test of independent samples: t = 3.319, d.f. = 156, P = 0.001) and in Blochmannia (t = 2.470, d.f. = 454, P = 0.013), with crystallized proteins being the most variable. Highly conserved proteins therefore do not bias our analyses, and we have a sufficient amount of evolutionary noise in our proteins so as to put our approach to the test.
acid density) within each of the proteins by measuring the structural distance among all pairs of amino acid sites using the Euclidean distance:
€
d= 1
NK
(
Xi−Xj)
2
+
(
Yi−Yj)
2+(
Zi−Zj)
2j=1 K
∑
i=1 N∑
Here N is the number of atoms in amino acid i while K is that number in amino acid j. X, Y and Z represent the three‐dimensional coordinates of the atoms corresponding to each of the amino acids. We considered two amino acids to contact each other when the distance between their closest atoms was 4Å.For each one of the 28 categories of protein sequence sub‐alignments we measured the average pairwise amino acid distance corrected for multiple hits using Poisson. Then we plotted Poisson‐corrected distances against the classes of amino acid densities. This allowed us to construct curves that provided a background protein evolutionary divergence against which we could compare individual sub‐alignments. Using this evolutionary background signal we tested and identified signatures of selective constraint deviating from expectation at individual amino acid site categories within proteins.
Identifying Calibrated Selection Constraints in Endosymbiotic Proteins We built multiple sequence alignments for all those endosymbiotic proteins for which a crystal structure is available. The final set of proteins for which we built alignments consisted of 221 proteins for Buchnera and 335 proteins for Blochmannia. After classifying proteins into the different divergence levels
RESULTS
The number of residue interactions constrains amino acid evolution
the structural density of amino acids and their divergence in endosymbiotic bacteria is better explained by a curvilinear (quadratic) rather than linear model (Figure 1A and B). In this model, the slopes of the curves are only slightly negative at amino acids presenting low numbers of interactions (for example, low amino acid density) and increase sharply at higher amino acid densities (Figure 1B and C). A plausible explanation for this pattern is that endosymbiotic bacterial genomes have fixed mutations neutrally at amino acids with low densities (possibly due to lower constraints) that became quickly saturated over time. This may have led to a slope that becomes insensitive to the variance of amino acid density when density values are low. This result was not biased by the codon or nucleotide composition because there was no correlation between the structural location of the amino acid and its nucleotide composition (Spearman Correlation: r = 0.087; P >> 0.2).
categories (Figure 2B). In the case of the endosymbiotic bacteria Buchnera and Blochmannia, the results were slightly different because, despite the
reproducibility of negative correlation between rates and amino acid densities in all COG categories, the high variance between the curves resulted in the overlap of divergence rates among the different protein divergence levels (Figure 2C to F). This supports the fact that amino acid sites in these systems have become saturated by replacements. Interestingly, the met comprised the most highly evolving proteins, while isp compiled the slowest evolving proteins in Buchnera and Blochmannia (Figure 2C to F). The same pattern was not observed in free‐ living bacteria, where the amount of contributed variation within each divergence category varied randomly among the COG classes (Figure 2A and B and Table 4 of Supplementary Information). It was also noteworthy that, in Buchnera and Blochmannia, residues with the highest amino acid densities
presented substantially lower divergence levels in the 30% divergence category compared to the 10% and 20% divergence categories (Figure 2C to F). In other words, amino acids in the protein core seemed more constrained in proteins with 30% divergence than in those with 10% or 20% divergence. This may indicate functional divergence at these amino acids followed by strong constraints to preserve their new functional roles, as previously suggested (Toft, Williams, and Fares 2009).
Heterogeneous evolutionary dynamics of amino acids across protein structures
mode of evolution of amino acid sites with high structural densities is equivalent to that of surface‐exposed amino acids despite their different divergence levels. We addressed this in free‐living bacteria and endosymbiotic bacteria separately because they experience different population structures and selection patterns. To test the correlation between the mode of evolution and the structural density we studied possible changes throughout the phylogeny in the evolutionary dynamics of amino acids falling within particular density categories. We examined whether the average evolutionary rate of amino acids belonging to one density category changes between different phylogenetic levels (that is, we compared the rates of evolution estimated from closely‐related organisms to those obtained from distantly related organisms in the same phylogeny) and whether these changes (which we call Phylogenetic Selection Shifts, PhSS) are of the same magnitude in the different density categories. To compare PhSS in evolutionary rates between density categories, we calculated the increments in evolutionary divergence across the phylogeny for each density category. Due to the fact that for some genes, distance between the two sister taxa can be greater than the mean tree divergence, we assumed both these divergence levels follow a binomial distribution. Therefore, the increment of divergence for each of the amino acids within a sub‐alignment and density category was:
€
ΔD=1− P tree −PEc−St
P tree +PEc−St
Here ΔD is the increment of the Poisson‐corrected distance for each amino acid within a particular amino acid density category,
€
Salmonella typhimurium (St). It is noteworthy that in the tree Ec and St are the
closest possible species and hence Ptree should be greater than PEcSt. Accelerated
evolution between Ec and St in a particular density category will imply that PEcSt
approaches
€
P tree, the ratio will decrease, and hence ΔD will approach 1. The
inverse situation will lead to increments closer to 0. We then conducted the same approximation in Buchnera and calculated the ratio for PBApBSg (the closest
endosymbiotic bacterial species in the tree) and the average distance for the four Buchnera genomes along the phylogeny, PBuchnera. The results in figure 3 show
that despite their population dynamics, endosymbiotic bacteria display evolutionary patterns strongly suggesting the action of natural selection at highly constrained amino acids.
Identifying calibrated Darwinian selection in endosymbionts
effects of destabilizing mutations through GroEL/S (Moran 1996; Fares et al. 2002a; Fares, Moya, and Barrio 2004; Fares, Moya, and Barrio 2005), or that slow down cell division in order to adapt to intra‐cellular life (Toft, Williams, and Fares 2009).
We examined the distribution of the genes that showed accelerated or constrained evolution in the different categories of the cluster of orthologous groups (COG) and we identified Fast‐evolving and slow‐evolving genes in all three COG categories (met, isp and cps). However, unlike in other COG categories, , we did not find evidence of enrichment for constrained (or slowly‐ evolving) genes in met (Figure 5 and Table 5 of supplementary information). In Blochmannia we also identified a significant impoverishment for slow‐evolving
genes in met (Figure 5). Conversely, fast‐evolving and slow‐evolving genes were present in the other two categories in Buchnera and Blochmannia (Figure 5).
Identification of calibrated constraints in two case studies
amino acids as being under strong purifying selection (spheres in the structure of figure 6a). From the perspective of structural constraints, we would expect these residues to evolve more quickly than core‐protein residues because they are involved in a low number of residue interactions. However, the function of these residues is essential and they are therefore expected to evolve slowly despite their low structural densities. Identification of amino acid sites with low densities and high constraints reveals that residues from the binding region as well as those surrounding it are evolving slowly (figure 6a).
Discussion
solvent accessibility of amino acids and their evolutionary rate has been previously addressed (Thorne, Goldman, and Jones 1996; Goldman, Thorne, and Jones 1998; Bustamante, Townsend, and Hartl 2000; Mintseris and Weng 2005; Bloom et al. 2006a; Conant 2009; Conant and Stadler 2009). In spite of the clear inter‐dependence between these two factors, no formal correlation analyses have been carried out to quantify this relationship across protein structures. In our study we assumed that number of atomic interactions is a greater determinant of amino acid evolutionary rate than solvent accessibility – these properties are not necessarily correlated because, in small proteins, amino acids may have low solvent accessibility and yet establish a low number of atomic interactions. We also used our quantitative measure of the relationship between divergence levels and atomic interactions to build curves of evolution in order to calibrate the evolutionary constraints operating within proteins. The importance of these curves stems from the potential they confer to tease apart adaptive evolution from genetic drift in biological systems under strong drift effects. Using
ω in these systems would be useless because both drift and positive selection
this to have a negligible effect on our conclusions, because the number of amino acids involved is likely to be very limited. Indeed, if this were a general phenomenon we would expect the resulting stochastic noise to hide the patterns observed in our study and therefore our results are, overall, conservative.
The endosymbiotic bacteria of insects are often under strong bottlenecks during their intergenerational transmission, and their genomes are characterized by high AT‐content and saturation of synonymous sites (Rispe et al. 2004). Proteins from these bacteria are therefore very likely to violate the assumption of neutrality at synonymous sites. Synonymous sites may also be under selection (Chamary, Parmley, and Hurst 2006; Mayrose et al. 2007). This poses difficulties in using ω as a measure of the intensity of selection in these systems. Using
In summary, unlike many authors we use the link between structure and evolvability to identify signatures of selection. This allows the identification of selection signatures against a neutral background enhanced by drift. Our work demonstrates that we need to account for the structural constraints on amino acid evolvability to accurately infer selection. We propose using calibrated curves of evolution as a new approximation for identifying adaptive Darwinian selection regardless the system under study.
Acknowledgements We thank the Evolutionary Genetics and Bioinformatics lab members for a careful review of the manuscript and useful suggestions. We especially thank Tom A. Williams for reading the manuscript and making useful suggestions on the writing. This work was supported by Science Foundation Ireland under the President of Ireland Young Researcher Award [04/YI1/M518] to MAF. Part of the
Figure Legends
up to 10%, between 10% and 20% divergence and between 20% and 30% divergence levels. All the different correlation analyses are colour coded.
Figure 3. Amino acid structural contacts determine their evolutionary dynamics.
To identify the evolutionary dynamics at different categories of amino acid contacts, we estimated the proportional increment of evolutionary rate in free‐ living bacteria (A) and endosymbiotic bacteria of aphids (B) and compared it between different density categories. We estimated the density of amino acids as the number of residue contacts. We considered two residues to contact in the structure if they were within 4 Angstroms distance from one another. We calculated the proportional increments focusing in the pairs Buchnera Acyrthosiphon pisum (BAp) and Schizaphis graminum (BSg) for endosymbionts
amino acids under constraints in the different atomic density categories is shown. Density categories are represented as the number of amino acids that are in contact with a residue within the structure. We estimated the distance between residues using Euclidena distance and considered two residues to contact if they were within 4 Angstroms from one another. The analyses were carried out for each of the categories of the Cluster of Orthologous Genes (COGs). Figure 5. Enrichment analysis of functional categories for constrained amino acids. We counted the number of outliers within each of the functional categories of metabolism, information storage and processing and cellular processes and signalling. The significance of the enrichment for constrained or relaxed genes was calculated using chi‐square test. We indicate enriched categories by a * (P < 0.05) or ** (P < 0.01). The different functional categories are colour coded.
Figure 6. Case study of proteins with calibrated selection constraints. We
present two examples where calibration helps to elucidate the main undergoing constraints once calibrated by amino acid evolvability. (A) Analysis of the ssDNA binding protein (SSB) permits identifying strong constraints around (spheres) and in binding regions (green spheres). (B) The infB that encodes the prokaryotic translation initiation factor (IF2) presents strong purifying selection at amino acids with high atomic interactions (spheres). Only amino acids with spheres structure representation show significant constraints patterns once corrected by their evolvability.
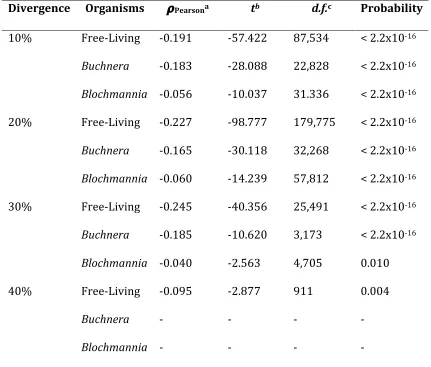
Table 1. Evolutionary rates correlate with amino acids contacts density.
Divergence Organisms ρPearsona tb d.f.c Probability
10% Free‐Living ‐0.191 ‐57.422 87,534 < 2.2x10‐16
Buchnera ‐0.183 ‐28.088 22,828 < 2.2x10‐16
Blochmannia ‐0.056 ‐10.037 31.336 < 2.2x10‐16
20% Free‐Living ‐0.227 ‐98.777 179,775 < 2.2x10‐16
Buchnera ‐0.165 ‐30.118 32,268 < 2.2x10‐16
Blochmannia ‐0.060 ‐14.239 57,812 < 2.2x10‐16
30% Free‐Living ‐0.245 ‐40.356 25,491 < 2.2x10‐16
Buchnera ‐0.185 ‐10.620 3,173 < 2.2x10‐16
Blochmannia ‐0.040 ‐2.563 4,705 0.010 40% Free‐Living ‐0.095 ‐2.877 911 0.004
Buchnera ‐ ‐ ‐ ‐
Blochmannia ‐ ‐ ‐ ‐
aPearson correlation coefficient was utilised, although Spearman coefficient
rendered approximately the same significance levels.
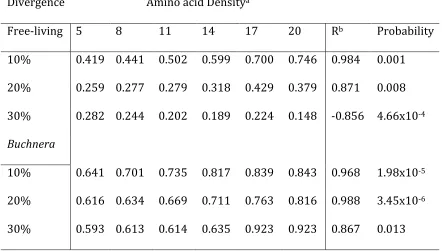
Table 2. Regression of the increments of rates of evolution over categories of amino acid contact densities.
Divergence Amino acid Densitya
Free‐living 5 8 11 14 17 20 Rb Probability
10% 0.419 0.441 0.502 0.599 0.700 0.746 0.984 0.001
20% 0.259 0.277 0.279 0.318 0.429 0.379 0.871 0.008 30% 0.282 0.244 0.202 0.189 0.224 0.148 ‐0.856 4.66x10‐4
Buchnera
10% 0.641 0.701 0.735 0.817 0.839 0.843 0.968 1.98x10‐5
20% 0.616 0.634 0.669 0.711 0.763 0.816 0.988 3.45x10‐6
30% 0.593 0.613 0.614 0.635 0.923 0.923 0.867 0.013
aAmino acid density is calculated as the number of amino acids within 4
Angstroms radius of the residue. We calculated distances between amino acids using the Euclidean distance.
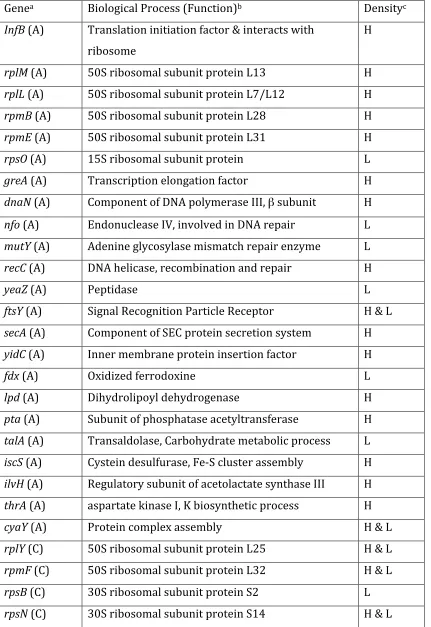
Table 3. Proteins evolutionarily accelerated (A) or constrained (C) identified after structural calibration of evolutionary rates.
Genea Biological Process (Function)b Densityc
InfB (A) Translation initiation factor & interacts with ribosome
H
rplM (A) 50S ribosomal subunit protein L13 H rplL (A) 50S ribosomal subunit protein L7/L12 H rpmB (A) 50S ribosomal subunit protein L28 H rpmE (A) 50S ribosomal subunit protein L31 H rpsO (A) 15S ribosomal subunit protein L greA (A) Transcription elongation factor H dnaN (A) Component of DNA polymerase III, β subunit H
nfo (A) Endonuclease IV, involved in DNA repair L mutY (A) Adenine glycosylase mismatch repair enzyme L recC (A) DNA helicase, recombination and repair H
yeaZ (A) Peptidase L
ftsY (A) Signal Recognition Particle Receptor H & L secA (A) Component of SEC protein secretion system H yidC (A) Inner membrane protein insertion factor H
fdx (A) Oxidized ferrodoxine L
lpd (A) Dihydrolipoyl dehydrogenase H
rpsT (C) 30S ribosomal subunit protein S20 L ssb (C) ssDNA binding protein, DNA recombination L ftsZ (C) Essential cell division protein, Cytokinesis H groS (C) GroEL co‐chaperone, protein folding H & L mscS (C) Mechanosensitive channel, cellular water
homeostasis
L
era (C) GTP binding protein, cell cycle L
a Gene name
b Protein product and its biological function.
c Amino acid density calculated as the number of amino acids within 4 Angstroms