Blood Flow Modelling of Linear and Sequential
Bypass Coronal Vessels of the Heart
N.V. Sviridova
*, V.D. Vlasenko
Computing Center, Far Eastern Branch, Russian Academy of Sciences, Russia
Copyright©2016 by authors, all rights reserved. Authors agree that this article remains permanently open access under the terms of the Creative Commons Attribution License 4.0 International License
Abstract The paper presents results of blood flow
parameters numerical simulation in the coronal vessels of the left coronary artery. Described mathematical model characterizing the hemodynamics of the coronary artery blood vessels allows the simulation of blood flow parameters changes in the coronal vessels subjected to bypass surgery. On the basis of this model blood flow parameters of linear and sequential bypasses types were calculated and compared.Keywords Hemodynamic Model, System of the
Equations of Hemodynamic, Blood Flow, System of the Left Coronary Artery, Linear Bypass, Sequential Bypass1. Introduction
The tasks of modelling and study of blood flow are sharp object of attention of many scientists thanks to the extraordinary importance of them in theoretical, as well as in practical terms. Application of mathematical modelling of hemodynamics reveals ample opportunities for applications in the area of health monitoring of a person's cardiac vessel system, the choice of adequate methods of treatment, etc. Modelling of hemodynamic parameters in a system of vessels that were exposed to bypass is one of the relevant tasks. Currently applied methods of arterial and venous bypass coronal stenosed arteries are of two types - linear and sequential (sequential) bypass. Sequential grafts have a number of advantages, however, are more difficult for prosthetics. The results of numerical modelling carried out on the basis of a mathematical model of hemodynamics for the left coronary artery system which in the framework of assumptions confirms the best characteristics of sequential grafts in comparison to linear ones are presented in the work. It will help to select the most suitable method of grafting.
2. Geometric Model
For hydrodynamic research of epicardial circulation in a
left coronary artery system the geometric model must base on anatomy and physiology data. This model for the right type of coronary blood circulation (RCA – dominant). Geometric models of various level of detail are proposed in the works devoted to research of blood flow in the heart arteries. This work uses an arterial circle of blood circulation consisting of the 16 main vascular branches from an aorta to the wall of a myocardium the geometric characteristics of which are based on data of an autopsy study that is presented in [1]. All vessels included in the left coronary artery model can be classified as follows:
1. The stem of the left coronary artery which communicates with an aorta on the entrance.
2. Vessels coming from the "parent" vessel and separated in the right border into two "daughter" vessels (bifurcation). 3. Terminal arteries are vessels not having minor vessels. This work considers the case of two stenoses and their anatomical localization is chosen so as to obtain a pathological model to reflect the occurrence close to the real clinical surgical situation. For relative simplification of a model the affected vessel is not passable.
Localization of stenoses is selected as follows. The first is located in a segment of the left anterior descending artery with narrowing of its lumen for 1.5 cm distal to the branches of the diagonal artery. The second area of stenosis was located in the place of the first diagonal branch, with narrowing to 1.5 cm. Geometry data of modeled grafts are characterized as follows. Linear grafts have a diameter of 4.5 mm and a length of 12 and 15 cm for simulation of overlapping the first and second region of stenosis, respectively. A sequential graft had the same diameter and length of 15.5 cm with the length of the proximal anastomosis, i.e. artificial connection between the two vessels, of 12 cm. Thus, in the geometric model of the left coronary artery appear an additional area – the graft connecting directly to the aorta and the area of the affected vessel just outside the area of stenosis.
Mathematical model of the hydrodynamics of the epicardial coronary circulation of the left coronary artery is based on one-dimensional Navier - Stokes equations. Basic parameters are averaged over the cross section the flow velocity along the vessel (и), averaged intracoronary blood pressure (p) and the cross-sectional area of the vessel (s). The time-dependent Navier-Stokes equations in the task consists of the continuity and speed equation, that is, the conservation of mass and momentum, as follows
The blood flow in the circulatory system is generally described by the equations for the three-dimensional unsteady viscous, non-Newtonian fluid, together with the equations of dynamics of elastic vessels' shells. However, the following common approach to modeling in hemodynamics, blood will be treated as a homogeneous incompressible Newtonian medium. In this case, the movement of blood through the vessels described by the following system of nonlinear hyperbolic partial differential equations of the first order:
+
=
ρ
+
∂
∂
+
∂
∂
=
∂
∂
+
∂
∂
,
2
,
0
2 R ef
f
p
u
x
t
u
x
s
u
t
s
(1)where t – time, x – longitudinal coordinate, ρ - density of the blood, which is considered to be constant and equal to 1.055 g/cm3, fе – external force, f
R – the frictional force due to the
viscous properties of blood [2].
We assume that the investigation is carried out under normal operating conditions, when the cardiovascular system is not subject to external influences. Thus, further consider the case fе = 0.
Despite the fluctuating nature of blood flow, the friction force fR corresponds to the Poiseuille resistance for laminar
fluid flow in a circular tube, the assumption of the relative smallness of the numbers of Vomersli typical for the problem [3]. In these circumstances, additional inertial and viscous losses arising from the distortion of the velocity profile in an oscillating flow is not much different from those in the steady Poiseuille flow and the frictional force can be defined as follows:
s
u
f
Rπν
=
8
,where ν – kinematic viscosity.
For circuit the hemodynamics system you must describe the interaction between the blood flow and the elasticity of the vessel wall. Typically, this is done using a semi-empirical equation of cross-sectional area of the pressure in the flow. There are various expressions for recording of this dependence [4].
We define the linear relationship between the pressure inside the vessel and its cross-sectional area according to the following formula [1]
))
(
1
(
)
(
p
s
0p
P
ds
s
=
=
+
β
−
.This ratio includes a dependence on the elastic properties of the vascular wall and its geometrical data. Hereafter, the index 0 indicates that the above value corresponds to the minimum pressure during the diastolic phase – Pd. The above
properties are taken at this pressure. Factor β depends on the elastic properties of the vessel wall, characterized by a Jung's modulus – E, wall thickness – h and diameter D, as follows
Eh D0
=
β
.According to [5] depending on the belonging of the arteries to the big or small circle of blood circulation, as well as their structure, the ratio h/Do has a certain value, as is typical for the problem sufficiently close to the value of 0.01, which is used in the work.
We supplement the considered system of equations with initial and boundary conditions. As initial conditions for the area of coronary blood flow we select the diastolic pressure and the lack of blood flow to all branches, i.e.
=
=
.
0
)
0
,
(
,
)
0
,
(
x
u
P
x
p
dThe boundary conditions are defined as follows. Firstly, we define them at the inlet to the area, i.e. the mouth of the left coronary artery. The works devoted to the modeling of blood flow in the coronary arteries, blood flow parameters in the aorta, often explicitly specified on the basis of very limited observations. Since this area is quite difficult to define the boundary conditions that would reliably reflect the hemodynamic characteristics of the flow, then the simulation of more realistic boundary conditions we use described in [4] the 0-dimensional model of the circulatory system, which has no spatial resolution, but allows us to describe the circulatory system in general, using variable time-flow parameters. This model includes six basic areas of human cardiovascular system, which are characterized by blood pressure and blood flow. The system of equations of 0-dimensional model of the circulatory system is as follows:
+ − = − = − − = − = − − = − + = + − = − = − − = − = − − = − + = , , , , , , , , , , , , 1 1 1 8 4 4 12 8 4 4 10 11 6 11 10 7 9 10 4 10 8 9 5 9 8 6 7 8 3 8 5 3 3 7 4 5 3 3 4 2 2 6 4 2 2 4 5 3 5 4 3 3 4 2 4 2 3 2 3 2 2 1 2 1 2 1 1 1 1 1 l r r l R R z s R z s dt dy R z s y dt dy C y y R y dt dy L y y dt dy C y y R y dt dy L y R R z s dt dy C R R z s R z s dt dy R z s y dt dy C y y R y dt dy L y y dt dy C y y R y dt dy L y R R z s dt dy С
walls, Li – inertial properties of blood, Ri – the resistance to
the blood flow. Function zi – are pressure drops, the value of
which depends on the phase of the cardiac cycle. The coefficients of the equations specific to the case of "normal" functioning of the circulatory system, are defined as follows:
22
.
0
1
=
С
,С
2=
1
.
46
,С
3=
20
,С
4=
0
.
09
,67
.
2
5
=
С
,С
6=
46
.
7
,003751
.
0
8 5 41
=
R
=
R
=
R
=
R
,0675
.
0
2
=
R
,R
3=
1
,R
r=
0
.
0175
,R
l=
0
.
08
,03376
.
0
6
=
R
,R
7=
0
.
1013
,000825
.
0
1
=
L
,L
2=
0
.
0036
,L
3=
0
.
00075
,00308
.
0
4=
L
, 1 121
U
y
E
y
z
=
l+
l−
,z
2=
y
5+
U
r−
y
6E
r,7 6
3
U
y
E
y
z
=
r+
r−
,z
4=
y
11+
U
l−
y
12E
l,where
U
l=
50
A
,U
r=
24
A
,E
l=
0
.
1
+
1
.
375
A
,A
E
r=
0
.
03
+
0
.
3288
,
≥
<
−
=
,
,
0
,
,
2
cos
1
5
.
0
s s st
t
if
t
t
if
t
t
A
π
where ts = 0.4 sec – is the duration of the systolic phase of the cardiac cycle.
Operation of heart valves accounted with the functions si ,
which are defined as follows:
≤
>
=
,
0
,
0
,
0
,1
i i iz
z
s
index i = 1, 2, 3, 4 – corresponds to heart valves.
The initial conditions of 0-dimensional model of the circulatory system are as follows:
132
.
71
1
=
y
,y
2=
8
.
89
,y
3=
70
.
537
,y
4=
67
.
359
,3268
.
3
5
=
y
,y
6=
105
.
46
,416
.
13
7
=
y
,y
8=
0
.
7861
,y
9=
13
.
392
,y
10=
23
.
83
,295
.
11
11
=
y
,y
12=
112
.
76
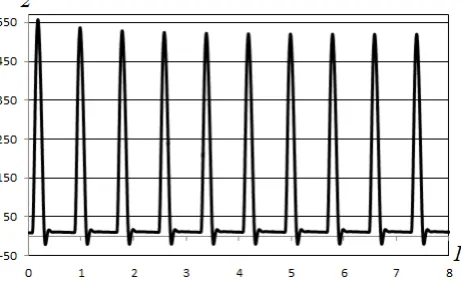
.Thus, the human circulatory system is described by the twelve ordinary differential equations, solving which we define the parameters of the blood flow at the entrance to the aorta. In this model, the pressure in the aorta is characterized by a function y1(t), the blood flow rate – y2(t). These pressure and blood flow rate used as boundary conditions in the inlet region are shown in Fig. 1, 2.
Since the considered area consists of 16 vessels and includes their ramifications, one of the important stages of formulation of the problem is the choice of appropriate
boundary conditions in the extensive network. We define the relations between hemodynamic parameters in the parent and child vessels. For such relations in the field of bifurcation of vascular network we use equations of flow and pressure in the vessels:
=
=
+
=
,
,
3 2 1 3 3 2 2 1 1p
p
p
s
u
s
u
s
u
[image:3.595.315.549.212.354.2]index 1 corresponds to the "parent" vessel, 2 and 3 – "child."
Figure 1. Aortic pressure during normal circulation obtained by solution of 0-dimensional model of the circulatory system; 1 – timeline (sec), 2 – axis of pressure (mm. Hg. Art.)
Figure 2. Blood flow in the aorta with normal circulation, obtained by solving 0-dimensional model of the circulatory system; 1 – timeline (sec), 2 – axis of blood flow (ml/s)
4. The Results of Numerical Calculations
[image:3.595.317.548.402.543.2][4, 8].
As noted in the majority of works devoted to the simulation in hemodynamics, in different modes of operation, in the blood vessels may appear zones with significant longitudinal changes in hemodynamic parameters, and under certain circumstances this may cause high-frequency oscillations in the vessel of the physical nature. As a consequence, the simulation in hemodynamics places high demands on the choice of the numerical method used. As shown in several studies the use of scheme of the first order is ineffective due to the strong dissipation of the circuit. At the same time, the traditional schemes of the second order have their own dispersion properties that are manifested in the form of spurious oscillations of numerical solutions in the fields of high gradients. The solution to this problem, as noted by the authors of work [1] can be the use of schemes that do not allow the emergence of false oscillation. So one of the successful examples of such schemes is used in works [4, 8] TVD-approach, the basic idea of which is that the calculation is carried out throughout the second order of accuracy, except for areas with a sharp change in the parameters, where the circuit is switched on to the first order
of accuracy. This transition is ensured by the use of special limiting functions. This approach avoids the main problems associated with the selection order of accuracy of the numerical method.
TVD - method was applied to the above mathematical model for calculating the hemodynamic characteristics in the heart left coronary artery. The results were compared to literature data observations. A match between modelling results and results of immediate observations [9] was revealed.
4.1. Results of Modelling of Hemodynamics in Case of Linear Bypass
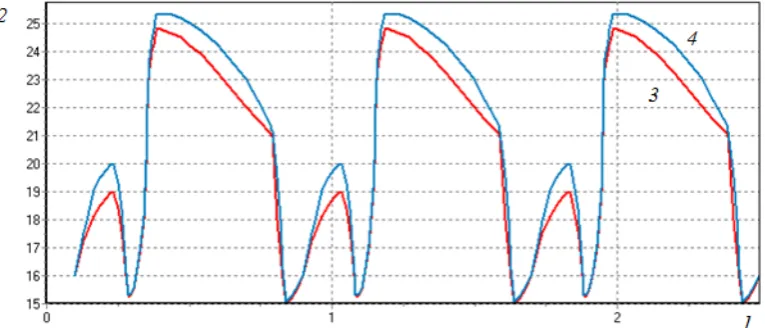
[image:4.595.123.494.561.718.2]Using the geometric characteristics of grafts and stenosis of blood vessels, were calculated parameters of the blood flow in case of overlapping linear grafts, the results of which are shown in Fig. 3 and 4. To identify the changes taking place, the figures also show the results of a numerical solution for the given area of the vascular system of the left coronary artery in normal coronary circulation.
Figure 3. The data for the pressure in the anterior descending coronary artery with normal circulation (line 3 – red) and coronary circulation after linear bypass (line 4 – blue) on the area, located proximally to the second diagonal branch and distal to the area of stenosis; 1 – timeline (sec), 2 – axis of pressure (mm. Hg. Art.)
From the above figures shown that in the case of a linear bypass the behavior of the curves of pressure and blood flow in general terms follows the curves of the relevant parameters with the normal circulation of the blood in the arteries. Blood pressure maintains the character of "aortic" with somewhat higher values of systolic and diastolic pressure than the corresponding normal arteries in similar areas (Fig. 4). The blood flow is significantly reduced (0.13 of normal), as a result of the existence of two areas of stenosis and does not improve significantly after bypass.
4.2. Results of Modelling of Hemodynamics in Case of Sequential Bypass
The results of calculation of parameters of blood flow in the anterior descending coronary artery distal to the affected area of the vessel in the event of the imposition of sequential grafts and the results are specific to the area under the normal circulation, that are shown in Fig. 5 and 6. From the analysis
of Fig. 5, 6 can primarily be noted that after inserting sequential auto venous graft with anastomosis "side-to-side" with the first diagonal branch and anastomosis "end-to-side" with the left anterior descending artery, the profile of the pressure curves and blood flow is more consistent with the characteristic curves of the relevant parameters in the "normal" case than with a linear graft. At the proximal anastomosis "side-to-side" area restored pressure in systolic phase, but diastolic pressure increases, when compared with normal values in the area. This leads to a significant increased (about 28 %) diastolic blood flow compared with normal circulation. Nature of blood flow is mainly diastolic. Presence of an anastomosis leads to increased blood flow in the vessel, which corresponds to a reasonable belief about high levels of passage of sequential grafts.
Thus, the calculations accurately match with the known data, obtained by direct measurement, as described in the literature [9, 10], which allows to conclude the validity of the results obtained by the mathematical model.
[image:5.595.115.496.327.492.2]Figure 5. Comparing data for the pressure in the anterior descending coronary artery with normal circulation (line 3 – red) and coronary circulation after sequential bypass (line 4 – blue) on the area, located proximally to the second diagonal branch and distal to the area of stenosis; 1 – timeline (sec), 2 – axis of pressure (mm. Hg. Art.)
[image:5.595.115.498.542.706.2]5. Conclusions
This mathematical model of vascular hemodynamics of coronary artery not only produces sufficiently precise calculation of the parameters of blood flow in the coronary arteries of the heart, but also to allows modeling their changes after surgery with the imposition of graft vessels. The results of numerical experiments for the case of the imposition of linear and sequential grafts, assuming the affected vessel obstruction, show a significant superiority of the second type of bypass, which is important information for choosing a bypass method.
REFERENCES
[1] K. St. Rammos, G. J. Koullias, T.J. Pappou, A .J. Bakas, P.G. Panagopoulos, S. G. Tsangaris, A computer model for the prediction of left epicardial coronary blood flow in normal, stenotic and bypassed coronary arteries, by single or sequential grafting, Cardiovascular surgery, 6 (1998), no. 6, 635-648.
[2] N.V. Sviridova, V. D. Vlasenko. Modelling of Hemodynamic Processes in Cardiovascular System on the Base of Peripheral Arterial Pulsation, Mathematical Biology and Bioinformatics, 9 (2014), no. 1, 195-205. (in Russian) [3] A.M. Bubenchikov, D. K. Firsov, E. V. Albrandt, Numerical
study of fluid flow in blood vessels with aneurysm, Proceedings of international conference RDAMM-2001. Computing technologies, 6 (2001), no. 2, 134-137. (in Russian)
[4] E. V. Astrakhantseva, V. J. Gidaspov, D. L. Reviznikov, Mathematical modeling of hemodynamics of large blood vessels, Mathematical Modeling, 17 (2005), no. 8, 61-80. (in Russian)
[5] Wenhua Ruan, M. E. Clark, Meide Zhao, A. Curcio, Global solution to a hyperbolic problem arising in the modeling of blood flow in circulatory system, Journal of mathematical analysis and applications, 331 (2007), no. 2, 1068-1092. [6] M. V. Abakumov, I. V. Ashtnetkov, N. B. Esikova, V. B.
Koshelev, S. I. Mukhin, N. V. Sosnin, V. F. Tishkin, A. P. Favorsky, A. B. Khrulenko, The technique of mathematical modelling of the cardiovascular system, Mathematical Modeling, 12 (2000), no. 2, 106-117. (in Russian)
[7] Thusitha DS Mabotuwana, Leo K Cheng, Andrew J Pulla Model of blood flow in the mesenteric arterial system, BioMedical Engineering OnLine Journal, 6 (2007), no. 17, 1-12. http://www.biomedical-engineering-online.com [8] E. V. Astrakhantseva, V. Y. Gidaspov, U. G. Pirumov, D. L.
Reviznikov Numerical simulation of hemodynamics in arterial tree. Investigation of vessel compression influence on flow parameters, Mathematical Modeling, 18 (2006), no. 8, 25-36. (in Russian)
[9] I.E. Skalidis, G. E. Kochiadakis, N. E. Igoumenidis, K.E. Vardakis, P.E. Vardas, Phasic coronary blood flow velocity pattern and blood reserve in the atrium: regulation of left atrial myocardial perfusion, Journal of the American College of Cardiology, 41 (2003), no. 4, 674-68.
[10] P.A. Furber, F. Lethimonnier, J. J. Le, P. Balzer, P. Jallet, A.
Tade ́i, P. Geslin, Noninvasive assessment of the