Georgia State University
ScholarWorks @ Georgia State University
Risk Management and Insurance Dissertations Department of Risk Management and Insurance
5-4-2016
Essays on Insurance Markets and Regulation
Yiling Deng
Follow this and additional works at:https://scholarworks.gsu.edu/rmi_diss
This Dissertation is brought to you for free and open access by the Department of Risk Management and Insurance at ScholarWorks @ Georgia State University. It has been accepted for inclusion in Risk Management and Insurance Dissertations by an authorized administrator of ScholarWorks @ Georgia State University. For more information, please [email protected].
Recommended Citation
Essays on Insurance Markets and Regulation
BY
Yiling Deng
A Dissertation Submitted in Partial Fulfillment of the Requirements for the Degree
Of
Doctor of Philosophy
In the Robinson College of Business
Of
Georgia State University
GEORGIA STATE UNIVERSITY ROBINSON COLLEGE OF BUSINESS
Copyright by
Yiling Deng
ACCEPTANCE
This dissertation was prepared under the direction of the Yiling Deng Dissertation Committee. It has been approved and accepted by all members of that committee, and it has been accepted in partial fulfillment of the requirements for the degree of Doctor of Philosophy in Business Administration in the J. Mack Robinson College of Business of Georgia State University.
Richard Phillips, Dean
DISSERTATION COMMITTEE
George Zanjani
Conrad Ciccotello
Martin Grace
Stephen Shore
ABSTRACT
Essays on Insurance Markets and Regulation
BY
Yiling Deng
May 4th, 2016
Committee Chair: George Zanjani
Major Academic Unit: Department of Risk Management and Insurance
The dissertation consists of two essays on insurance markets and regulation. The first
essay studies the timing of state-level tort reform enactments between 1971 and 2005.
Using discrete time hazard models, we find the level of litigation activity---as measured
by incurred liability insurance losses, the number of lawyers, and tort cases
commenced---to be the most important and robust determinant of tort reform adoption.
Political-institutional factors and regional effects---such as Republican control of the state
government, single party control of the legislature and governorship, and a (relatively)
conservative political ideology among a state’s Democrats---are also associated with
quicker reform adoption.
In the second essay, we identify the effect of public guarantees on market discipline by
exploiting the rich variation in U.S. state guarantees of property-liability insurer
obligations. We find government guarantees significantly reduce the sensitivity of
premium growth to changes in financial strength ratings, and that this reduced sensitivity
applies to both price and volume changes. The effects are concentrated among insurers
rated A- or lower by A.M. Best, the leading financial strength rating agency in the
insurance industry. For downgraded insurers, we find that premium growth in business
not covered by state guarantees falls in relation to growth in its covered business, with the
estimate of the difference being as high as 15% for A- rated insurers and 10% for insurers
ACKNOWLEDGEMENTS
First, I would like to thank my family for always supporting me throughout my Ph.D.
studies. I would like to express my deeply gratitude to my parents, Hua Deng and
Daqiong Yi, for always allowing and supporting me to pursue what I want to do with my
life. I am deeply grateful for my beloved and supportive husband, Haibo Yao, and my
exuberant and sweet little boy, Charles Liangyi Yao. Words cannot express my
appreciation for your love, patience, and encouragement.
Second, I am deeply grateful for the support and advice from my advisor and dissertation
committee members in various research projects. As the dissertation chair, Professor
George Zanjani offered exceptional advice and enthusiastic support of my research. I will
always be appreciative for the many hours of his time that he gave me and for his
constant advice, guidance and encouragement. He is not only the chair of my dissertation,
but also the mentor of my scholar career. I am also highly indebted to my doctoral
program committees (in the last name order), Professors Conrad Ciccotello, Martin
Grace, Tyler Leverty, and Stephen Shore. They all offered significant insights and helpful
suggestions to my research. I also want to express my heartfelt thanks to all other
professors in the Department of Risk Management and Insurance, especially Professor
Charlotte Alexander and Ajay Subramanian. Last, I want to thank Ph.D. students at GSU
for emotional support, as well as the CEAR, Huebner Foundation and Risk Management
1
Essay I: What Drives Tort Reform Legislation?
An Analysis of State Decisions to Restrict Liability Torts
ABSTRACT
This paper studies the timing of state-level tort reform enactments between 1971 and
2005. Using discrete time hazard models, we find the level of litigation activity---as measured by
incurred liability insurance losses, the number of lawyers, and tort cases commenced---to be the
most important and robust determinant of tort reform adoption. Political-institutional factors and
regional effects---such as Republican control of the state government, single party control of the
legislature and governorship, and a (relatively) conservative political ideology among a state’s
Democrats---are also associated with quicker reform adoption.
Key words: Tort reform, insurance, liability crisis
2
I. Introduction
Over the past several decades, the United States has experienced several waves of tort
reform. The first wave came in the mid-1970’s, when a number of states enacted reforms such
as caps on non-economic damages, changes to collateral source rules, and limitations on the
application of joint and several liability. This was followed by a larger wave in the mid-1980’s
and another wave in the early 2000’s. Figures A1 through A7 in Appendix A display the timing
of enactment of tort reforms in the various states.
Much research has been devoted to estimating the impact of tort reforms, with many
studies finding that tort reforms have large negative effects on various measures of litigation
activity. However, relatively little attention1 has been paid to the question of why states enact tort
reforms, and, as can be seen in the figures, the propensity to reform apparently varies
significantly across the states. For example, as can be seen in Table 1, Florida has been
extremely aggressive in instituting reforms, while, nearby, South Carolina has stood pat;
similarly, one moves from an aggressive to a passive reform environment when one crosses the
border from Idaho to Wyoming. Why did some states enact tort reforms while others stood pat?
This paper maps out the diffusion of tort reforms across states over time and studies the social,
economic and political factors associated with reform decisions. Specifically, we focus on
adoptions of four of the most common and prominent liability tort reforms---caps on punitive
damages, limitations on joint and several liability laws, caps on noneconomic damages, and
changes to collateral source rules---during the 1971-2005 period.
Several theories may help explain the political process of legal change. Building on the
segmentation offered by Kroszner and Strahan (1999), private-interest or economic theory
(Stigler, 1971; Peltzman, 1989; Becker, 1983) describes the legislative process as one of
competition among interest groups, where well-organized industrial and professional interests
capture rents at the expense of more dispersed groups such as consumers. In the case of tort
reform, lawyers, physicians, the insurance industry, and businesses are all interest groups to be
considered. The public interest theory (Joskow and Noll, 1981) features a benevolent legislature
with a primary concern of social welfare. In this view, lawmakers identify failures in the current
civil justice system and attempt to correct them. A third group of theories emphasize the impact
of political-institutional factors in the legislative process such as Republican versus Democratic
1 An important exception is Harrington (1994), who studies the adoption of automobile insurance no-fault laws in
3
control (Dixit, 1996; and Irwin and Kroszner, 1999), or the nature of state government ideology
(Poole and Rosenthal, 1997; and Berry, 1998). A fourth group emphasizes the impact of
legislative outcomes in nearby polities, seeking to explain the diffusion of law across borders as
being facilitated by, for example, the availability of ideas or templates for reform.2
It is important to recognize that these theoretical approaches are by no means
diametrically opposed, despite some attempts in the literature to cast them as such. To take but
one example, one could imagine interest group lobbying reinforcing a push for reform in the
“public interest” that was inspired by legislation in neighboring states and consistent with the
ideology of the state legislators. This paper recognizes that the factors identified by these
theories may work in concert to influence tort reform enactments. To investigate what drives
reform enactment, we use a discrete time proportional hazard model to explain the timing of tort
reform adoption. We incorporate proxies for the size of various interest groups, the extent of and
costs associated with litigation, political-institutional factors, the liability climate, state insurance
regulation, economic conditions, and the presence of reforms in nearby states, and regional
effects.
Our most robust finding is that various measures of litigation activity are associated with
quicker enactment of tort reform. More lawyers, more tort cases in general jurisdiction courts,
and higher liability insurance costs are all associated with faster tort reform adoption. Other
variables are not consistently associated with tort reforms, with the exceptions of 1) Republican
control of the state government and single party control of the legislature and governorship (both
of which are positively associated with tort reform enactment in many specifications) and 2)
regional effects (with states in the Northeast being significantly less likely to adopt reforms).
Evidence on other influences is mixed. Reform adoption in neighboring states is
associated with quicker adoption in some specifications. We also find some evidence of the
influence of concentrated interest groups, i.e. insurance industry professionals, on quicker tort
reform adoption in some specifications, though it should be noted that seemingly contrary effects
are found for lawyers (more lawyers are associated with quicker adoption in most specifications)
and physicians (more physicians are associated with slower adoption in some specifications).
The paper is organized as follows. Section II provides background on insurance crises
and discusses related literature on tort reforms. Section III describes the hypotheses, proxy
4
variables and data sources. Section IV explains the empirical methods and results. Sections V
and VI show robustness checks and extensions. Section VII concludes.
II. Tort crises and Tort reforms
A. Three Tort Crises in Liability
Since the 1970s, the United States has experienced three “liability crises.” The crises
were characterized by sharp rises in insurance premiums, accounting recognition of liability
losses by insurance companies, and restrictions in coverage. The first crisis happened in the
mid-1970s, and several states enacted tort reforms during that period. The first liability crisis was
especially acute in the area of medical malpractice liability, and it led several states to enact tort
reforms targeted only at medical malpractice. The second liability crisis occurred in the
mid-1980s, and many states passed reforms around this time. Priest (1987) attributes this crisis to the
interpretation of modern tort law. He argues that judicial findings of greater levels of liability in
insurance contracts, combined with a decline in the interest rate, led to insurers increase prices
and restrict coverage. The third and most recent crisis started in the late 1990s and continued
into the early 2000’s.
B. Four Tort Reforms
There are four prominent reforms: caps on punitive damages, limitations on joint and
several liability, caps on noneconomic damages, and reforms to collateral source rules. These
reforms have been most widely analyzed by other researchers and also directly impact the
determination of awards.3 Table 1 shows the states that passed each of these four tort reforms by
decade. Evidently, the largest tort reform wave took place in the 1980s. Table B1 and Figures A1
to A7 in the Appendix illustrate the history of the four tort reform enactments by state since 1971
in detail.
Prior to 1971, most states did not have caps on punitive damages and limitations on joint
and several liability, and no states had caps on noneconomic damages and collateral source
reforms related to general liability.4 Starting in the mid-1970s, however, many states passed
3Two additional reforms that are popular in the literature are contingency fee reform and periodic payments reform.
We include neither in our analysis since only five states (AR, IL, ME, NH, and WY) enact contingency fee reform on general liability and only three states enact periodic payments reform on general liability (OH, RI, and SD) during the sample period. The results do not change materially if we include these reforms along with the other four reforms when analyzing the propensity of states to pass any type of tort reform.
4 “Tort reform on general liability” means that the application of the tort reform was not restricted to medical
5
various reforms to the common law rules under which tort cases are tried in state courts. Most
states enacted at least one of the four tort reforms during the 1970s and 1980s. The first wave of
tort reform during the 1970s mainly targeted lawsuits related to health care, while the second
wave of tort reform enactments during the 1980s was more general (Sloan et al., 1989).
Caps on Punitive Damages Reform Punitive damages are awarded to punish tortfeasors
for malicious and reckless behavior and to deter future misconduct (American Tort Reform
Association, 2012). Punitive damages awards are infrequent but the awards can be enormous and
are often sought in civil lawsuits. Views differ on the predictability and opacity of the awards
(see, e.g., the discussion in Viscusi, 2004 and Eisenberg et al., 2010). Caps on punitive damages
typically limit the amount of award either to a specific dollar amount (e.g. $250,000 in Alabama)
or to a multiple of compensatory damages. Some even prohibit punitive damages entirely.
Joint and Several Liability Reform Joint and several liability permits the plaintiff to
recover damages from multiple defendants or from each defendant individually. If one defendant
does not have enough resources to pay the tort award, the plaintiff can seek restitution from other
defendants. Reform of joint and several liability modifies the joint responsibility that two or
more defendants carry, typically by limiting a defendants’ financial responsibility for harm to a
percent of total damages according to fault. The most common form of the reform is a limit to
the application of joint and several liability in awarding noneconomic damages (Lee et al., 1993).
Caps on Noneconomic Damages Reform Damages for noneconomic losses are for pain
and suffering and are inherently difficult to measure (Sunstein, 2007). The discretion of juries
may result in substantial variation in awards. Caps on noneconomic loss place typically provide
numerical guidelines for the award or provide specific dollar ceilings on awards for
noneconomic damages.
Collateral Source Rule Reform The collateral source rule forbids the use of evidence at
trial that the plaintiff is being compensated from alternative sources such as insurance contracts
(American Tort Reform Association, 2012). Collateral source rule reform typically requires that
court awards be adjusted for compensation from other sources. Thus, total damages awarded at
trial are offset by the amount paid to the plaintiff through other sources such as health insurance,
6
C. Recent Studies of Tort Reform
The literature on tort reforms is vast and goes back at least 30 years. Previous studies
have generally focused on three issues: whether tort limitations have affected the frequency and
severity of claims (e.g. Browne and Puelz, 1999); whether tort reforms have affected insurance
market quantities, such as premiums, losses, or loss ratios (Born et al., 2006); and whether tort
reforms have had a direct influence on health market outcomes, including physician supply, the
practice of defensive medicine, hospital expenditures and health insurance market indicators
(Avraham et al., 2010).
Analyses of the first issue have provided strong evidence that limitations on tort liability
reduce the frequency of claims and the size of claims (Browne and Puelz, 1999; Browne and
Schmit, 2006; and Paik et al., 2013).Analyses of the effect of tort reforms on insurance market
typically indicate that tort reforms reduce insurance losses (Born and Viscusi, 1998, 1994 and
Born et al., 2009), while studies on insurance premiums provide mixed results (Zuckerman et al.,
1991; Lee et al., 1994; and Born and Viscusi, 1994). When examining the 1980s tort reforms,
some researchers have found significant negative effects on general liability insurance costs but
mixed evidence on medical malpractice insurance costs (e.g. Viscusi et al., 1993). Analyses of
the last issue provide evidence that medical malpractice tort reforms have had modest effects on
defensive medicine and physician supply (Kessler et al., 1996, 2005 and Matsa, 2005), and that
reforms lower the cost of health insurance to a certain extent (Avraham et al., 2010; Avraham
and Schanzenbach, 2011; and Karl et al., 2013).5
With respect to the data structure in tort reform studies, there have been a number of
papers examining the effect of liability reforms using either state level data (Viscusi, 1990;
Blackmon and Zeckhauser, 1991; Viscusi, et al., 1993) or firm level data from the NAIC
database (Born and Viscusi, 1994 and 1998; Viscusi and Born, 1995 and 2005). Since liability
insurance claims may develop over long periods, Born et al., (2009) examine the long-run effects
of tort reforms using the developed losses of insurers. Grace and Leverty (2012) show that
restricting attention to ‘permanent’ tort reform (tort reform upheld constitutionally within the
observation period) can enhance the results on insurance market performance.
Although the content of reforms varies greatly across states (for example, the stringency
of a cap is determined by the level and type of the cap), almost all of these papers quantify tort
5 For example, Avraham et al., (2010) find that the enactments of various tort reforms decrease group self-insured
7
reform by using binary variables equal to one for all the years in which reforms are effective and
zero otherwise (with the exception of Hyman et al., 2009, which studies the impact of various
caps). In this paper, we adopt this traditional method of using a dichotomous variable to indicate
tort reform enactments.
III. Hypotheses and Variable Definitions
Our empirical analysis considers the timing of four major tort reforms on general torts
from 1971 to 2005: caps on punitive damages, limitations on joint and several liability, caps on
noneconomic damages, and collateral source rule reforms. The effective year of tort reforms are
obtained by state for the years 1971-2005 from Database of State Tort Law Reforms (Avraham
2011 (4th edition)) and complemented by American Tort Reform Association (www.atra.org).
Among those reforms, caps on punitive damages and limitations on joint and several liability
usually apply to all torts rather than just medical malpractice, as shown in Figure A1 and Figure
A2, whereas caps on noneconomic damages and collateral source rule reforms are often targeted
exclusively at medical malpractice torts, as shown in Figures A3 to A6.
In the remainder of this section we describe the variables and how they connect to
hypotheses suggested by theory concerning the influence of lobbying, public interest,
political-institutional factors, state insurance regulation, and regional effects. All the variables and
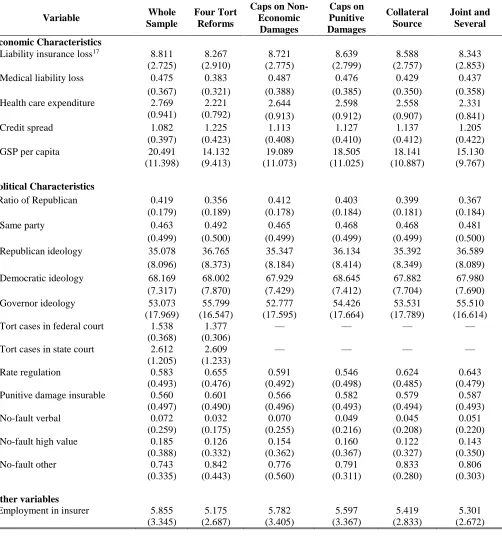
corresponding sources discussed below are described in detail in Table 2. Table 3 reports mean
and standard deviations for the explanatory variables used in the analysis and the average waiting
time for tort reform adoption. In total, there are 1750 observations (50 states with 35 years) in the
whole sample.
Interest Groups
Lawyers, doctors and insurance companies are all concentrated stakeholders with
interests in tort reform. Doctors and insurance companies are typically cast in favor of tort
reform, and lawyers are typically cast in opposition. 1 Lawyers and injured parties, on the other
hand, stand to gain from opposing tort reform. Private interest theory predicts that the legislative
outcome will thus be influenced by the relative power of these groups.
1These characterizations are obviously generalizations based on broad characterizations of self-interest, as well as
8
We use the number of professionals in each of these groups as an indicator of the power
of each group in each state. Specifically, we use per capita employment in the insurance sector
(Employment in insurer) as a proxy for the power of the insurance industry, and the number of
lawyers in the state as a proxy for the power of the legal professionals. Lawyers per capita
(Lawyer) are obtained from the Lawyer Statistical Report and from the American Bar
Association’s annual report.7 Physicians per capita (Physician) is taken from the U.S. Statistical
Abstract for each state and year. The data is not available for each year, so we interpolate values
for the years in which the data are not reported using a method from previous studies (Schmit
and Browne, 2008; and Leverty and Grace, 2012).8
Litigation Activity
In practice, litigation costs are often fingered as a prime motivation for reform adoption.
In theory, litigation activity could either accelerate or delay the reform process. Litigation
produces benefits for plaintiffs and lawyers and costs for defendants. The welfare impact of
restricting litigation requires balancing those costs and benefits, along with the indirect benefits
and costs associated with the tort environment’s impact on business activity and other behaviors.
The prediction of public interest theory thus depends on the outcome of the welfare calculation
and could go in either direction. Private interest theory offers a similar level of nuance: More
litigation activity means more benefits and more costs, raising the stakes for interest groups on
both sides. Thus, the direction of influence of high litigation activity is theoretically ambiguous,
although its prominence in policy debates suggests that it plays an important role and is usually
cast as a motivation for reform action.
Two variables are used to proxy the litigation activity at the state level: Liability
insurance losses and tort cases commenced at the state level. The measure of Liability insurance
loss is the ratio of directed loss incurred in the state to gross state product. The source for the
information is loss data aggregated by state and year over the period 1971-2005 provided by
A.M. Best. The analyses include aggregate loss incurred in medical malpractice, auto liability,
other liability (including product liability before 1992), product liability, and commercial
7 Though both would seem to benefit from litigation, it is possible that plaintiffs’ lawyers and defense lawyers might
have different attitudes toward tort reforms. Our data, however, does not permit us to explore this distinction. 8 We have 21 years of reported data (1971, 1980, 1985, and 1988-2005). Similar to previous studies, we provide
9
multiple liability.9 Well-known caveats to the situation that liability losses reported by insurers in
a given year are subsequently revised years later exists, but we use loss incurred in the current
year to evaluate insurers’ liability loss for three reasons. First, we want to capture the severe of
liability crisis from the insurance companies’ point of view in that year, although insurance
companies may misreport the loss reserve. Second, the motivations and directions for insurance
companies to misestimate the loss reserve are unclear. For example, a firm’s failure to take
account of all the available information could results in misestimating loss reserve but the
directions of loss reserve errors are uncertain. A firm could also deliberately underestimate the
loss reserve to avoid regulator actions or it could overestimate the loss reserve because of future
claims’ uncertainty. Third, the revised loss incurred data is not available by states. We use tort
filings in general jurisdiction courts per capita (Tort cases in state court) as an alternative
measure to proxy litigation activity at the state level. State court data are available for states from
1975 to 2005 from the National Center for State Courts.10
We use the number of tort cases commenced per capita in the U.S. federal courts
nationwide (Tort cases in federal court) to proxy litigation activity at the national level.
Jurisdictional rules only allow cases that involve questions of state law, but are 1) between
citizens of different states or U.S. and foreign citizens and 2) involve more than $75,000 in
losses, to be filed in federal court. The vast majority of tort cases are filed in state courts, not
federal courts. We do not include the federal cases in the same analyses with insurance liability
loss or state tort cases because the time series is highly correlated with the state-level measures
of litigation activity.
It should also be noted that the number of lawyers (as captured in Lawyer), in addition to
being measure of the power of the legal professionals, could also proxy for state-level litigation
activity to the extent that such activity is not fully captured by the tort case or insurance loss
variables.
Political-Institutional Arrangements
Tort reforms are often associated with Republicans as opposed to Democrats, suggesting
that states controlled by Republicans may favor tort reform (e.g. Rubin and Shepherd, 2007;
Finley, 2004). Moreover, one party controlling the legislature and the governorship could also be
9We also include four groups of liability insurance (i.e. other liability insurance loss, medical malpractice insurance
loss, auto liability insurance loss and commercial multiple loss) separately into our regressions. We get similar results in unreported tables.
10
an advantage for getting legislation of any kind passed (see, for example, Kroszner and Strahan,
1999). The political climate and economic environment could also be correlated within regional
areas in the United States. For example, the labels “Conservative” and “Liberal” may suggest
different ideologies in different regions of the country.
We use two political variables from the U.S. Statistical Abstract. We measure the
influence of Republicans in the legislature by the average ratio of the fraction of the Republicans
in the lower house and the upper house (Ratio of Republican). Second, we create a dummy
variable which equals one if the same party controls the governor’s office and has majorities in
both houses. Finally, we use three measures of ideology in the state developed by Berry et al.
(1998): Republican ideology, Democratic ideology, and Governor ideology. These variables
capture the political ideology of the legislators and governor in the state, using the ideologies of
the respective Congressional delegations as a proxy. The indices have high values if the state’s
representatives in Congress are liberal and low values if the state’s representatives in Congress
are conservative (Berry et al., 2011).
Insurance Regulation Environment
Auto liability insurance premiums account for a significant proportion of liability
insurance premiums. No-fault systems provide first party coverage for personal injury protection
(medical cost, loss of income, etc.) while limiting the tort liability of negligent drivers. No-fault
laws can reduce auto insurance costs if there are strong limitations on the right to sue
(Harrington, 1994). In this sense, no-fault legislation could reduce cost pressures associated with
tort environments that are in other respects permissive. However, the presence of a no-fault
system could also create spillover effects to displace tort activity into other liability markets, or
could be reflective of a societal willingness to experiment with tort reform generally. Thus, the
predicted association between the presence of no-fault systems and the propensity to enact other
tort reforms is not clear.
Rate regulation is also an important aspect of the insurance environment. More stringent
regulation may lead to more severe insurance market availability problems in the wake of a
shock---accelerating the legislative process in tort reform.
To measure the effect of state insurance laws, we create five variables. First, we use a
dichotomous variable which equals one if punitive damages are insurable (Punitive damage
11
“prior approval” rate regulation (Rate regulation). “Prior approval” rate regulation is the
toughest type of rate regulation, reflecting circumstances in which rates cannot be used until
approved by the insurance commissioner. Last, we include three variables relating to no-fault
automobile insurance laws. No-fault systems with value thresholds make the right to sue
conditional on compensatory damages exceeding a designated dollar amount. No-fault systems
with a small dollar threshold may thus be ineffective in limiting lawsuits. The benchmark
variable No-fault other equals one for a tort law state or for a no-fault state with a low value
threshold (less than $1000). Another variable, No-fault high value, equals one if a state has a
dollar threshold greater than $1,000 and zero otherwise. States with verbal thresholds have the
strictest no-fault system which allows the right to sue only in the cases where victims have
severe damages such as death, disfigurement, or permanent loss of body function. The variable
No-fault verbal equals one if the state has a verbal threshold and zero otherwise.
Spatial Diffusion
When states pass laws, it may influence the likelihood that neighboring states will also
pass such legislation. Such a relation is called a spatial diffusion effect or state spillover effect.
Diffusion researchers suggest that policymakers often look to the policies adopted by nearby
states to help them draft and make decisions about certain policies (Soule and Earl, 2001). A
state’s tort reform enactment may affect the timing of its neighbors’ tort reform enactments for
several reasons. First, states may be concerned about businesses (e.g. entrepreneurs or
physicians) moving out: if a state’s liability costs are higher than those of their neighbors,
businesses may be driven away. Under this logic, a state is most influenced by the actions of
those states to which its businesses may move. This suggests that a tort reform in one state could
produce competitive pressures for corresponding tort reforms in neighboring states.
Voters may also judge politicians’ performance relative to that of politicians in nearby
states, especially those nearby states with similar ideology. An example of this is given by
Besley and Case (1995), who provide evidence of “yardstick competition.” This could imply that
states are most influenced by the actions of those states that their voters judge to be the most
similar (Baicker, 2001). All of this suggests that tort reforms in one state may have positive
spillover effects on neighboring states, and that the most influential neighbors may be ones with
similar ideological profiles. However, a few researchers have documented significant negative
12
controversial laws when they are in close spatial proximity to other states that enact such laws
(e.g. Soule and Earl 2001, McMahon-Howard et al., 2008). The direction of influence is thus an
empirical question.
We create a continuous variable, State spillover, to capture the influence of tort reforms
in nearby states. The variable captures the proportion of neighboring states that had adopted tort
reforms by the end of the previous year. Neighboring states are defined as states sharing a
border with the state in question.11 We use an alternative proxy, Ideological state spillover, to
measure the proportion of neighboring states with similar ideology enacting tort reforms before
the state in question enacts tort reforms.12
Economic Variables
Overall economic conditions, as well as the conditions in industries susceptible to
litigation, may create pressures for or against reform. We use gross state product per capita (GSP
per capita) as a general economic indicator connected with urbanization and business activity.
The GSP data are from Bureau of Economic Analysis for each state for each year. We use a
credit spread variable (Credit spread) to proxy the investment environment each year, measured
as the difference between the Moody’s seasoned BAA corporate bond yield and the AAA
corporate bond yield. We obtain the corporate bond yield data from the Federal Reserve Bank of
St. Louis’ Federal Reserve Economic Database.
Another potential proxy of interest is health care expenditure as a percentage of
household income (Health care expenditure). If tort reforms are perceived as a means of
reducing health care costs, public interest theory would predict a positive relationship between
this proxy and tort reforms, especially in the area of medical malpractice. Similar logic could be
used to hypothesize a negative coefficient on Physician, as tort reform on medical malpractice
could be a potential means of encouraging more physicians to practice in the state.
Finally, we create four regional indicator variables representing the North, South,
Midwest, and West.
IV. Methods and Empirical Results
11For example, Florida shares borders with Georgia and Alabama. Georgia and Alabama enacted joint and several
liability in 1988 and after 2005, respectively. Thus State Spillover for joint and several liability in Florida is 0 before 1988 and one half from 1988 to 2005.
13
In this section, we first use the non-parametric survival model to determine the shape of
the baseline hazard function. Next, we investigate how the economic and political variables
described above are associated with the timing of tort reform enactments using discrete time
survival models with a Weibull baseline hazard. We start by treating reforms as “competing risk
events,” so that the duration time ends if any of the four tort reforms is enacted. Then we study
each of the four reforms independently.
A. Hazard Analysis with Nonparametric Estimates
To model the duration of the ‘waiting period’ before reform, we need to impose structure
on the hazard function. The Kaplan-Meier product-limit estimator13 offers a nonparametric
estimate of the hazard function over time (Greene 2006). Figure 1 graphs survival estimates for
the data and shows that each hazard function is relatively flat in the 1970’s before dropping
steeply in the mid-1980s and then becoming flat again. The graph also implies that joint and
several liability limits have the shortest waiting time durations, followed by caps on punitive
damages, collateral source rule reforms and caps on noneconomic damages. Figure 1 displays the
survival rate for states based on the enactment of any of the four tort reforms; 87% of states enact
one or more of those tort reforms during the sample period. It shows survival rates for each of
the tort reforms during the sample period: about 40% of states enacted caps on punitive damages,
79% enacted limitations on joint and several liability, 35% enacted collateral source rule
reforms, and 24% of states enacted caps on noneconomic damages. Table B2 presents the results
of the state ‘waiting period spells’ by Kaplan-Meier product limit estimates in detail. Consistent
with Figure A1 to Figure A7, the null hypotheses of equalities of survival functions across the
four tort reforms are rejected by log-rank tests. Survival rates when considering caps on
noneconomic damages and collateral source rule reforms are significantly higher than when
considering caps on punitive damages and joint and several liability, since fewer states enact the
former two tort reforms. Figure 1 also shows that the survival rates when considering the
enactment of any type of reform drops dramatically during the years of 1985 to 1988. However,
the non-parametric method is limited because it cannot provide the impact of independent
variables on the likelihood of events.
13 The Kaplan-Meier product limit formula to estimate the survivorship function for the year is
, where is the number of states enacting tort reforms during
14
B. Discrete Time Proportional Hazard Model
Tort reform enactments and most of the independent variables are only observed once a
year.14 This implies that the observed durations of tort reform should be grouped into yearly
intervals. Moreover, since many of the tort reforms occurred in the mid-1970s or the mid-1980s
as Table 1 shows, there exists the substantial problem of tied duration times. The Cox model (or
any fully parameterized continuous time model) is inappropriate in this case (Cox and Oakes,
1984), because the Cox model is based on the assumption that duration times can be any real
number (rather than certain discrete values corresponding to the number of years), and recorded
duration times need to be ordered chronologically. The high number of ties and the discrete time
property lead to estimation bias in regression coefficients and in the corresponding covariance
matrix.
That the duration variable of interest (time taken to enact the tort reform) is measured
yearly means that the feasible approach to modeling the duration is the discrete-time proportional
hazard model (also called the discrete-time historical event model). The four tort reforms can be
considered as “competing events” in the sense that the state can change its common law civil
justice system by enacting different tort reforms. We consider the period from the beginning of
the sample (1971) until any tort reform occurs as the duration of interest in the analysis. The
states that enacted tort reforms before 1971 are excluded from the analysis as left censored data,
but the states that had not enacted tort reform by 2005 remain in the sample as right censored
data. The data structure of discrete-time duration models is time-series cross-section, which is
organized with as many observations for each state in the sample as there are time periods over
which the state is at risk of experiencing the event of interest (Jenkins, 1995)---the enactment of
a tort reform. The core variable is discrete elapsed time and event occurrence is a series of binary
outcomes denoting whether or not the event occurred at the observation point.
A survival model that can accommodate this structure is a discrete time proportional
hazard model with Weibull baseline hazard. Consider an instantaneous force of mortality given
by:
or (1)
where is the hazard rate function and is the baseline hazard function and is a
vector of covariates. In this setting, the discrete time hazard rate (see, e.g., Allison (1982)) of
14 We recognize that some states are repeat-adopters of tort reforms, and we deal with the problem in robustness
15
enacting tort reform for state i in year with a vector of time-varying covariates, , having
spent years in the same common law civil justice system, can be given by:
(2)
where represents the baseline hazard function of time which can be estimated either
parametrically or nonparametrically. The above function can also be written in complementary
log-log transformation:
(3)
To specify the baseline hazard function , we consider the discrete-time specification similar
to the Weibull model with a shape characterized by p: = where in the discrete
time case approximately corresponds to in the continuous time Weibull model. If is
greater than zero, the hazard increases monotonically, and if it is less than zero the hazard
decreases monotonically.15
The coefficients can be interpreted as the effect of covariates on the hazard rate of
enacting tort reform. Positive coefficients indicate an increase in the hazard rate and thus a
reduction in the duration of the ‘waiting’ period. The exp( represent the hazard ratio of tort
reform enactments for a one-unit change in the covariates because we use the proportional
hazard model. The economic importance of coefficients on covariates can be evaluated by taking
the exponential transform of the coefficients multiplying by the standard deviation of the
explanatory variables.
We first investigate how economic and political variables influence the timing of general
liability tort reform enactments by considering the four reforms together. In other words, an
“enactment” happens, and a state “dies,” whenever it enacts any of the four reforms. Our first
analysis considers the association between tort reform adoption and a set of “core” explanatory
variables, which will subsequently be expanded to include additional covariates.
Table 4 shows the correlation of the core political economy factors. Highly correlated
explanatory variables pose a common problem in empirical studies, especially when the sample
size is limited. Multicollinearity may cause regression results to be unstable and inflate standard
15We use a complementary log-logistic hazard function rather than a logistic function since the process of enacting
16
errors. As shown in Table 4, variables representing private interest groups are correlated with
Liability insurance loss to varying degrees, some significantly so. We address this by using
alternative measures of litigation activity (see Table 6) and also by adding explanatory variables
to regressions sequentially (see, for example, Table 5) to investigate the stability of the empirical
estimates.
Table 5 shows the estimated effects of core time varying covariates on the hazard rate for
the discrete time model with Weibull baseline hazard. We have 825 observations in Table 5 and
use stepwise methods to select variables. Model 1 tests litigation activity costs by including only
two variables: Liability insurance loss; Model 2 adds variables proxy for interest groups; Model
3 adds political-institutional variables, and Model 4 further adds variables representing regions.16
Overall, we document significant positive coefficients for Liability insurance loss, Ratio
of Republicans, Same party and Lawyer, and negative positive coefficient of Physician.
Pressures in the form of higher litigation costs and a relative shortage of physicians seem to be
associated with quicker adoptions. An abundance of lawyers is also associated with quicker
reform, consistent with the litigation activity hypothesis to the extent that greater numbers of
lawyers are indicative of high litigation cost environments. Private interest theory is consistent
with the results to the extent that the general business size---which is presumably concerned with
litigation and health care costs---is interpreted as the predominant private interest. On the other
hand, the evidence concerning specific interest groups is weak and even contrary: Greater
numbers of lawyers, who presumably would oppose reform, are associated with faster adoptions;
Greater numbers of physicians, who presumably support reform, are associated with slower
adoptions. Political-institutional variables reflecting Republicans and same party control of the
government also are significant, with the expected signs.
Table 6 Model 1 shows the estimated effects of all time varying covariates on the hazard
rate for the discrete time model with Weibull baseline hazard. We have 825 observations in
Model 1, which extends models in Table 5 by including all variables. Starting with the economic
variables, higher Liability insurance loss is found to be associated with a higher hazard rate of
tort reform enactment: a one-standard-deviation increase in the Liability insurance loss leads to a
159.0% increase in the hazard of tort reform enactment. With regard to the political-institutional
variables, the structure of the state government---the ratio of Republicans in the legislature,
17
single party control of the government, and the nature of Democratic ideology, all have
significant impacts on the timing of tort reform. Notably, a one-standard-deviation increase in
the Ratio of Republicans leads to an 86.0% increase in the hazard rate. The negative coefficient
on Democratic ideology indicates that a more liberal character in the state’s Democrats delays
tort reform, with a one-standard-deviation increase in the Democratic ideology decreasing the
hazard rate by 45.4%. In addition, Lawyer has a positive effect on the hazard rate of reform
enactment but Physician has a negative but statistically insignificant effect on the hazard rate of
tort reform. A one-standard-deviation increase in lawyers per capita results in a 3.7 times higher
hazard of enacting any kind of tort reform. The regional dummies indicate that states in
Northeast are associated with delayed timing of tort reform.
Model 2 replaces Liability insurance loss with tort case filings in state courts and has 521
observations since it uses only data after 1974, and data from SD,NE,VT, IA, IL, LA, KY, MT,
OK, SC,VA, PA are now omitted due to the lack of information on tort case filings. The
coefficient on tort cases in state general jurisdiction courts in Model 2 indicates a
one-standard-deviation rise in tort cases in state court increases the hazard by 82.5%. Model 3 uses tort cases
filings in federal courts and the coefficient is significantly positive. A one-standard-deviation
increase in tort cases in federal courts increases the hazard by 107.1%. The coefficients on State
spillover and Health care expenditure are not statistically significant in any of the three models.
We then perform the analysis for each of the four reforms individually. The final four
columns of Table 6 show the results for the timing of the enactments of each of the four tort
reforms using the same method. We use Liability insurance loss to proxy the state liability
environment in all individual tort reform models.
Starting with caps on punitive damages (GL_CP) and limits on joint and several liability
(GL_JS), there are 1346 observations in the regression for caps on punitive damages and 982
observations in the regression for limitations on joint and several liability. The positive and
statistically significant coefficients on the Liability insurance loss in both models indicate the
association between higher insurance losses and enactments of both tort reforms, and these
effects are economically important. The coefficient is 0.463 in the punitive damage cap
regression, which means a one-standard-deviation increase in liability insurance loss per GSP
results in a 2.7 times higher hazard of enacting caps on punitive damages. Similarly, the GL_JS
18
136.0% with a one-standard-deviation rise in insurance loss. Lawyer has a positive effect on the
hazard rates in both models: For example, a one-standard-deviation increase in lawyer is
associated with a 2.2 times increase in the hazard of caps on punitive damages reform
enactments.
The structure of the state government influences the timing of joint and several liability
reform as well. Consistent with the political-institutional theory, split control of the branches of
government tends to delay limitations on joint and several liability. The negative and statistically
significant coefficient of Physician indicates that fewer physicians accelerate the timing of joint
and several liability reform. States with fewer physicians are found to have a higher hazard of
enacting tort reform compared with their counterparts: the effect of a one-standard-deviation
decrease in Physician is to increase the hazard by 85.6%. Regional effects also appear to be
present. The results suggest that states in the Northeast regional variables in both regressions are
large in magnitude and have negative signs, which imply the two types of tort reforms occur later
in the Northeast.
Turning to caps on noneconomic damages (GL_CN) and changes to collateral source
rules (GL_CS), there are 1543 observations in the regression for the GL_CN model and 1368
observations in the regression for the GL_CS model. Both tort reforms occur earlier in states
with larger Liability insurance loss. A one-standard-deviation increase in the liability insurance
loss per GSP leads to an increase of 2.3 times in the hazard rate for caps on noneconomic
damages. A one-standard-deviation increase in Liability insurance loss results in 5.2 times more
in the hazard of changes to collateral source rules. The coefficients on Democratic ideology are
negative and statistically significant in the case of collateral source rule reforms. The coefficient
of Employment in insurer is significantly positive for the GL_CS model, a possible indication
that insurers’ lobbying power accelerates the enactment of changes to collateral source rules. A
one-standard-deviation increase in the Employment in insurer leads to a 119.8% increase in the
hazard of changes to collateral source rules. This finding, however, does not appear in the other
models of Table 6.
To summarize the results from the discrete time proportional hazard model in Table 6,
litigation activity is strongly associated with reform adoptions. The most consistent positive and
significant results are those connecting insurance losses and tort cases with reform adoptions.
19
groups in the context of private interest theory. The number of lawyers exhibits a positive
association with tort reform enactments, which is consistent with the hypothesis of high litigation
cost environment. That said, effects of the size of legal professionals and medical professionals
are not found in the evidence. On the contrary, the number of lawyers exhibits a positive and
significant association with enactments and the number of physicians exhibits a negative
association with enactments. This finding could be interpreted as supportive of the public
interest theory, or as indicators of higher liability/medical costs that could mobilize businesses to
lobby for reform as predicted by the economic interest group theory. Political and institutional
factors also help to explain the timing of tort reforms to some extent, as Republican influence,
one-party governments and conservative Democratic ideology are associated with quicker action
in all specifications. We do not find a linkage between the timing of tort reforms and spatial
diffusion effects in Table 6.
V. Robustness Checks
In this section, we test robustness of the results in a variety of ways. We consider a
nonparametric baseline hazard, various analyses aimed at omitted variables problems, permanent
versus transitory tort reforms, different estimation techniques, and alternative explanatory
variables.
Nonparametric Baseline Hazard
To check the robustness of the Weibull baseline hazard, we use a discrete time
proportional hazard model with a nonparametric baseline hazard. To eliminate assumptions
about the functional form of the baseline hazard rate, we add duration dummy variables for time
intervals to the same covariates that are used in the parametric model. This method requires
events to occur in each time period since the hazard rate cannot be estimated for a period with no
events. Since our data has a large number of ties with no events in some years, we split the spell
times into decades with four dummies representing the 1970s, 1980s, 1990s and 2000s to ensure
that there are events occurring in each time interval. The model can then calculate the hazard
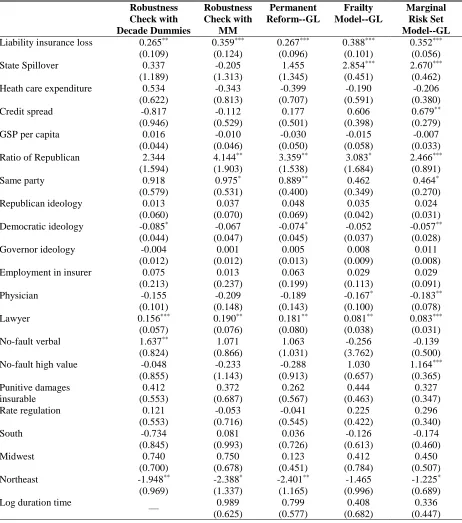
ratio for each decade interval. The results are shown in Table 7 in the first column (Robustness
Check with Decade Dummies). The signs of the significant coefficients are largely consistent
with the results from the previous analysis. The coefficient on the 1980s dummy is significantly
20 Omitted Variables
Many states have enacted a variety of medical malpractice tort reforms to reduce award
and settlement amounts. One problem with other kinds of state tort reform concerns potential
spillover effects. Specifically, medical malpractice tort reforms could either act on, or reflect
changes in, the legislative atmosphere and liability climate in the states. To elaborate, enacting
medical malpractice tort reform may partially relieve a tort liability crisis in a state, leading to a
delayed enactment of tort reforms related to general liability. On the other hand, medical
malpractice tort reform may provide a template for tort reform, or reflect changing attitudes in
the state, and thereby be associated with a higher chance of passing general liability tort reform.
Thus, these medical malpractice tort reforms may proxy for omitted variables that affect the
timing of liability tort reform thereafter.
To proceed, we add four indicator variables to the same set of independent variables that
are used in Model 1 in Table 6, which are set to one in state-years with the corresponding
medical malpractice tort reforms from 1971 to 2005. The Robustness Check with MM in Table 7
shows the results after incorporating these additional controls for medical malpractice tort
reform. The coefficients on four medical malpractice tort reforms are mixed and not significant,
while the signs of the other independent variables are the same and the magnitudes are virtually
unchanged.
Permanent Tort Reform
Tort reform is subject to judicial challenge and is sometimes ruled unconstitutional. Tort
reforms that are ultimately declared unconstitutional (temporary) and those that are unchallenged
or upheld (permanent) may be fundamentally different. For example, Grace and Leverty (2012)
document that 27% of medical liability tort reforms are unconstitutional and provide evidence
that interested groups (e.g. insurers and customers) rationally expect tort reforms to be
permanent or temporary. In our study, 18% of (19 out of 106) general liability tort reforms were
declared unconstitutional. To address this, we redo the analysis by focusing on the enactment of
permanent tort reforms only (a reform is considered “permanent” if it was not declared
unconstitutional before 2011).
Our results in the Permanent Reform-GL column of Table 7 are largely unaffected by the
switch to permanent tort reforms. We have 868 observations in the regression, which is slightly
21
sample until they enact a permanent reform. The signs and magnitudes of the coefficients are
largely the same as in Model 1 of Table 6.
Different Estimation Techniques
Another issue that arises when investigating the timing of individual tort reform
enactment (while ignoring the other tort reforms) is that some states may pass tort reforms
gradually while others pass reforms as a “package.” Thus, considering only the first instance of
any of the four tort reforms wastes potentially relevant information. Analysis of individual tort
reforms, on the other hand, fails to account for the lack of independence of the failure times. We
address these issues by stacking the individual tort reform data and applying the “frailty” model
(Jenkins, 1995 and 1997) and the “marginal risk set” model (Wei, Lin and Weissfeld, 1989;
Spiekerman and Lin, 1996; Box-Steffensmeier and Zorn, 2002). The frailty model explicitly
models the association between the timing of tort reform enactments within a state as a
random-effect term. Equation 2 is extended as:
(4)
with representing random effects which are state-specific unobservables and representing
unobserved heterogeneity. To consider the possibility that different tort reforms have different
baseline hazard functions, we also stratify the data by type of tort reform and use the marginal
risk set model (also called the variance-corrected model), allowing each stratum (tort reform) to
have its own baseline hazard function while adjusting the variance matrix of the estimators to
account for the dependence of tort reform enactments (Box-Steffensmeier and Zorn, 2002). In
Table 7, we report the results of the frailty model in the Frailty Model—GL column and results
of the marginal risk set model in the Marginal Risk Set Model—GL column, respectively.
The results are largely consistent with those already reported. One difference to highlight
is the State spillover coefficient, which becomes large and statistically significant. The State
spillover results are consistent with the notion that states respond to the actions of their
competitors with tort reforms, and that this response is sensitive to the perceived constitutional
strength of the reform in the competing state.
Alternative Measurements
We tried several alternative measurements to further test the robustness of variables. As
22
similar ideological profiles. To address this, we tried an alternative measurement of state
spillovers to better capture the effects of “ideological neighbors.” We include only bordering
states where the neighbor’s state government ideology differs from the state’s own by less than
10 points (Berry et al. (1998, 2011) construct state government ideology on a 100 point scale
based on the estimated ideology values of the governor and of the Republican and Democratic
contingents in the state legislature) in the marginal risk set model with stacked tort reforms. As
shown in Table B4 Alternative A, the coefficient of ideological state spillover has the same sign
and is slightly larger than the coefficient on state spillover.
We tried alternative definitions of several of the political variables. Specifically, we tried
specifications using three indicator variables reflecting party controls in the lower house, upper
house and governorship separately. The coefficient estimates on these variables have same signs,
and the results on other variables are unaffected by the changing of the political-institutional
measures. We also tried an alternative measurement indicating the fraction of state government
controlled by Republicans (Krozner and Strahan, 1998), e.g., one-third if Republicans control
lower house and Democrats control upper house and governorship. As shown in Table B4
Alternative B, the coefficient of Republican control is significantly positive, implying
Republicans accelerate tort reform enactments.
We tried including urbanization in the regressions, which is measured as urban
population divided total population for each state by every decade. Previous research has
identified a positive association between urbanization and the rate of tort filings (Danzon, 1984a;
and Lee et al., 1994); urbanization has also been connected with earlier enactment of tort reform
according to Danzon (1984b). However, this variable does not seem to be associated with
accelerated adoption of tort reforms (beyond what is already captured in GSP), as shown in
Table B4 Alternative C.
The tort reform enactment is on a calendar-year basis. Several states passed tort reform
after July with some of those occurring in October and November. We tried a different definition
of tort reform “effective” enactment: any tort reform enactment after July of year t is treated as
effective tort reform in year t+1. Table B4 Alternative D reports results using new measurement
of tort reform enactment and the result are very similar to previous results with respect to the
23
Since the legislative process can be slow, it is possible that contemporaneous variables
may not capture the real effects of a liability crisis. We explore this further by using the lagged
values of explanatory variables instead of contemporaneous values in the analysis. Table B4
Alternative E reports results using the lagged value of all variables except regions, and the results
are very similar to previous results, except that Northeast becomes insignificant statistically
though with the same sign.
Although the discrete time survival model should be used for our data, we report the
results from a continuous survival model (Weibull proportional hazard model) in Table B4
Weibull Model. The advantage of using the continuous Weibull survival model is that we can
map the change of hazard rate to the change in the expected time to pass tort reforms for a given
change in our interested variables. The results of Weibull proportional hazard model are similar
to those from the discrete time proportional hazard model in Table 6. A continuous survival
model with Weibull distribution has a shape coefficient p. By taking , the new
coefficient represents the percentage change in the time to pass tort reform for a one-unit
change in the explanatory variables. On average, it took a state 18.3 years from the beginning of
the study to pass any kind of tort reform. A one-standard-deviation increase of Liability
insurance loss results in about 1.7 years decrease in the time until enacting any four tort reforms,
2.2 years for a one-standard-deviation increase in Ratio of Republican and 4.5 years for
Lawyer.17
VI. Extensions
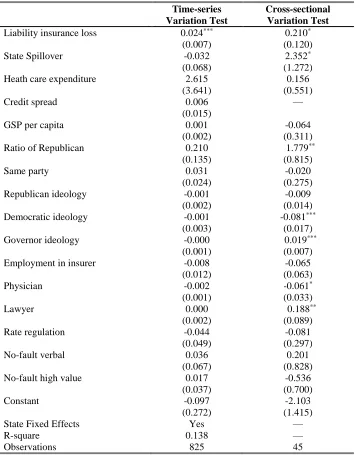
We first run a pooled time-series cross-section OLS regression with state-level dummies
and a fractional logit model with initial values for key explanatory variables to isolate the roles
of time-series variation and cross-section variation in explaining tort reform enactments. We
make another attempt to detect interest group effects by studying differences in reform responses
among the subsample of states experiencing shocks in the 1980s insurance crisis. Finally, we
examine whether similar results are obtained when applying the model to medical malpractice
tort reforms.
17Note that the “time” impact of the explanatory variables is smaller than their impact on the hazard rates due to the