http://dx.doi.org/10.4236/as.2015.612139
How to cite this paper: Julien, C., Bayourthe, C., Lacroux, C. and Enjalbert, F. (2015) Effects of Feeding Programs Based on Oneor Two Milk Replacer Daily Meals on Growth, Solid Feed Intake and Rumen Fermentation and Development of Dairy Calves. Agricultural Sciences, 6, 1428-1440. http://dx.doi.org/10.4236/as.2015.612139
Effects of Feeding Programs Based on One
or Two Milk Replacer Daily Meals on Growth,
Solid Feed Intake and Rumen Fermentation
and Development of Dairy Calves
Christine Julien
1,2, Corine Bayourthe
1,2*, Caroline Lacroux
3, Francis Enjalbert
2,4 1Université de Toulouse INPT ENSAT, UMR1388 Génétique, Physiologie et Systèmes d’Elevage, Castanet-Tolosan, France2INRA, UMR1388 Génétique, Physiologie et Systèmes d’Elevage, Castanet-Tolosan, France
3UMR INRA ENVT 1225, Interactions Hôte Agent Pathogène, Ecole Nationale Vétérinaire de Toulouse 23,
Chemin des Capelles, Toulouse, France
4Université de Toulouse INPT ENVT, UMR1388 Génétique, Physiologie et Systèmes d’Elevage, Toulouse, France
Received 16 November 2015; accepted 18 December 2015; published 23 December 2015
Copyright © 2015 by authors and Scientific Research Publishing Inc.
This work is licensed under the Creative Commons Attribution International License (CC BY). http://creativecommons.org/licenses/by/4.0/
Abstract
Sixteen Holstein calves were used to study the effects of two feeding programs (FP) on growth, in-take, rumen development and ruminal metabolism from birth to weaning. Two feeding programs based on milk replacer (MR) were tested: a once a day (OAD) MR (200 g/L) distribution vs. a stan-dard twice a day (TAD) MR (125 g/L) distribution. All calves received water, wheat straw and a starter concentrate ad libitum. Four calves per group were slaughtered at weaning and rumen ep-ithelium from the ventral sac was sampled for papillae (RP) density. Results showed that the FP had no effect on body weight of calves and total feed intake. From day 42 to day 56, ruminal pH was lower (P = 0.036) and ruminal oxydo-reducing potential was higher (P = 0.001) in OAD than TAD calves. Ruminal total volatile fatty acid (VFA) concentrations did not significantly differ be-tween FP. From day 21 to day 63, butyrate ruminal concentration was significantly higher in OAD than TAD calves (5.17 vs 3.95 mmol/L). This probably explained the higher development of RP in calves fed once daily. Finally, the tested feeding system based on a once daily MR distribution af-fects the concentrate feeding pattern of calves.
Keywords
Dairy Calves, Milk Replacer, Feeding Frequency, Oxydo-Reducing Potential, Rumen Development
1. Introduction
For dairy farmers, successful rearing of heifers targeting a future productive dairy cow is associated with eco-nomic and efficient management but also with labor simplification. Actually, raising heifers is an expensive and time-consuming investment for dairy farmers, specifically during the pre-weaning period. Current dairy farmers practice is to provide calves with whole milk or milk replacer (MR) twice a day and encourage starter intake to promote anatomical and functional development of the rumen before weaning. Because of the increasing size of herds, reduction of work load is one of the main criteria for dairy producers to decide the feeding strategy of dairy calves. Consequently, some farmers are choosing simplified feeding programs in order to save time with-out compromising digestive health and growth performance.
Early-life feeding of calves is decisive for subsequent productivity of dairy cows [1]. Studies tackling the question of quantity of MR [2]-[4] or milk feeding frequency [5]-[7] during early calf-rearing are well docu- mented in literature. Formerly, Galton and Brakel [8] stated that feeding MR once daily reduced labor without affecting health, weight gain, or starter consumption of calves weaned at 40 days of age. However, growth per-formances were very low in their experiment: average daily gain (ADG) from birth to 6 weeks for calves fed once daily was 290 g/d compared to 280 g/d for those fed twice daily. Currently, in French dairy farms, objec-tives regarding calves in the pre-weaning phase are to double weight from birth to weaning (i.e. ADG of 750 g/d from birth to weaning on average) and to attain a daily consumption of 2 kg of starter concentrate just before weaning at 2 months of age on average.
Providing calves with MR once a day is already a common practice in French dairy farms for calves from 3 weeks of age to weaning but feeding calves once a day from the first week of life is unusual. A way to combine labor reduction and animal performances is to provide daily high quantity of MR once a day, i.e. in a limited volume ranging from 2 to 3.5 L.
Consequently, the present study aimed at evaluating two different feeding programs differing on MR compo-sition, distribution and feeding frequency (once or twice a day) from 5 days of age to weaning and their respec-tive effects on growth, solid feed intake, rumen development, ruminal physicochemical and fermentarespec-tive para-meters of calves.
2. Materials and Methods
2.1. Calves, Experimental Design and Diets
All animal housing and handling procedures were in accordance with the guidelines for animal research of the French Ministry of Agriculture [9]. Two groups of eight male Holstein calves each (mean initial body weight (BW) = 45.9 ± 5.7 kg at birth) were involved in the trial from birth (d 1) to weaning (d 63). They were imme- diately separated from their mother at birth (d 1) and placed in individual pens (1.05 × 2.30 m, bedded with straw) without any contact with adult animals. At birth (d 1), they received colostrum in two equal meals. Then they received 2 L of whole milk twice a day (0800 and 1600 h) until d 4 in the morning. On d 4 in the evening, they received an oral rehydratant (Vitactif sachet repas, Chasseneuil du Poitou, France) mixed in 2 L of water to manage a transition between whole milk and MR distribution beginning on d 5. Two feeding programs were tested: 1) one based on a once a day (OAD) MR distribution (200 g/L, Technique Once a Day®, Bonilait Protéines, Chasseneuil du Poitou, France) and 2) another based on a standard twice a day (TAD) MR distribution (125 g/L). Both MR were formulated by the same supplier (Bonilait-Protéines, Chasseneuil-du-Poitou, France) with the same proportion of dairy proteins but were different in terms of skim milk powder and/or whey protein contents. They had similar chemical compositions: on average 20.8% crude protein (CP) and 18.0% fat, on a dry matter (DM) basis (Table 1). Calves were randomly allocated to a feeding program on d 5 in the morning.
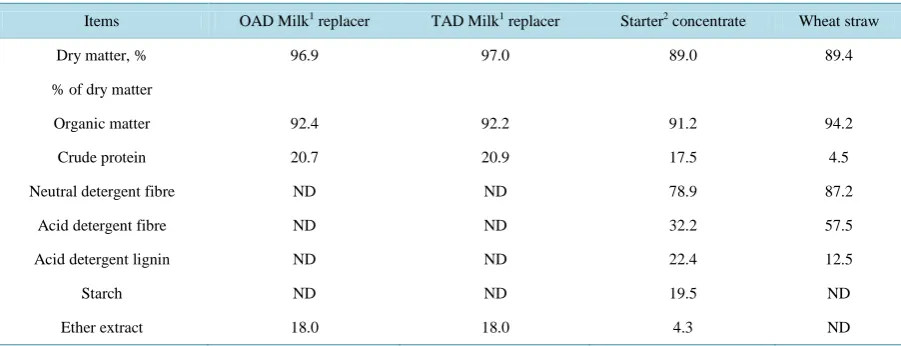
Table 1. Chemical composition of milk replacers, starter concentrate and wheat straw fed to calves.
Items OAD Milk1 replacer TAD Milk1 replacer Starter2 concentrate Wheat straw
Dry matter, % 96.9 97.0 89.0 89.4
% of dry matter
Organic matter 92.4 92.2 91.2 94.2
Crude protein 20.7 20.9 17.5 4.5
Neutral detergent fibre ND ND 78.9 87.2
Acid detergent fibre ND ND 32.2 57.5
Acid detergent lignin ND ND 22.4 12.5
Starch ND ND 19.5 ND
Ether extract 18.0 18.0 4.3 ND
OAD = calves received MR once a day (200 g/L of MR); TAD = calves received MR (125 g/L of MR) twice a day; MR = milk replacer. 1Contained skim milk powder, buttermilk, concentrated milk proteins, whey powder, vegetal and dairy fat, products and by products of wheat; vitamin A (25000 UI/kg), vitamin D3 (10000 UI/kg), vitamin E (60 mg/kg), vitamin B1 (10 mg/kg), vitamin K3 (2 mg/kg), vitamin C (150 mg/kg), Fe (80 mg/kg), Cu (10 mg/kg), Se (0.25 mg/kg), lysine (1.27%), methionine (0.55%); Bonilait-Protéines, Chasseneuil du Poitou, France. 2Contained vitamin A (10080 UI/kg), vitamin D3 (3100 UI/kg), Cu (25 mg/kg), Zn (124 mg/kg), I (1.24 mg/kg), Co (0.23 mg/kg), Se (0.31 mg/kg).ND = not determined.
2.2. Growth Performances
The calves were weighed on d 1 before the first colostrum meal and then on a 7-day interval basis until weaning (d 63). Average daily gain was calculated between birth and weaning and also separately from d 1 to d 22 and from d 22 to d 63.
2.3. Feed Intake and Apparent Total Tract Digestibility
Amounts of MR, starter concentrate and straw offered and refused were individually and daily recorded. Chem-ical composition of each feedstuff was determined from samples taken at the beginning, in the middle and at the end of the experimental period.
Approximately 1 h after the morning meal, spot fecal samples were collected over 5-consecutive days during weeks 4 and 9 for each calf. They were immediately frozen for subsequent analysis. The diet organic matter (OM) digestibility was calculated from fecal CP as suggested by Lukas et al. [10] and already used by Lohakare et al. [11] for dairy calves before weaning (35 to 70 days of age):
Y = 79.76 − 107.7e(−0.01515×X),
where X is fecal CP concentration (g/kg OM) and Y is diet OM digestibility (%).
2.4. Ruminal Sampling
Samples of whole ruminal contents were obtained from each calf during its first 24 h of life and then every 7 days over the 9 weeks of the experimental period. Ruminal content samples (approximately 200 mL) were col-lected via a stomach tube (internal diameter 13 mm, sterilized before use with 2% Steranios (Centravet 803910, disinfection of surgical and medical equipment) 1 h after the milk morning meal and just before the distribution of straw and starter concentrate. Ruminal pH and oxydo-reducing potential (Eh) were measured as described by Rey et al. [12]. Then, a representative aliquot (50 g) was strained through a metal sieve (1.6-mm mesh) and 25 g of the filtrate was acidified to pH 2 with 50% H2SO4. Subsamples (8 mL) were frozen at −20˚C for later
deter-mination of volatile fatty acids (VFA) and ammonia (NH3-N) concentrations.
2.5. Rumen Development Parameters
and weighed individually. Rumen epithelium was sampled at a standardized location (ventral sac) and fixed in a neutral 10% formaldehyde solution. Rumen papillae (RP) were counted on three 1 cm2 areas by image analysis (Visilogue 6.5 Noesis, France). Other samples were embedded in paraffin, and serial histological sections were stained with hematoxylin and eosin for morphometry analysis under light microscope: two slides for each tissue sample were prepared. Morphometry analysis involved papillae length (L), and width at basis (Wb) and at sum-mit (Ws). For each tissue sample, 20 to 25 measurements were done on each slide using an optical binocular microscope (Leica Wild M3C, Leica, France) coupled via a digital camera to a computer equipped with an im-age analysis software (Visilogue 6.5 Noesis, France). The absorption surface was calculated as [L × (Wb + Ws)/2] × RP × 2. The mucosa (epithelium, chorion and submucosa) was also observed for histopathological in-vestigation.
2.6. Chemical Analysis
The concentrations of VFA were determined using the gas chromatographic method of Playne [13], modified by Marden et al. [14]. The determination of NH3-N was based on the modified Berthelot reaction with the Skalar
Method, followed by a colorimetric test [15]. Dry matter and OM content of samples were determined by oven drying at 104˚C for 24 h (48 h for feces) and by ashing at 550˚C for 12 h, respectively. Crude protein was ana-lyzed using a RapidN Cube (Elementar, Donaustrasse 7, Hanau, Germany). Acid detergent fiber (ADF), neutral detergent fiber (NDF) and lignin fractions were determined by means of van Soest extraction protocol [16] using a fiber analyzer (Fiberbag Ankom 220, Macedon, NJ, USA): NDF was assayed without heat stable amylase and expressed inclusive of residual ash; ADF was expressed inclusive of residual ash and lignin was determined by solubilization of cellulose with sulphuric acid (72%).
2.7. Statistical Analysis
All data were analyzed using R.3.1.1 software and were reported as mean values with standard error. Data deal-ing with several measurements within animal over time were analyzed as a mixed model with repeated measures with calf as random effect, age and feeding program as fixed effects. Three periods were focused on: 1) d 1 to d 63 as total experimental period, 2) d 21 to d 63 as part of the experimental period (high growth period) and (3) d 42 to d 56 as part of the experimental period (last three weeks before switching to a once a day MR distribution for all the calves). Data not dealing with several measurements within animal over time were analyzed as a li-near model with calf as random effect and feeding program as fixed effect. Regarding ADG, total starter con-centrate and straw intakes, three periods were focused on: 1) d 1 to d 63 as total experimental period, 2) d 1 to d 21and (3) d 22 to d 63. Differences were considered significant at P ≤ 0.05 and trends were discussed at 0.05 < P ≤ 0.10.
3. Results
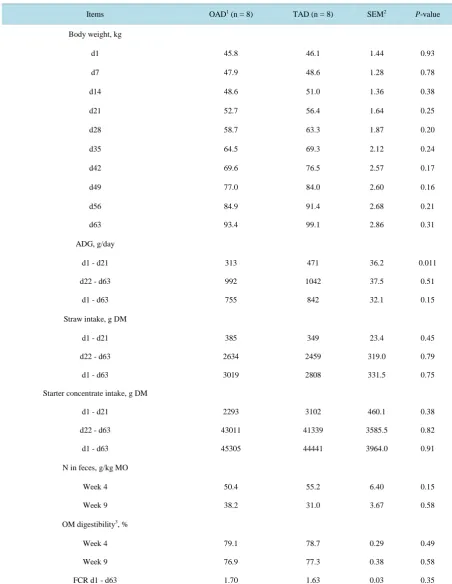
The results concerning the effect of feeding program on growth, solid feed intake, fecal nitrogen concentration and organic matter digestibility in calves from birth to weaning are presented in Table 2. Solid feed intake, i.e. starter concentrate and straw, varied considerably with age but were not affected by feeding programs (P > 0.05). Calves ate an average of 2.9 kg DM of straw and 44.9 kg DM of concentrate from birth to weaning.
Table 2. Effect of feeding program on growth, solid feed intake, fecal nitrogen concentration and organic matter digestibility in calves from birth to weaning.
Items OAD1 (n = 8) TAD (n = 8) SEM2 P-value
Body weight, kg
d1 45.8 46.1 1.44 0.93
d7 47.9 48.6 1.28 0.78
d14 48.6 51.0 1.36 0.38
d21 52.7 56.4 1.64 0.25
d28 58.7 63.3 1.87 0.20
d35 64.5 69.3 2.12 0.24
d42 69.6 76.5 2.57 0.17
d49 77.0 84.0 2.60 0.16
d56 84.9 91.4 2.68 0.21
d63 93.4 99.1 2.86 0.31
ADG, g/day
d1 - d21 313 471 36.2 0.011
d22 - d63 992 1042 37.5 0.51
d1 - d63 755 842 32.1 0.15
Straw intake, g DM
d1 - d21 385 349 23.4 0.45
d22 - d63 2634 2459 319.0 0.79
d1 - d63 3019 2808 331.5 0.75
Starter concentrate intake, g DM
d1 - d21 2293 3102 460.1 0.38
d22 - d63 43011 41339 3585.5 0.82
d1 - d63 45305 44441 3964.0 0.91
N in feces, g/kg MO
Week 4 50.4 55.2 6.40 0.15
Week 9 38.2 31.0 3.67 0.58
OM digestibility3, %
Week 4 79.1 78.7 0.29 0.49
Week 9 76.9 77.3 0.38 0.58
FCR d1 - d63 1.70 1.63 0.03 0.35
1OAD = calves received MR once a day (200 g/L of MR); TAD = calves received MR (125 g/L of MR) twice a day; MR = milk replacer. 2SEM =
Table 3.Effect of feeding program on ruminal physicochemical (n = 10 per calf) and fermentation parameters (n = 10 per calf) during pre-weaning period.
Items P-value3
OAD1 TAD SEM2 FP A FP × A
Physicochemical parameters
Eh4, mV −81 −115 10 0.059 <0.001 0.88
pH 6.13 6.36 0.06 0.97 0.37 0.10
Fermentation parameters
Volatile fatty acids
Total, mmol/L 73.2 69.1 3.0 0.92 <0.001 0.65
Acetic acid, mmol/L 44.9 41.9 1.7 0.79 <0.001 0.20
Propionic acid, mmol/L 21.9 21.6 1.2 0.86 <0.001 0.75
Butyric acid, mmol/L 4.2 3.6 0.2 0.16 0.003 0.84
Acetic acid, % 65.1 63.8 0.8 0.35 <0.001 0.56
Propionic acid, % 26.3 28.4 0.7 0.15 <0.001 0.87
Butyric acid, % 6.0 5.1 0.4 0.26 0.83 0.80
Ammonia nitrogen, mg/L 71.5 48.6 4.5 0.072 0.36 0.75
1
OAD = calves received MR once a day (200 g/L of MR); TAD = calves received MR (125 g/L of MR) twice a day; MR = milk replacer. 2SEM = standard error of the mean. 3FP = feeding program; A = age effect; FP×A = interaction effect between feeding program and age. 4Eh, = oxydo-reduc-
ing potential.
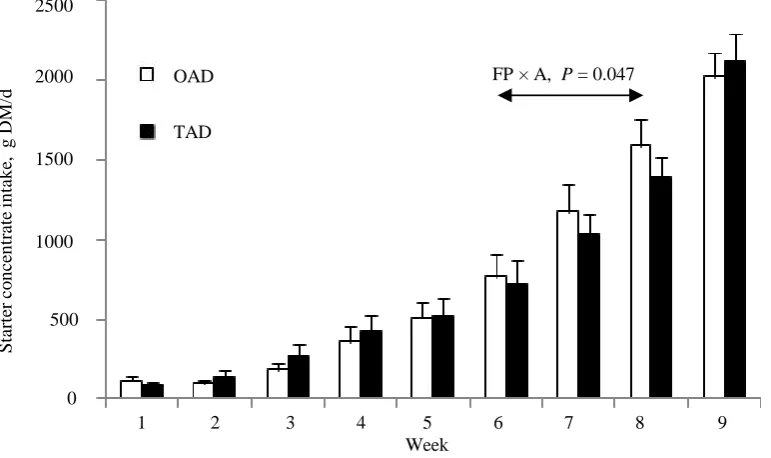
Figure 1. Effect of feeding program on starter concentrate intake pattern with the age of calves by week (w) during the pre-
weaning period. Vertical bars show standard errors.OAD = calves received MR once a day (200 g/L of MR); TAD = calves received MR (125 g/L of MR) twice a day; MR = milk replacer; FP = feeding program effect; A = age effect; FP × A = inte-raction effect between feeding program and age.
1 2 3 4 5 6 7 8 9
2500
2000
1500
1000
500
0
S
tar
te
r
co
n
ce
n
tr
at
e i
n
tak
e,
g
D
M
/d
Week OAD
TAD
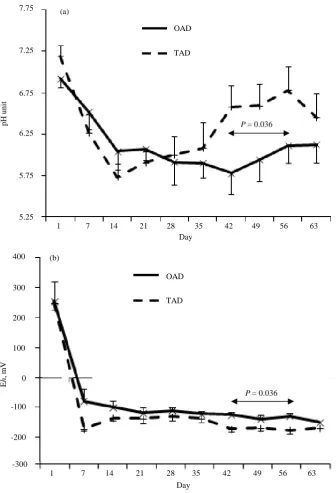
[image:6.595.123.509.446.675.2]Figure 2. Effect of feeding program on evolution of pH (a) and oxydo - reducing potential (Eh; b) with the age of calves during the pre-weaning period. Vertical bars show standard
errors. OAD = calves received MR once a day (200 g/L of MR); TAD = calves received MR (125 g/L of MR) twice a day; MR = milk replacer.
from d 7 to d 63 (Figure 2(b)). Values tended to differ with feeding program over the pre-weaning period (P = 0.059): −81 and −115 mV for OAD and TAD calves, respectively. A significant effect of feeding program was observed for Eh values recorded between d 42 and d 56 (P = 0.001).
Total and individual VFA ruminal contents varied with age of calves from birth to weaning but were not signifi-cantly affected by feeding program: total VFA concentration averaged 71.2 mM (Table 3). No effect of feeding program was observed on the evolution of total VFA, acetate and propionate contents with the age of calves during the preweaning period (Figures 3(a)-3(c)). However, from d 21 to d 63, butyrate ruminal concentration
1 7 14 21 28 35 42 49 56 63
P= 0.036 7.75
7.25
6.75
6.25
5.75
5.25
p
H
u
n
it
Day OAD
TAD (a)
1 7 14 21 28 35 42 49 56 63
Day 400
300
E
h
, mV
200
100
0
-100
-200
-300
P= 0.036 OAD
Figure 3. Effect of feeding program on evolution of ruminal total (a) volatile fatty acids (VFA), acetate (b), propionate (c) and butyrate (d) content with the age of calves during the pre-weaning period. Vertical bars show standard errors. OAD = calves received MR once a day (200 g/L of MR); TAD = calves received MR (125 g/L of MR) twice a day; MR = milk replacer.
1 7 14 21 28 35 42 49 56 63
Day 120 100 T o ta l v o la ti le f atty aci d s, mmo l/L 80 60 40 20 0 OAD TAD (a)
1 7 14 21 28 35 42 49 56 63
Day 70 60 A ce tat e, mmo l/L 50 40 20 10 0 OAD TAD (b) 30
1 7 14 21 28 35 42 49 56 63
Day 45 40 P ro p io n at e, mmo l/L 35 30 10 5 0 OAD TAD (c) 15 25 20 Day
1 7 14 21 28 35 42 49 56 63
9 8 B u ty rat e, mmo l/L 7 6 2 1 0 OAD TAD (d) 3 5 4
was significantly higher for OAD than TAD calves: 5.17 and 3.95 mM, respectively (Figure 3(d)). Ruminal NH3-N content did not vary with age (P = 0.364) whereas it tended (P = 0.072) to differ between feeding
pro-grams: 71.5 and 48.6 mg/L for OAD and TAD calves from day 1 to day 63, respectively (Table 3).
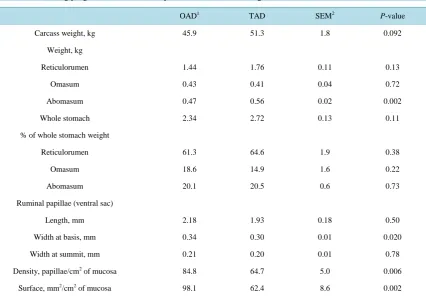
At slaughter, CW tended to differ (P = 0.092) between OAD and TAD calves and was 45.9 and 51.3 kg, re-spectively (Table 4). Total stomachs weight (5.2% of CW on average) and relative weights of reticulo-rumen (62.9%), omasum (16.8%) and abomasum (20.3%) did not differ between feeding programs. The RP density was higher (P = 0.006) for OAD (84.8 RP/cm2) than TAD calves (64.7 RP/cm2) and no pathologic abnormality was detected. The absorption surface of ruminal epithelium was 57% higher (P = 0.002) for OAD than TAD calves.
4. Discussion
[image:9.595.112.539.400.696.2]It should be emphasized that in the present experiment, we studied the effect of two calves-feeding programs differing mainly on MR allowance and distribution frequency. Feeding dairy calves once a day first aimed at saving time for dairy farmer. However, growth performances must be maintained without jeopardizing future replacing heifers. This study showed that both dietary programs reached the growth objective of doubling birth weight at weaning: 93.4 and 99.1 kg for OAD and TAD calves, respectively. Dairy calves had an average ADG of 799 g/d from birth to weaning at 63 days of age, which met the objective of approximately 750 g/d. Similar values were reported by Terré et al. [4] who recorded a 790 g/d ADG for calves receiving a conventional feed-ing program and weaned at 47 days of age, and Jasper and Weary [3] who observed a 780 g/d ADG for calves receiving whole milk ad libitum and weaned at 42 days of age. In our experiment, growth pattern of calves dif-fered among diets: over the three first weeks of life, ADG was significantly lower for OAD (313 g/d) than for TAD calves (471 g/d) but did not differ thereafter, averaging 1017 g/d. This suggested that an early switch to a once a day distribution of MR 1) was nutritionally stressful for calves and 2) temporarily did not allow to com-pletely meet the calves requirements since dry feed consumption was numerically lower for OAD
Table 4. Effect of feeding program on rumen development in calves at weaning.
OAD1 TAD SEM2 P-value
Carcass weight, kg 45.9 51.3 1.8 0.092
Weight, kg
Reticulorumen 1.44 1.76 0.11 0.13
Omasum 0.43 0.41 0.04 0.72
Abomasum 0.47 0.56 0.02 0.002
Whole stomach 2.34 2.72 0.13 0.11
% of whole stomach weight
Reticulorumen 61.3 64.6 1.9 0.38
Omasum 18.6 14.9 1.6 0.22
Abomasum 20.1 20.5 0.6 0.73
Ruminal papillae (ventral sac)
Length, mm 2.18 1.93 0.18 0.50
Width at basis, mm 0.34 0.30 0.01 0.020
Width at summit, mm 0.21 0.20 0.01 0.78
Density, papillae/cm2 of mucosa 84.8 64.7 5.0 0.006
Surface, mm2/cm2 of mucosa 98.1 62.4 8.6 0.002
1
(2293 g) than TAD (3102 g) calves before day 21. So, in our study dry feed consumption did not begin earlier with OAD program. This result contradicts those of Jasper and Weary [3], Terré et al. [17] and Morrison et al. [18] who showed that increasing the intake of nutrients from MR delayed or decreased starter intake. However, our results corroborated those of Kmicikewycz et al. [6] who showed that increasing feeding frequency from two to four meals per day decreased starter intake before week 3 but increased it thereafter. In our experiment, OAD calves had numerically higher starter concentrate intake than TAD calves from week 6. The significant interaction observed between age and feeding program from d 42 to d 56 underlined this rapid increase of starter intake, suggesting an ability of calves to compensate the low initial dry feed intake. Finally, the total starter DM intake over the period did not differ between feeding programs: on average calves ate 44.9 kg DM of starter from birth to weaning. Stanley et al. [19] and Kehoe et al. [5] also did not find any change in starter consump-tion between calves receiving the same daily amount of MR whether once or twice a day. Regarding forage in-take, calves ate in average 2.9 kg of wheat straw DM over 9 weeks. On the one hand it represented a negligible energy and protein intake but on the other hand it provided physical fiber which is essential for anatomical de-velopment of the rumen of calves [20].
Kosiorowska et al. [21] observed a heavier reticulo-rumen and omasum in calves fed twice a day a low vo-lume of whole milk (1.6 kg/d) compared to calves receiving a high vovo-lume (3.2 kg/d). In the present study, calves were voluntary fed the same MR volume per meal. It resulted in no alteration of reticulo-rumen relative weight whereas abomasum of OAD calves was heavier than that of TAD calves (P = 0.002): this could be ex-plained by a shorter time for emptying abomasum in TAD than OAD calves. Warner and Flatt [22] showed that the rumen increased from 30% to 70% of total tissue weight of pre-ruminant stomach of cattle during the pre-weaning period. In accordance with these observations, we showed that the reticulo-rumen represented an average of 62.3% of whole emptied stomach weight at weaning.
Ruminal pH pattern from birth to weaning greatly differed between OAD and TAD calves. At birth, rumen is a neutral milieu (7.06 pH units on average) as already observed by Rey et al. [12]. In the present experiment, there was a tendency (P = 0.10) for a feeding program × age interaction: pH values drastically decreased since birth to reach a nadir value at d 14 for TAD (pH = 5.73) calves and at d 42 for OAD calves (pH = 5.78). This delay could relate to the numerically lower starter intake before 3 weeks of age in OAD than TAD calves. Moreover, pH was significantly lower for OAD calves from d 42 to d 56, which could also be due to their strongly increasing starter intake. In parallel, total VFA ruminal content dramatically increased from birth to d 14 and tended to stabilize afterwards. Butyrate ruminal content was significantly higher (P = 0.04) for OAD than TAD calves from d 21 to d 63.
To go a step further, redox ruminal status was also measured. This is an original parameter which has already been measured in vitro in ruminal fluid [31] or in vivo on dry dairy cows [32], lactating dairy cows [14] [33], heifers [34] and ex vivo in calves [12]. Indeed, ruminal Eh was positive at birth (+253 mV on average whatever was the diet) and then drastically decreased to reach negative values (−149 and −168 mV at d 63 for OAD and TAD calves, respectively) previously observed in rumen of adult cows. Those results are in total accordance with the observations made by Rey et al. [12]. Moreover, ruminal Eh tended to differ between feeding programs from birth to weaning (P = 0.06): Eh was significantly higher in OAD than TAD calves from d 42 to d 56. Dur-ing this period, starter intake was higher (P = 0.047), ruminal pH was lower and butyrate ruminal content was higher in OAD calves than TAD calves. As a consequence, the clear-cut relationship observed by Baldwin and Emery [35] between the metabolic rate of rumen microorganisms and Eh was obvious, especially just before weaning when rumen can be considered as physiologically mature.
Total tract digestibility of DM was evaluated on N fecal content as already made by Lohakare et al. [11] for dairy calves fed MR twice a day and weaned at 70 days. It was not influenced by feeding program: OM digesti-bility averaged 78.9% on week 4 and 77.1% on week 9 which is in accordance with results obtained by Loha-kare et al. [11]. However, our sampling periods for digestibility measurements did not correspond with periods where rumen pH and Eh differed between OAD and TAD calves, which could have masked a link between changes of rumen milieu and total tract digestibility.
5. Conclusion
Feeding dairy calves once daily from the fourth day of age to weaning at d 63 permitted to fulfill the objective of growth (body weight higher than 90 kg at weaning) and starter concentrate intake (an average daily starter intake higher than 2 kg DM/d at weaning). However, a growth depression was clearly observed from d 1 to d 21 for calves fed once a day: during this period, a less MR consumption was not balancing by higher starter concen-trate intake. The feeding frequency (one or twice a day) modifies ruminal metabolism, especially a couple of weeks before weaning when physicochemical parameters (pH and Eh) and butyrate concentration differed. This change probably explained the higher development of ruminal papillae in calves fed once daily. Finally, the tested feeding system based on a once daily milk replacer distribution certainly affects the concentrate feeding pattern of calves: it needs to be studied more in details in the future.
Acknowledgements
We gratefully acknowledge the farm team at the Borret Dairy Farm (Poucharramet, F-31070) for their technical assistance, especially Brigitte Gestes. We thank a lot Corinne Pautot and Carole Bannelier for laboratory tech-nical assistance. We also thank Bonilait-Protéines, particularly Ludovic Ducrocq, for milk replacers donation.
References
[1] Soberon, F., Raffrenato, E., Everett, R.W. and Van Amburgh, M.E. (2012) Preweaning Milk Replacer Intake and Ef-fects on Long-Term Productivity of Dairy Calves. Journal of Dairy Science, 95, 783-793.
http://dx.doi.org/10.3168/jds.2011-4391
[2] Diaz, M.C., Van Amburgh, M.E., Smith, J.M., Kelse, J.M. and Hutten, E.L. (2001) Composition of Growth of Holstein Calves fed Milk Replacer from Birth to 105-Kilogram Body Weight. Journal of Dairy Science, 84, 830-842.
http://dx.doi.org/10.3168/jds.S0022-0302(01)74541-9
[3] Jasper, J. and Weary, D.M. (2002) Effects of ad Libitum Milk Intake on Dairy Calves. Journal of Dairy Science, 85, 3054-3058. http://dx.doi.org/10.3168/jds.S0022-0302(02)74391-9
[4] Terré, A., Devant, M. and Bach, A. (2007) Effect of Level of Milk Replacer Fed to Holstein Calves on Performance during the Preweaning Period and Starter Digestibility at Weaning. Livestock Science, 110, 82-88.
http://dx.doi.org/10.1016/j.livsci.2006.10.001
[5] Kehoe, S.I., Dechow, C.D. and Heinrichs, A.J. (2007) Effects of Weaning Age and Milk Feeding Frequency on Dairy Calf Growth, Health and Rumen Parameters. Livestock Science, 110, 267-272.
http://dx.doi.org/10.1016/j.livsci.2006.11.007
[6] Kmicikewycz, A.D., da Silva, D.N.L., Linn, J.G. and Litherland, N.B. (2013) Effects of Milk Replacer Program Fed 2 or 4 Times Daily on Nutrient Intake and Calf Growth. Journal of Dairy Science, 96, 1125-1134.
[7] McCullough, S.A., Dennis, T.S., Fraley, E., Houin, B. and Nennich, T.D. (2013) Effect of Milk Feeding and Weaning Age on Growth and Intake of Dairy Calves. Journal of Animal Science, 91, 221.
[8] Galton, D.M. and Brakel, W.J. (1976) Influence of Feeding Milk Replacer Once versus Twice Daily on Growth, Organ Measurements, and Mineral Content of Tissues. Journal of Dairy Science, 59, 944-948.
http://dx.doi.org/10.3168/jds.S0022-0302(76)84302-0
[9] Anonymous (198) Arrêté du 18 avril 1988 fixant les conditions d’attribution de l’autorisation d’expérimenter. Journal
Officiel de la République Française, 5608-5610.
[10] Lukas, M., Dekum, K.H., Rave, G., Friedel, K. and Susenbeth, A. (2005) Relationship between Fecal Crude Protein Concentration and Diet Organic Matter Digestibility in Cattle. Journal of Animal Science, 83, 1332-1344.
[11] Lohakare, J.D., van de Sand, H., Gerlach, K., Hosseini, A., Mielenz, M., Sauerwein, H., Pries, M. and Südekum, K.H. (2012) Effects of Limited Concentrate Feeding on Growth and Blood and Serum Variables, and on Nutrient Digestibil-ity and Gene Expression of Hepatic Gluconeogenic Enzymes in Dairy Calves. Journal of Animal Physiology and
Ani-mal Nutrition, 96, 25-36. http://dx.doi.org/10.1111/j.1439-0396.2010.01117.x
[12] Rey, M., Enjalbert, F. and Monteils, V. (2012) Establishment of Ruminal Enzyme Activities and Fermentation Capac-ity in Dairy Calves from Birth through Weaning. Journal of Dairy Science, 95, 1500-1512.
http://dx.doi.org/10.3168/jds.2011-4902
[13] Playne, M.J. (1985) Determination of Ethanol, Volatile Fatty Acids, Lactic Acid and Succinic Acid in Fermentation Liquids by Gas Chromatography. Journal of the Science of Food and Agriculture, 36, 638-644.
http://dx.doi.org/10.1002/jsfa.2740360803
[14] Marden, J.P., Julien, C., Monteils, V., Auclair, E., Moncoulon, R. and Bayourthe, C. (2008) How Does Live Yeast Differ from Sodium Bicarbonate to Stabilize Ruminal pH in High-Yielding Dairy Cows? Journal of Dairy Science, 91, 3528-3535. http://dx.doi.org/10.3168/jds.2007-0889
[15] Krom, M.D. (1980) Spectrophotometric Determination of Ammonia: A Study of a Modified Berthelot Reaction Using Salicylate and Dichloroisocyanurate. Analyst, 105, 305-316. http://dx.doi.org/10.1039/an9800500305
[16] Van Soest, P.J. and Wine, R.H. (1967) Use of Detergent in the Analysis of Fibrous Feeds. IV. Determination of Plant Cell-Wall Constituents. Journal of the Association of Analytical Chemist, 50, 50-55.
[17] Terré, M., Tejero, C. and Bach, A. (2009) Long-Term Effects on Heifer Performance of an Enhanced-Growth Feeding Programme Applied during the Preweaning Period. Journal of Dairy Research, 76, 331-339.
http://dx.doi.org/10.1017/S0022029909004142
[18] Morrison, S.J., Wicks, H.C.F., Carson, A.F., Fallon, R.J., Twigge, J., Kilpatrick, D.J. and Watson, S. (2012) The Effect of Calf Nutrition on the Performance of Dairy Herd Replacements. Animal, 6, 909-919.
http://dx.doi.org/10.1017/S1751731111002163
[19] Stanley, C.C., Williams, C.C., Jenny, B.F., Fernandez, J.M., Bateman Ii, H.G., Nipper, W.A., Lovejoy, J.C., Gantt, D.T. and Goodier, G.E. (2002) Effects of Feeding Milk Replacer Once versus Twice Daily on Glucose Metabolism in Hols-tein and Jersey Calves. Journal of Dairy Science, 85, 2335-2343.
http://dx.doi.org/10.3168/jds.S0022-0302(02)74313-0
[20] Heinrichs, J. (2005) Rumen Development in the Dairy Calf. Advances in Dairy Technology, 17, 179-187.
[21] Kosiorowska, A., Puggaard, L., Hedemann, M.S., Sehested, J., Jensen, S.K., Kristensen, N.B., Kuropka, P., Marycz, K. and Vestergaard, M. (2011) Gastrointestinal Development of Dairy Calves Fed Low- or High-Starch Concentrate at Two Milk Allowances. Animal, 5, 211-219. http://dx.doi.org/10.1017/S1751731110001710
[22] Warner, R.G. and Flatt, W.P. (1965) Anatomical Development of the Ruminant Stomach. In: Dougherty, R.W., Ed.,
Physiology of Digestion in the Ruminant, Butterworths, Washington DC, 24-38.
[23] Warner, R.G., Flatt, W.P. and Loosli, J.K. (1956) Dietary Factors Influencing the Development of the Ruminant Sto-mach. Journal of Agricultural and Food Chemistry, 4, 788-792. http://dx.doi.org/10.1021/jf60067a003
[24] Kristensen, N.B., Sehested, J., Jensen, S.K. and Vestergaard, M. (2007) Effect of Milk Allowance on Concentrate In-take, Ruminal Environment, and Ruminal Development in Milk-Fed Holstein Calves. Journal of Dairy Science, 90, 4346-4355. http://dx.doi.org/10.3168/jds.2006-885
[25] Nocek, J.E., Heald, C.W. and Polan, C.E. (1984) Influence of Ration Physical Form and Nitrogen Availability on Ru-minal Morphology of Growing Bull Calves. Journal of Dairy Science, 67, 334-343.
http://dx.doi.org/10.3168/jds.S0022-0302(84)81306-5
[26] Greenwood, R.H., Morrill, J.L., Titgemeyer, E.C. and Kennedy, G.A. (1997) A New Method of Measuring Diet Abra-sion and Its Effect on the Development of the Forestomach. Journal of Dairy Science, 80, 2534-2541.
http://dx.doi.org/10.3168/jds.S0022-0302(97)76207-6
Different Proportions of Concentrates to Hay on Rumen Development. British Journal of Nutrition, 20, 171-188.
http://dx.doi.org/10.1079/BJN19660021
[28] Sander, E.G., Warner, R.G., Harrison, H.N. and Loosli, J.K. (1959) The Stimulatory Effect of Sodium Butyrate and Sodium Propionate on the Development of Rumen Mucosa in the Young Calf. Journal of Dairy Science, 42, 1600- 1605. http://dx.doi.org/10.3168/jds.S0022-0302(59)90772-6
[29] Tamate, H., McGilliard, A.D., Jacobson, N.L. and Getty, R. (1962) Effect of Various Dietaries on the Anatomical De-velopment of the Stomach in the Calf. Journal of Dairy Science, 45, 408-420.
http://dx.doi.org/10.3168/jds.S0022-0302(62)89406-5
[30] Baldwin, R.L. and McLeod, K.R. (2000) Effects of Diet Forage: Concentrate Ratio and Metabolizable Energy Intake on Isolated Rumen Epithelial Cell Metabolism in Vitro. Journal of Animal Science, 78, 771-783.
[31] Julien, C., Marden, J.P., Troegeler-Meynadier, A. and Bayourthe, C. (2014) Methodology Article: Can Ruminal Re-ducing Power Assessed in Batch Cultures Be Comparable to in Vivo Measurements? Journal of Analytical Sciences,
Methods and Instrumentation, 4, 80-86. http://dx.doi.org/10.4236/jasmi.2014.43011
[32] Julien, C., Marden, J.P., Bonnefont, C., Moncoulon, R., Auclair, E., Monteils, V. and Bayourthe, C. (2010) Effects of Varying Proportions of Concentrates on Ruminal-Reducing Power and Bacterial Community Structure in Dry Dairy Cows Fed Hay-Based Diets. Animal, 4, 1641-1646. http://dx.doi.org/10.1017/S1751731110000972
[33] Julien, C., Marden, J.P., Auclair, E., Moncoulon, R., Cauquil, L., Peyraud, J.L. and Bayourthe, C. (2015) Interaction between Live Yeast and Dietary Rumen Degradable Protein Level: Effects on Diet Utilization in Early-Lactating Dairy Cows. Agricultural Science, 6, 1-13. http://dx.doi.org/10.4236/as.2015.61001
[34] Monteils, V., Rey, M., Cauquil, L., Troegeler-Meynadier, A., Silberberg, M. and Combes, S. (2011) Random Changes in the Heifer Rumen in Bacterial Community Structure, Physico-Chemical and Fermentation Parameters, and in Vitro
Fiber Degradation. Livestock Science, 141, 104-112. http://dx.doi.org/10.1016/j.livsci.2011.05.008
[35] Baldwin, R.L. and Emery, R.S. (1960) The Oxidation-Reduction Potential of Rumen Contents. Journal of Dairy