Simulation and Comparison of Various Queuing
Algo-rithms based on their Performance using CPR Approach
in Detection of LDDoS Attacks
Kamal Preet Kaur
M.Tech Scholar SBSSTC Ferozepur
Navdeep Kaur
Asst. Prof. (ECE Dept.)
SBSSTC, FZR Punjab, India
Gurjeevan Singh
DIC –ECE SBSSTC, PW, FZR
Punjab, India
ABSTRACT
In this paper, the comparison of various queue management algorithms is done based upon use of CPR and without CPR. Congestion Participation Rate (CPR) is novel metric approach proposed for the detection and prevention of LDDoS attacks. As LDDoS attacks does not decrease the number of sending packets when congestion occurs, but TCP does. We will check the effect of using various queue management algo-rithms on the various parameters of the flow of packets such as number of packets sent, received and lost etc.
General Terms
Comparison between normal TCP flow and LDDoS attack flow by using CPR approach using the three queuing man-agement algorithms named REM, RED, DROPTAIL, SFQ and FQ.
Keywords
DROPTAIL, FQ, RED, REM, SFQ, NS2
1.
INTRODUCTION
The computer network is a collection of various networks which are available by different ways. The best known com-puter network is internet. The internet works using various set of rules or protocols called TCP/IP (Transmission control protocol/ Internet Protocol). With the advancement of the internet, the cost of communication has also fallen many folds. With all its advantages, the network is not free from attacks and various types of threats. The attacks can corrupt the computer or sometimes the whole network. The security goals integrity, confidentiality and availability are difficult to ensure. It is becoming a part of everyone’s life. As the internet is growing day by day, security has become a major issue. Everyone wants security on the internet, for securing the in-formation some technique is required which assures the pro-tection of the internet [2].
2.
NETWORK SECURITY
The security is a very important for today’s internet. Some-time ago, the Internet was only known to professionals. It was a new limitless source of information, used by very few. Net-work security is the foremost plan for the today’s internet as the number of attacks are increasing day by day. Today, the Internet has become an essential part of our lives. It is the source of accessing our banking records, credit card state-ments, tax returns and other highly sensitive personal
infor-mation. With all the beneficial things the Internet offers us, it also source of serious, potentially devastating threats. The information provided on the internet in the form of IP address is often used by intruders and virus software to attack the computer. The information's confidentiality is compromised if a person is able to enter a computer that he is not allowed to. He/she may then get the information not planned to be availa-ble for that person. He/she may even distribute the infor-mation [1].
3.
ATTACKS
The various types of attacks are:
Eavesdropping: Interception of communications by an unau-thorized party is called eavesdropping. Passive eavesdropping is when the person only secretly listens to the networked mes-sages. On the other hand, active eavesdropping is when the intruder listens and inserts something into the communication stream. This can lead to the messages being distorted. Sensi-tive information can be stolen this way [2].
Viruses: Viruses are self‐replication programs that use files to infect and propagate [2]. Once a file is opened, the virus will activate within the system.
Worms: A worm is similar to a virus because they both are self‐replicating, but the worm does not require a file to allow it to propagate [2]. There are two main types of worms, mass‐mailing worms and network aware worms. Mass mail-ing worms use email as a means to infect other computers. Network‐aware worms are a major problem for the Internet. A network‐aware worm selects a target and once the worm ac-cesses the target host, it can infect it by means of a Trojan or otherwise.
Trojans: Trojans appear to be compassionate programs to the user, but will actually have some nasty purpose. Trojans usu-ally carry some consignment such as a virus [2].
Phishing: Phishing is an attempt to obtain confidential infor-mation from an individual, group, or organization [3]. Phish-ers trick usPhish-ers into disclosing pPhish-ersonal data, such as credit card numbers, online banking credentials, and other sensitive information.
called intruders or attackers. The identity of the intruder is hidden by different means making detection and prevention difficult. With the current IP protocol technology, IPspoofed packets cannot be eliminated [2].
Denial-of-Service: Denial of Service is an attack when the link through which the data travels gets congested, receiving too many requests. These types of attacks tend to cease the whole system, which is why these are considered to be the most dangerous attacks these days [6]. In our study we will discuss types of DoS attacks and perform the experiments on one of them. These are DDoS and LDDoS.
Distributed Denial-of-Service attacks (DDoS):
A DDoS attack can be defined as an attack which uses a large number of computers to launch a synchronized Denial of Ser-vice (DoS) attack against a single machine or multiple victim machines. Using client/server technology, the executor is able to multiply the effectiveness of the DoS attack significantly by harnessing the resources of multiple unaware assistant computers, which serve as attack platforms [2].
LDDoS attacks:
Traditional flooding-based DDoS attacks employ a ‘‘sledge-hammer’’ approach of high-rate transmission of packets, which obviously distinguishes themselves from normal data flows in statistical characteristics. Many of the proposed ap-proaches for detecting DDoS attacks have been based on these statistical characteristics. LDDoS attacks are quite different from the traditional flooding-based DDoS attacks as they exploit the vulnerabilities in TCP’s congestion control mech-anism. Instead of sending continuous network traffic, an LDDoS attacker sends periodically pulsing data flows, which may dramatically reduce the average rate of attack flows. LDDoS attacks have already been observed in the Internet2 Abilene backbone, thus presenting a new challenge to the security of the Internet [1].
As we know LDDoS attack consists of multiple LDoS attack flows. We model LDDoS attacks to detect and filter LDDoS attack flows. We use four parameters (Ta; Tb; Rb; s) to de-scribe an LDoS attack flow, where Ta is the LDoS attack period, Tb is the LDoS attack burst width (or pulsing width), Rb is the LDoS attack burst rate (or pulsing rate), and sis the starting time of the attack flow. We assume that all the LDoS attack flow starts from the same point at the same time and also the time gap between the consecutive LDDoS attack flows remains the same. The two LDDoS attacks used in our experiment are:
AFI (Attack Frequency Intensification):
The first category represents the LDDoS attacks whose aggre-gate attack period is equally distributed among n flows. The attack frequency of the aggregate flow is intensified by n times, compared to the frequency of each attack flow. [1] AWI (Attack burst Width Intensification):
The second category corresponds to the case when the aggre-gate burst width of an LDDoS attack is equally distributed among n flows. An attack burst of a flow is immediately fol-lowed by a burst from another flow. In this case, the attack burst width of the aggregate attack flow is intensified by n times. [1]
4.
CPR and CAS:
CPR is the first metric which can detect the LDDoS flows. As TCP flow avoids network congestion and LDDoS flow does not, based on this CPR approach is used to detect LDDoS
attack flows. We conduct experiments or simulations on NS2 and evaluate the performance of CPR based approach. It is worth noting that CPR based approach is designed to distin-guish between TCP-flow and LDDoS-flow. We have used the several active queue management algorithms to check the effect of various algorithms on TCP flow; LDDoS attack flow and their CPRs [11].
A CPR-based detection module is installed at router, where most normal TCP packets are dropped when an LDDoS attack is present. For comparison, we also install a module based on Cumulative Amplitude Spectrum (CAS) [12] at router; CAS uses Discrete Fourier Transform (DFT) to locate anomalies caused by LDDoS flows. CAS distinguishes LDoS flows from normal TCP flows using their spectrum difference in low frequency band. It works well for small-scale LDoS attacks.
5.
INTRODUCTION TO QUEUING
AL-GORITHMS
A queuing algorithm manages the access to the fixed amount of out port bandwidth by selecting which packet should be transferred and which one should be dropped when queue limit is fully in use. There are many different queue schedul-ing algorithms to provide the balance between complication, control and fairness. Congestion occurs when packets arrive faster at out port than they can be transmitted. The task of queue scheduling algorithms is to decrease the congestion and to provide fair bandwidth to each of different data competing for bandwidth on the output port. It also furnishes protection between different services on output port, so that weakly be-haved service in one queue cannot crash the bandwidth deliv-ered to the other services. In our simulation we are using the Drop Tail, Fair Queuing (FQ), Stochastic Fair Queuing (SFQ), Virtual queuing (VQ) and Random Exponential Mark-ing (REM) algorithms [2].
The various queuing algorithms which have been used in our study are:
5.1
RED:
(Random Early Detection) works by randomly (based on cer-tain probability) discarding packets at the nodes of the net-work, before the occurrence of congestion, when the average queue length exceeds the predefined minimum threshold. When the average queue length exceeds the maximum thresh-old, the probability of rejection becomes equal to 1. RED monitors the average length of the queues by discarding or ECN-marking packets based on statistical probability. If the buffer is nearly vacant, all incoming packets are received. As there is increase in use, the probability of discarding recently arrived packet also increases. When the buffer is occupied, all incoming packets are deleted. RED has no QoS differentiation in the basic version. The versions WRED (Weighted RED) and RIO (RED with In and Out), which consider the QoS into account. [6]
5.2
DROPTAIL:
acknowl-edgments and begin increasing the size of its congestion win-dow. [6]
5.3
FQ:
Fair Queuing is an algorithm having motive to allocate fair bandwidth among different flows [7]. This algorithm main-tains a separate queue for each flow and discrimination of traffic sources may be based on packet size or sending rate of source computers. These queues are served by the router in sort of round robin. Fair Queuing is based on finishing time of each packet. It calculates the finishing time of each packet residing at the head of each queue and compares this finishing time. The packet having shortest time is transmitted first.
5.4
SFQ:
Stochastic Fair Queuing is an implementation of Fair Queu-ing. Stochastic Fair Queuing uses a hash algorithm to divide the traffic over a limited number of queues [8]. Due to the hashing in SFQ multiple sessions might end up into the same bucket. SFQ changes its hashing algorithm so that any two colliding sessions will only work for a small number of se-conds.
5.5
VQ:
The AVQ algorithm establishes a virtual queue whose capaci-ty which is called virtual capacicapaci-ty is less than the actual ca-pacity of the path. When a packet arrives in the real queue, the virtual queue is also updated to replicate the new arrival. Packets in the real queue are patented/dropped when the vir-tual buffer overflows. The virvir-tual capacity at each link is then adapted to ensure that the total flow incoming each link achieves a desired employment of the link [9].
5.6
REM:
Random Exponential Marking differs from RED only in the first two design questions; it uses a different definition of congestion measure and a different marking probability func-tion. The first design of REM is to stabilize both the queue around a small target and the input rate around link capacity, regardless of the number of users sharing the link. Each productivity queue that implements REM maintains a variable which is called ‘price’ as a congestion evaluation measure. The second idea of REM is to use the addition of the link prices along a path as a measure of congestion in the path, and to implant it into the end-to-end marking probability that can be observed at the source [7].
6.
SIMULATIONS
6.1
Simulation setup and results based
up-on using algorithms with normal and CPR
based approach:
The experiments we have conducted are done on the TCP flow and the flow with LDDoS attacks. The main motive here is to examine the effect of using CPR approach with various algorithms on the attack flow. The algorithm in itself is capa-ble of mitigating the attacks as clear from the results. We have applied CPR approach with the algorithms which showed great differences. Congestion participation rate-CPR metric is used. CPR based approach is used to detect and filter LDDoS attacks by their intension to congest the network. A flow with a CPR higher than the threshold is classified as LDDoS flow and hence all its packets are dropped. During network conges-tion, TCP will tend to send fewer packets but LDDoS will no, so we can identify the LDDoS flows.
CPR is the first metric which can detect the LDDoS flows. As TCP flow avoids network congestion and LDDoS flow does not, based on this CPR approach is used to detect LDDoS attack flows. We conduct experiments or simulations on NS2 and evaluate the performance of CPR based approach. It is worth noting that CPR based approach is designed to distin-guish between TCP-flow and LDDoS-flow. We have used the several active queue management algorithms to check the effect of various algorithms on TCP flow; LDDoS attack flow and their CPRs.
6.2
Simulation parameters:
End-to-end delay: it is referred to as the time taken for a network to reach from one end of a network to the other [5]. Minimum end-to-end delay: The delay specifies the mini-mum time it takes for a bit of data to travel across the network from one node or endpoint to another.
Maximum end-to-end delay: The delay specifies the maxi-mum time it takes for a bit of data to travel across the network from one node or endpoint to another.
Packet drop: it occurs when the router which is supposed to relay packets actually discards them [5].
Packet loss: packet loss occurs when one or more packets fail to reach the destination and are lost on the way [5].
Packets sent: The total number of packets which have been sent through a source to the receiver.
Packets received: the actual number of packets which have been received at the destination. It may not be equal to the number of original packets sent.
[image:3.595.317.531.418.534.2]6.3
Simulation results:
Fig 1: End-to-end delay: Normal approach and CPR ap-proach
As clear from the charts, end-to-end delay is more in case of flow using algorithms on the CPR approach as compared to the flow which is using the algorithms on normal approach. If we compare individually, Drop tail, REM, FQ and SFQ show very large difference. RED shows small difference as com-pared to all the other algorithms.
Fig 2: Minimum end-to-end delay 0
0.2 0.4 0.6
Normal CPR
ti
m
e
Droptail
RED
REM
FQ
SFQ
0.009 0.0095 0.01 0.0105
Normal CPR
ti
m
e
Droptail
RED
REM
FQ
[image:3.595.316.529.643.745.2]Both in algorithms on normal approach and CPR approach on the flow, the minimum end-to-end delay is same respectively as clear from the charts. CPR approach shows less minimum end-to-end delay as compared to normal approach.
Fig 3: Maximum end-to-end delay
[image:4.595.52.265.302.413.2]As clear from the charts, the algorithms on CPR approach show more maximum end-to-end delay as compared to the normal approach. If we compare individually, all the algo-rithms show large difference when CPR approach is applied on the flow.
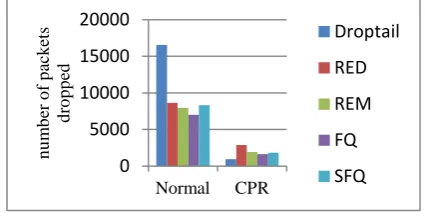
Fig 4: Number of packets dropped
As clear from the charts, when algorithms are applied on the flow with CPR approach, it shows very less packet drop as compared to using on normal approach. Individually all the algorithms shows very large difference.
Fig 5: Number of packets lost
[image:4.595.316.535.340.468.2]The charts show that packets are lost more in case of using normal approach on the flow, in case of using algorithms on CPR approach as clear from the chart, the value of packets lost is far more less as compared to the packets lost in case of normal approach. If we compare individually, all the algo-rithms show very large difference in the values for both the approaches.
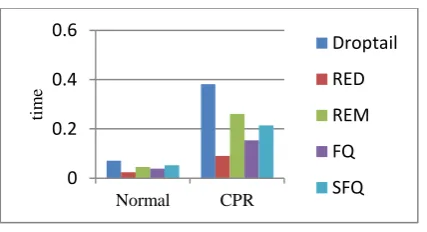
Fig 6: Number of packets sent
Number of packets sent is more in case of using algorithms on normal approach as compared to the CPR approach as the charts show. As we compare individually, there is a large difference between the values of all the algorithms for normal and CPR approach on the flow.
Fig 7: Number of packets received
Number of packets received in case of using algorithms on CPR approach is less than that of using normal approach. As the charts show, individually all the algorithms vary largely when CPR approach is used in place of normal approach.
Fig 8: Packet delivery ratio (PDR)
There is a random response for PDR. Algorithms Droptail shows increase in value on using CPR. Whereas all the other algorithms shows decreased value.
0 0.5 1
Normal CPR
ti m e Droptail RED REM FQ SFQ 0 5000 10000 15000 20000
Normal CPR
n u m b er o f p ac k ets d ro p p ed Droptail RED REM FQ SFQ 0 5000 10000 15000 20000
Normal CPR
n u m b er o f p ac k ets lo st Droptail RED REM FQ SFQ 0 50000 100000 150000 200000
Normal CPR
n u m b er o f p ac k ets se n t Droptail RED REM FQ SFQ 0 50000 100000 150000
Normal CPR
n u m b er o f p ac k ets re ce iv ed Droptail RED REM FQ SFQ 70 80 90 100
Normal CPR
[image:4.595.50.281.476.583.2] [image:4.595.315.526.537.654.2]Simulation experiments and comparison based
upon AFI and AWI attacks using CAS and
CPR approach:
[image:5.595.54.279.85.249.2]AFI:
[image:5.595.318.536.112.243.2]Fig 9: AFI attack experiment for average CPR in REM:
Fig 10: AFI attack experiment for average CAS in REM: As clear in the above given charts, the LDDoS attacks show more CPR due to more congestion and in case of CAS the performance is not clear as it coincides at one place.
[image:5.595.315.537.272.399.2]
Fig 11: AFI attack experiment for average CPR in FQ
Fig 12: AFI attack experiment for average CAS in FQ
As clear from the charts, CPR is higher than CAS in case of LDDoS attacks. It shows using CPR with algorithm FQ shows better results as compared to CAS.
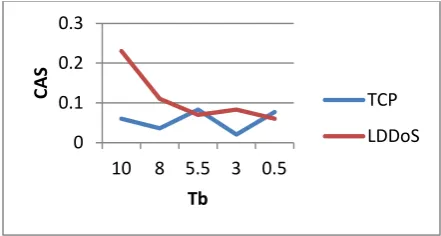
[image:5.595.54.275.286.404.2]Fig 13: AWI attack experiment for average CPR in REM
Fig 14: AWI attack experiment for average CAS in REM
In the comparison between CAS and CPR approach using with algorithm SFQ, the CPR shows higher value as com-pared to CAS. On the other hand CAS shows more TCP val-ues. It shows that using CPR with the algorithm we can get better results about the presence of attacks.
[image:5.595.54.277.468.587.2]AWI:
Fig 15: AWI attack experiment for average CPR in REM 0
0.5 1 1.5
20 25 30 35 40
CPR
Ta
TCP
LDDoS
0 0.1 0.2 0.3
10 8 5.5 3 0.5
CAS
Tb
TCP
LDDoS
0 0.5 1
20 25 30 35 40
CPR
Ta
TCP
LDDoS
0 0.2 0.4 0.6
10 8 5.5 3 0.5
CAS
Tb
TCP
LDDoS
0 0.2 0.4 0.6 0.8
20 25 30 35 40
CPR
Ta
TCP
LDDoS
0 0.2 0.4 0.6 0.8
10 8 5.5 3 0.5
CAS
Tb
TCP
LDDoS
0 0.5 1 1.5
20 25 30 35 40
CPR
Ta
TCP
[image:5.595.316.544.501.644.2] [image:5.595.52.277.626.743.2]Fig 16: AWI attack experiment for average CAS in REM
[image:6.595.317.535.71.196.2]As given in the charts, the CPR value using algorithm is much better as compared to the CAS value. Which shows CPR gives better result as compared to CAS in case of detection of attacks.
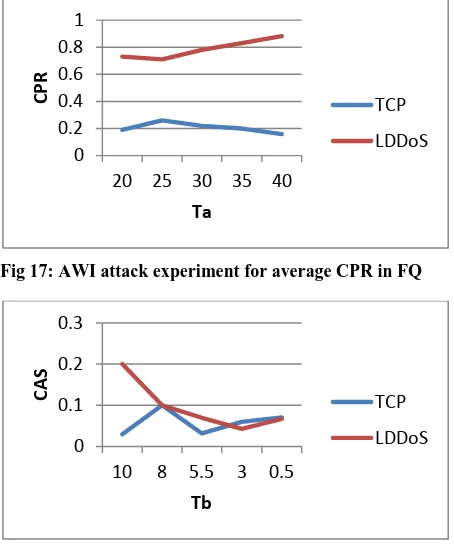
Fig 17: AWI attack experiment for average CPR in FQ
Fig 18: AWI attack experiment for average CAS in FQ
As clear from the charts, the CPR gives more desirable results as compared to CAS, as in the chart using CAS approach, the values are not satisfying.
[image:6.595.55.281.272.398.2]Fig 19; AWI attack experiment for average CPR in SFQ
Fig 20: AWI attack experiment for average CAS in SFQ
In the comparison between using CAS and CPR approach, the values show very less variance, but CPR shows better results as compared CAS.
CONCLUSION
For average CPR the attack period Ta is varied and for aver-age CAS the attack burst width Tb is varied. As clear from the charts, the average CPR for LDDoS attack flows is more than the average CPR for TCP flow, as there is more congestion when attack flows enter the link, it shows more CPR than the TCP flow, and so the attack flows can be easily distinguished from the TCP flow. In case of CAS, it is less than as shown by the CPR; however both the approaches give the satisfying results. However, at some points (at Tb=0.5 & 5.5) the CAS for both the TCP and LDDoS is same. As Tb decreases, the average CAS also decreases.
As clear from the charts there is large difference after using the CPR approach with the various queue management algo-rithms. As the congestion occurs due to LDDoS attack flows, CPR drops the packets and the number of packets received thus decreases after using CPR. CPR detects the attacks at the starting of the flow, so the number of packets sent is also less than that of using normal flow. PDR increases in case of Drop tail after using CPR, whereas in all the other algorithms PDR decreases. So, the results shows that by using CPR ap-proach with the queue management algorithms effects the flow and can prevent the flow from congestion by detecting the LDDoS attack flows.
REFERENCES
[1] Owezarski. P., Farraposo. S. and Gallon. L. 2005,” Net-work security and DoS attacks.”
[2] Adeyinka,O., 2008. Internet Attack Methods and Internet Security Technology. Modeling & Simulation, AICMS 08. Second Asia International Conference on, vol., no., pp.77‐82, 13‐15
[3] Marin, G.A., 2005.” Network security basics”. Security & Privacy, IEEE, vol.3, no.6, pp. 68‐72.
[4] Kumar. S. and Saluja. K.K., 2011. “Queuing Algorithms Performance against Buffer Size and Attack Intensities”. Global Journal of Business Management and Information Technology. Volume 1, Number 2 (2011), pp. 141-157 [5] Agrawal, M.,Tiwari, N.,2009. Performance Analysis and
QoS Assessment of Queues over Multi-Hop Networks. [6] Afrasiabi,S., Abazari,F.,2013. The evaluation of the
behavior of computer networks by NS simulator and the effect of queuing systems in the performance of especial networks.
[7] Lau. F, R.H. Stuart and S.H. Michael, "Distributed De-nial of Service Attacks," in Proceedings of 2000 IEEE 0
0.1 0.2 0.3
10 8 5.5 3 0.5
CAS
Tb
TCP
LDDoS
0 0.2 0.4 0.6 0.8 1
20 25 30 35 40
CPR
Ta
TCP
LDDoS
0 0.1 0.2 0.3
10 8 5.5 3 0.5
CAS
Tb
TCP
LDDoS
0 0.2 0.4 0.6 0.8
20 25 30 35 40
CPR
Ta
TCP
LDDoS
0 0.1 0.2 0.3
10 8 5.5 3 0.5
CAS
Tb
TCP
[image:6.595.54.281.273.546.2] [image:6.595.54.279.606.732.2]International Conference on Systems, Man, and Cyber-netics, Nashville, TN, Vol.3, pp.2275-2280, 2000) [8]
http://nms.csail.mit.edu/6.829-f06/lectures/bruce-queue.pdf.
[9] Srisankar S. K., and Srikant, R., 2004. An Adaptive Vir-tual Queue (AVQ) Algorithm for Active Queue Man-agement
[10]Athuraliya S, Low S. H., Victor H. Li and Yin Q, “REM: Active Queue Management”, IEEE Network, May/June 2001( 0890-8044)
[11] Changwang Zhang, Z. C. (2012). Flow level detection and filtering of low-rate DDoS. SciVerse ScienceDirect Computer Networks , 3417-3431.