38
An Adaptive and Efficient Local Spectrum Sensing
Scheme in Cognitive Radio Networks
Amardip Kumar
Department of E&CE NIT Hamirpur-177005
India
Manoranjan Rai Bharti
Department of E&CE NIT Hamirpur-177005
India
Sandeep Kumar Jain
Department of E&CE NIT Hamirpur-177005
India
ABSTRACT
A proliferation in wireless applications is growing the demand of radio spectrum which is limited as a result one of the major issues faced in wireless communication technology is spectrum scarcity. Cognitive radio (CR) solves the problem of spectrum scarcity by dynamically accessing the spectrum holes in the radio spectrum created by absence of the licensed primary user while bringing no interference to primary users. To achieve fast sensing speed and precise accuracy, cooperative spectrum sensing is usually employed but at the cost of cooperation overhead among CR users which can be reduced by improving local spectrum sensing accuracy. Well-known local spectrum sensing schemes are matched filter detection (MFD), energy detection (ED) and cyclostationary feature detection (CFD). An adaptive local spectrum sensing scheme is proposed in this paper. First, a number of channels available in a bandwidth of interest are sensed serially. The scheme determines a better matched filter, or a combination of energy and cyclostationary detectors based on the available information of the signal present in the channel. If information about PU waveform in a channel is not sufficient, then the combined energy and cyclostationary detection, spectrum sensing is done on the basis of estimated SNR which is calculated in advance for available channels. A concept of SNR wall is discussed for energy detection. One-order cyclostationary detection is performed in time domain in place of cyclostationary detection in frequency domain so that the real-time operation and low-computational complexity can be achieved. To evaluate the scheme‟s performance, the results are compared with conventional single-stage detector like MFD, ED and CFD. The performance comparison is made based on the probability of detection 𝑃𝑑 , probability of false
alarm 𝑃𝑓𝑎 and overall detection time 𝑇0 .
Keywords
Cognitive radio networks, spectrum sensing, primary user, secondary user, energy detection, cyclostationary detection, matched filter, overall detection time.
1.
INTRODUCTION
A proliferation in wireless technologies and wireless devices is dramatically increasing the demand of radio spectrum. Because of the fixed spectrum allocation approach to spectrum access, upcoming wireless technologies are facing spectrum scarcity [1]. It is found that large portions of licensed spectrum remain underutilized in some locations or at some times of a day.
Cognitive radio (CR) is a technology which facilitates opportunistic utilization of the available spectrum. Cognitive radio reuses the licensed spectrum as a secondary user (SU) when the owner of the licensed spectrum, known as the primary user (PU) is idle. To avoid interference to the signal of primary user in its vicinity, the cognitive radio needs to sense spectrum holes before accessing the channel. To detect the presence of the primary user with fast speed and precise accuracy is great challenge.Primary transmitter detection [2] is well-known technique for spectrum sensing also called as local spectrum sensing for single CR user, which can be classified as matched filter detection, energy detection and cyclostationary feature detection for single SU sensing. A matched filter is the optimal detector to signal detection in presence of noise as it maximizes the received signal to noise ratio (SNR) and it takes minimum sensing time because of a complete knowledge of primary user signal. If CR is operating in few PU bands, then matched filter is best choice, but if number of operating PU bands will increase, then practically, it is difficult to use matched filter because dedicated circuitry is required for each PU licensee to achieve synchronization. Energy Detection (ED) is generally adopted for spectrum sensing in recent work because of no need of a priori information of the primary signal and its low computational and implementation complexities but one of the major shortcomings of the energy detection is that this approach gives poor performance when signal-to-noise ratio (SNR) falls below a certain threshold known as the SNR wall which depends on noise uncertainty. Cyclostationary feature detection has capability to isolate noise from user signal, so it can work well under low SNR but requires some prior knowledge of the primary user signal; high computational complexity and long sensing time are bottleneck for its implementation.
39
Tunable BPF A/D Converter Correlator Compare with Threshold
Is
? y(t)
PU is
present PU is absent
Set Threshold
m
m Tm
[image:2.595.150.467.80.206.2]Pilot Signal
Fig 1. Matched filter detection
No Yes
which synergises the merits of individual sensing technique while at the same time nullifies the demerits and improves the performance of spectrum sensing of the system as a whole. It is assumed that multiple PU systems are detected by a CR network and the PU waveform for some of the PU systems is known. In first, since sensing time of matched filter is less than other detection techniques, so matched filter detection is performed by SU to detect the PU signal in those channels whose PU waveforms are known. The SU then performs energy detection if the PU waveform is unknown. The PU signals which are not detected by energy detection and have low SNR values than SNR wall, are sensed by one order cyclostationary detection. The idea behind this proposed technique is to mitigate the problems caused by noise power uncertainty of energy detection and reduce the effect of noise uncertainty by implementing cyclostationary detection for those PU signals which has SNR values less than SNR wall. The rest of the paper is organised as follows. Section 2 presents system model. The basic local spectrum sensing schemes for single user is discussed in Section 3. Section 4 presents the proposed model and its performance evaluation; simulation result is discussed in Section 5. Finally, conclusions are drawn in Section 6.
2.
SYSTEM MODEL
Spectrum sensing is a key element and foremost step in cognitive radio communications as it must be performed before allowing unlicensed users to access a vacant licensed band. The essence of spectrum sensing is a binary hypothesis model and is defined as follows [2]:
0 1
: :
H y n w n H y n hx n w n
Where,𝑦 𝑛 is the received signal by the CR user transmitter,
𝑥 𝑛 is the transmitted signal by the primary user, 𝑤 𝑛 is the noise present in the channel and ℎ is the amplitude gain of the channel. It is assumed that both signal and noise are independent to each other. Noise samples w (n) are additive white Gaussian noise with power spectral densityn2, i.e.
2
( ) (0, n)
w nN and its statistics are completely known to the receiver.
𝐻0, represents a null hypothesis, which indicates there is no
primary user signal in a certain spectrum band i.e. channel is vacant or idle. 𝐻1, is an alternative hypothesis, which states that there exists some licensed or PU signal i.e. channel is occupied or busy. This model only helps to identify whether there is any local (primary) user present in the focused
geographical location for further processing or not for the usage of virtual unlicensed spectrum [2].
The following key metrics are characterized to evaluate the performance of spectrum sensing schemes such as:
Probability of detection 𝑃𝑑 which is shown as
𝑃 𝐻1 𝐻1 i.e. probability of successful decision
upon the spectrum sensing process. Actually it verifies the presence of PU signal in a channel on the basis of decision of the spectrum sensing schemes.
Probability of miss-detection (𝑃𝑚𝑑) which is
represented as 𝑃 𝐻0 𝐻1 i.e. probability of
unsuccessful decision means spectrum sensing process is showing that PU signal is absent in a channel while PU signal present in that channel. Probability of false alarm 𝑃𝑓𝑎 which is shown as
𝑃 𝐻1 𝐻0 i.e. probability of unsuccessful and false
decision upon the spectrum sensing process. In other words, it shows that PU signal is present in a channel while the channel is vacant.
3.
LOCAL SPECTRUM SENSING
TECHNIQUES
The main goal of spectrum sensing is to detect presence or absence of PUs and determines which portion of the spectrum is currently not utilized. There are three basic local spectrum sensing techniques which sense the primary band in which a primary user transmits signal to primary receivers. Matched filter detection, energy detection and cyclostationary detection are well known sensing techniques.
3.1
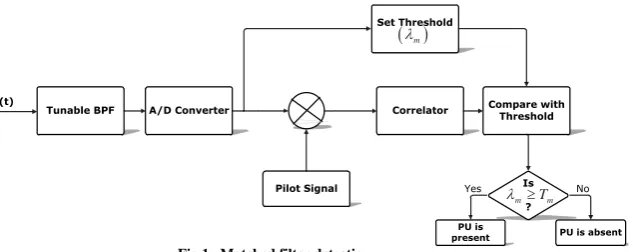
Matched Filter Detection
Primary User signals like TV and mobile communication signals have well-defined characteristics, e.g. presence of narrowband pilot for audio and video carriers of TV signal, dedicated spreading codes for pilot and synchronization channels in CDMA, preambles for packet acquisition in OFDM packets. If PU waveform is known and then matched filter detection [5] is performed because of it takes less sensing time. The matched filter correlates the received signal
𝑦 𝑛 with the known signal i.e. pilot signal 𝑥 𝑛 and finally the output of matched filter 𝑇𝑚 is compared with a threshold
40 Tunable BPF A/D Convertor Square Device(.)² Integrator Compare with Threshold
Is ? y(t)
PU is
present PU is absent Set Threshold
ee Te
[image:3.595.155.453.69.202.2]
Fig 2. Energy detection
No Yes
If 𝑥 𝑛 is completely known to the receiver then the optimal detector for this case is:
1 0 1 , 0 ,
1
( ) ( )
m m m N Hm n H
m
T
y n x n
N
Where,𝜆𝑚, is the detection threshold of matched filter
detection and 𝑁𝑚 is the number of samples.
The approximate values of the probability of false alarm 𝑃𝑓,𝑀𝐷
and probability of detection are expressed as:
, 2
, M 2
m f MD
s n m
m s d D
s n m
P Q P N P P Q P N
Where,𝒬 . is the standard Gaussian complementary cumulative distribution function, 𝑃𝑠 is the signal power and 𝜎𝑛2
is the noise power.
3.2
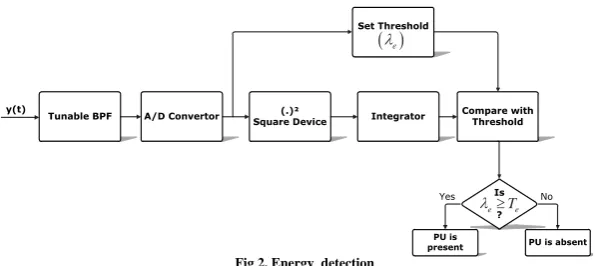
Energy Detection
Energy Detection (ED) is generally adopted for spectrum sensing in recent work because of no need of a priori information of the primary signal and its low computational and implementation complexities [4]. The ED computes the energy 𝑇𝑒 of PU signal present in a channel and if 𝑇𝑒 is
greater than predetermined threshold 𝜆𝑒 , then it is
hypothesised that channel is in use shown in Fig 2. For energy detection 𝑇𝑒 is as follow:
The test statistic 𝑇𝑒is as follow
2 1 0 1 y( ) N e n e T n N
Where 𝑦 𝑛 is the received signal and 𝑁𝑒 is the number of
samples which is𝑁𝑒= 2𝑇𝑊, for simplicity we assume that time-bandwidth product,𝑇𝑊, is an integer. The noise is assumed to be additive white Gaussian noise (AWGN) with zero mean and is a random process. The signal to noise ratio (SNR) is defined as the ratio of signal power to noise power
0 s p N Where,
2 1 1 lim e N s N n ep x n
N
and 𝑁0 are the average power of signal and noise, respectively.
An approximate expression for the detection probability 𝑃𝑑,𝐸𝐷
and the false alarm probability 𝑃𝑓,𝐸𝐷 of energy detector over AWGN channel can be given by, respectively
2 , 2 2 / e s d ED s e P P Q P N
2 , 2 2 f ED e P Q N
Where,𝑄 . is the standard Gaussian complementary CDF. One of the major drawbacks of the ED is that any variation in the noise power severely degrades its performance. In [17,18], concept of SNR wall is proposed which shows that there is a critical value of SNR below which it is impossible for the ED to detect the presence of PU signal in a channel and this critical value of SNR is called as SNR wall 𝛾𝑤𝑎𝑙𝑙 . For an uncertainty 𝜌 in noise power estimation where𝜌 > 1, noise power 𝜎𝑛2 can vary from𝜌1𝜎𝑛2 , 𝜌𝜎𝑛2 . In worst case scenario, when minimum value of noise power,1𝜌𝜎𝑛2, is considered, then received signal power should be greater than 𝜌𝜎𝑛2.
i.e.
2 1 2 2
x n n
Where,𝜎𝑥2 is the PU signal power.
Solving the above equation, we find the critical value of SNR as follow 2 2 1 x n
This equation shows that the critical value of SNR below which the ED does not detect PU signal i.e. the value of SNR wall is 2 2 2 min 1 x wall n
The ED can detect signal even though in case of noise uncertainty as long as the SNR is above the minimum value of SNR i.e. SNR wall 𝛾𝑤𝑎𝑙𝑙 .
3.3
Cyclostationary Detection
41 CH 1 CH 2 CH 3 CH N-1 CH N
Band of Interest
Serial search from the first channel
Is complete knowledge of signal available
?
Matched Filter
Yes
Is Tm ≥ λm
?
Channel is busy Channel is idle
Energy detector
No
Is Te ≥ λe
?
Yes No
Channel is busy
Yes Is
?
Channel is idle
No Yes
Cyclostationary Detector
Is Tc ≥ λc
?
No
Channel is idle Channel is busy
[image:4.595.111.505.88.454.2]No Yes
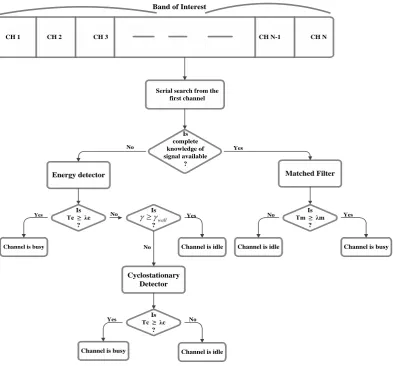
Fig 4. A New Three-Stage Adaptive Spectrum Sensing Scheme
wall
autocorrelation exhibit periodicity which is characterized as being cyclostationary [21]. The main benefit of cyclostationary feature detection (CFD) is that it can easily isolate the noise from the user signal [20]. Common analysis of cyclostationary signal is based on autocorrelation function in frequency domain. In frequency domain, cyclostationary detection mainly focus on two-order cyclostationary i.e. auto-correlation function. These features are detected by analysing a spectral correlation function in frequency domain. One of major drawback of CFD in frequency domain is that it is computationally complex because of all the frequencies should be searched in order to generate the spectral correlation function, so the calculation complexity is huge. To reduce the complexity and power consumption, we perform first order cyclostationary detection in time domain which shows mean of the signal is periodic [22]. In the transmission of 𝑥 𝑡 through an AWGN channel,𝑦 𝑡 = 𝑥 𝑡 + 𝑛(𝑡). The mean function of 𝑦(𝑡) can be written as
(t) (1)y T
M t E y t x
Where,𝐸 denotes the expectation operator. The above equation shows that the mean is time-varying, if signal x(t) is periodic with period 𝑇0, then mean of received signal y(t) will
be also periodic with period 𝑇0 i.e. we can say that 𝑀𝑦 𝑡 is
also periodic with period 𝑇0,
0
(t) M (t kT ) 0, 1, 2, 3....
y y
M for k
Such a characteristic is called one-order cyclostationary detection which block diagram is shown in Fig 3
Sample
Average Peak Search
If
?
Threshold
Channel is
busy Channel is idle
cd
Peak
Yes
No Y(t) M ty( )T
Fig 3. One-order cyclostationary detection
For a particular threshold𝜆𝑐𝑑, an approximate expression for the probability of false alarm 𝑃𝑓,𝐶𝐷 and the detection probability 𝑃𝑑,𝐶𝐷 of one-order cyclostationary detection over
AWGN channel can be obtained as [1] 2
,CD exp 2
2 cd f
A
P
And
,CD
2 , cd d
A
P Q
[image:4.595.331.536.552.628.2]42 Where the parameter 𝛾 is the instantaneous signal-to-noise
ratio (SNR), 𝑄 . , . is the generalized Marcum Q-function and
𝜎𝐴2= 𝜎2/ 2𝑁𝑐+ 1 where 𝑁𝑐 is the number of samples.
4.
PROPOSED ADAPTIVE SPECTRUM
SENSING SCHEME
4.1
Proposed Model
The proposed scheme is shown in Fig 4. It is assumed that A band of interest, B, is considered, in which there
are N channels to be sensed. Each channel has bandwidth W.
For some channels, the information of PU waveforms are known enough (most probably completely known) to perform matched filter detection while for others, the PU signal structure is unknown.
SNR 𝛾 value of PU signal present in each channel is given as input in this scheme.
In this proposed scheme, the cognitive radio or SU will sense serially the N channels present in the band of interest and detect whether or not there is a spectrum hole or idle channel available. In the first stage, scheme will check whether complete knowledge of PU waveform is known. If PU waveform is unknown, the second stage will work in which combined energy detection and cyclostationary detection will be performed. At first, energy detection is chosen because of its low computational and implementation complexities and it can also maintain a low constant false alarm even at low SNR conditions. If 𝑇𝑒≤ 𝜆𝑒, then SNR value 𝛾 of PU signal will
be estimated. Since we assumed that SNR value is given as input, so no need to estimate SNR. If estimated SNR 𝛾 is greater than or equal to SNR wall 𝛾𝑤𝑎𝑙𝑙 , then channel will be
idle. On the other hand, if 𝛾 < 𝛾𝑤𝑎𝑙𝑙, then cyclostationary
feature detection will be performed.
4.2
Performance Evaluation of Proposed
Scheme
The proposed scheme decision will follow as
det , det ,
det , wall
Matched filter ection if PU waveform is known Decision Energy ection if PU waveform is unknown
One order cyclostationary ection if PU waveform is unknown and
The overall probability detection 𝑃𝑑 and false alarm 𝑃𝑓 of
the proposed scheme are given as
, 0(1 , )
1
,MDd r d ED d ofd r d
P P P P P P P
f, 1(1 f, )
1
f,MDf r ED ofd r
P P P P P P P
Where 𝑃𝑟 is the probability that channel would be sensed by
the combined energy detector and one order cyclostationary detector, 1 − 𝑃𝑟 is the probability that channel would be
sensed by the matched filter detection, 𝑃0 is the probability
that the received energy of signal is less than 𝜆𝑒 as well as SNR of that signal is less than 𝛾𝑤𝑎𝑙𝑙 when PU is present and
𝑃1 is the probability that the received energy of signal is less
than 𝜆𝑒 as well as SNR of that signal is less than 𝛾𝑤𝑎𝑙𝑙 when
PU is absent. So, the probability that channel would be sensed by one order cyclostationary detection is 𝑃 = 𝑃0+ 𝑃1.
Overall detection time 𝑇0 is as follows:
The agility of proposed model is evaluated by comparing overall detection time of proposed model with energy detection, matched filter detection and cyclostationary detection. The overall detection time of proposed sensing scheme is
𝑇0= 𝑇𝑚+ 𝑇𝑒+ 𝑇𝑐
Where 𝑇𝑚, 𝑇𝑒 and 𝑇𝑐 are the sensing times of the matched
filter detection, energy detection and one-order cyclostationary detection, respectively.
𝑇𝑚is derived as follows
𝑇𝑚= 𝑁 1 − 𝑃𝑟 𝑇1
where 𝑇1 is sensing time for each channel by matched filter
detection.
𝑇𝑒and𝑇𝑐 can be derived as follows
𝑇𝑒= 𝐸 𝐾1 𝑇2
where 𝐸 𝐾1 is the mean number of channels reported to
energy detector and 𝑇2=2𝑊𝑁𝑒 is the mean sensing time for
each channel, in which 𝑁𝑒 is the number of samples for
detection and W is the channel bandwidth. 𝐾1is the random variable which follows a binomial distribution, with parameters 𝑁 and 𝑃𝑟, where 𝑃𝑟 is the probability that a channel would be reported to the energy detector. Hence the detection time of the energy detection is
𝑇𝑒= 𝑁𝑃𝑟𝑇2
𝑇𝑐can be derived as follows:
𝑇𝑐 = 𝐸 𝐾2 𝑇3
where𝐸 𝐾2 represents the mean number of channels reported
to one order cyclostationary detector and 𝑇3=2𝑊𝑁𝑐 is the mean sensing time for each channel where 𝑁𝑐 is the number of
samples for detection. 𝐾2is the random variable which follows
a binomial distribution, with parameters N and 1 − 𝑃𝑟. Hence
the mean detection time of the one order cyclostationary detection is
𝑇𝑐 = 𝑁𝑃𝑟𝑃𝑇3
So, overall detection time of proposed model to detect signals present in N channels is
43
5.
SIMULATION RESULTS
In this section, the proposed sensing scheme is compared with energy detection, matched filter detection and one order cyclostationary detection. The parameters used for simulation are given in Table 1.
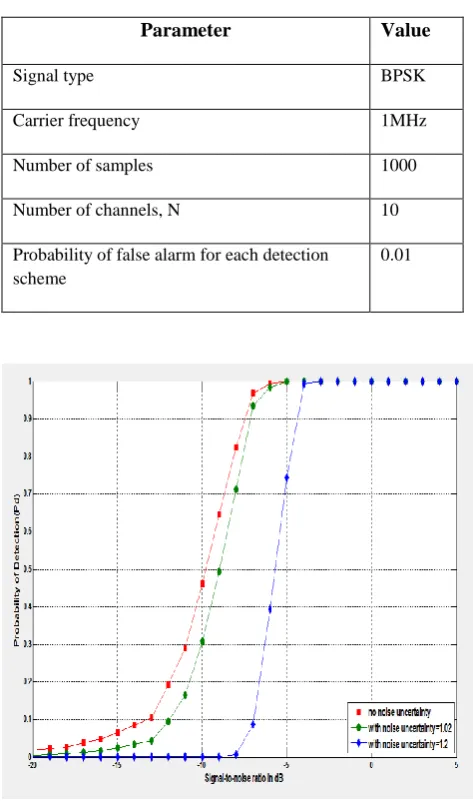
Table1. Parameter values for simulation
Parameter Value
Signal type BPSK
Carrier frequency 1MHz
Number of samples 1000
Number of channels, N 10
Probability of false alarm for each detection scheme
[image:6.595.53.290.157.559.2]0.01
Fig. 5. Effect of noise uncertainty in energy detection
From Fig. 5, one can see that how the performance of probability detection degrades when noise uncertainty increases in energy detection techniques. For noise uncertainty factor 𝜌 = 1.02, ED stops detecting authorized signal below -9dB which degrades performance of ED in comparison of 𝜌 = 1 (in case of no noise uncertainty) where primary signal is detectable up to -20dB.
Fig, 6 shows the performance of the different basic local spectrum sensing techniques at different value of SNR 𝑑𝐵 . For probability of detection, 𝑃𝑑= 0.9, ED is limited to -7.5dB
while MFD and CD can sense up to SNR value -18.5dB and -33.5dB, respectively. It shows that at low SNR cyclostationary feature detection outperforms the matched filter detection and energy detection.
To evaluate the performance of proposed model, 10 randomly distributed Gaussian channels are taken and Monte Carlo simulation is used.
Fig. 6. Probability of detection Vs SNR with BPSK in AWGN channel
[image:6.595.322.538.487.679.2]An SU senses these channels serially. For simulation purposed, we already defined SNR value 𝑑𝐵 of each channel. The performance of proposed spectrum sensing scheme is shown in Fig. 7, for which already defined SNR for each channel is given in Table 2. For ED, SNR wall is taken as -9dB which corresponds to 𝜌 = 1.2 approximately. For simulation, we assume that channel numbers 5 and 6 have prior knowledge of PU waveform and we apply matched filter detection. Rest of channels work is mentioned in section 5.
Fig 7. Probability of detection Vs SNR plot showing performance of proposed model
44 complexities is less than CD because of sensing is done by
[image:7.595.92.516.119.168.2]combined effect of MFD, ED and CD.
Table 2. SNR value input to different channel for simulation
Channel No. 1 2 3 4 5 6 7 8 9 10
SNR in dB -42 -35 -30 -25 -20 -18 -10 -7 1 5
According to [15], sensing time to sense single channel by MFD, ED and CD are𝑇1= 1 𝑚𝑠𝑒𝑐, 𝑇2= 2 𝑚𝑠𝑒𝑐and𝑇3=
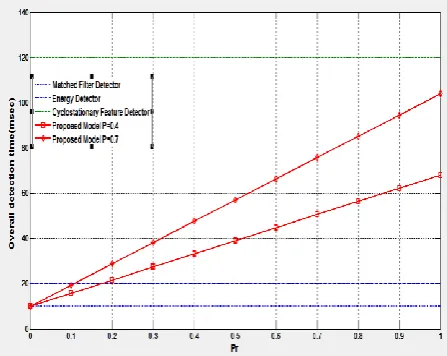
12 𝑚𝑠𝑒𝑐, respectively. Fig. 8 shows the overall detection time taken to sense 10 channels by the proposed model, matched filter detection, energy detection and cyclostationary detection by varying 𝑃𝑟.The overall detection time of all the detection schemes remains constant regardless of 𝑃𝑟 except for the
proposed scheme. For proposed scheme, two cases are shown P=0.4 and P=0.7 respectively. When P=0.4, most of the channels sensed by the combined energy detector and cyclostationary detector are concluded at the energy detector stage. The overall detection time of the proposed scheme is much less in comparison of cyclostationary detection, but it has the same accuracy of detection. When P=0.7, most of the channels sensed by the combined energy detector and cyclostationary detector need to go through the cyclostationary stage for PU detection, but the accuracy of detection increases.
Fig. 8. Overall detection time to sense 10 channels by proposed method.
6.
CONCLUSION
A new local spectrum sensing scheme for a single user is proposed in this article to improve detection efficiency and to decrease sensing time. The proposed scheme is compared with the existing transmitter detection schemes and it is found that the proposed scheme takes less time and reliable for sensing even if low SNR values. Concept of SNR wall is discussed to mitigate the problems caused by noise uncertainty faced by ED at low SNRs. It is observed that detection performance of the proposed scheme is very near to
cyclostationary detection, but the overall sensing time is quite less than that of cyclostationary detection.
7.
ACKNOWLEDGMENTS
The authors would like to thank National Institute of Technology, Hamirpur for providing necessary laboratory facilities. Financial assistance from MHRD is highly acknowledged.
8.
REFERENCES
[1] Federal Communications Commission: „Spectrum policy task force report‟, November 2002
[2] Yucek, T., Arslan, H.: „A survey of spectrum sensing algorithms for cognitive radio applications‟, IEEE Commun. Surv. Tutorials, 2009, 11,(1), pp. 116-130 [3] H.Urkowitz, Energy detection of unknown deterministic
signals. In Proceedings of IEEE (pp. 523 531). April 1967.
[4] D. Cabric, S. Mishra, and R. Brodersen, “Implementation Issues in Spectrum Sensing for Cognitive Radios,” in Asilomar Conf. on Signals, Systems and Computers, Pacific Grove, CA, Jun. 2004, pp. 772–776.
[5] J. G. Proakis, Digital Communications, 4th ed. Boston, MA: McGrawHill, 2000.
[6] Gardner W A. Statistical spectral analysis: A non-probabilistic theory [M]. Englewood Cliffs, NJ: Prentice Hall, 1987.
[7] W Ejaz, NU Hasan, MA Azam, HS Kim, Improved local spectrum sensing forcognitive radio networks. EURASIP J. Adv. Signal Process (2012). http://asp.eurasipjournals.com/content/2012/1/242 [8] KG Smitha, AP Vinod, PR Nair, in IEEE Proceedings of
International Conferenceon Innovations in Information Technology (IIT). Low power DFT filter bankbased two-stage spectrum sensing, (UAE, March 2012), pp. 173– 177
[9] W Ejaz, NU Hasan, HS Kim, SNR-based adaptive spectrum sensing forcognitive radio networks. Int. J. Innov. Comput. Inf. Control. 8(9),6095–6106 (2012) [10] S Geethu, GL Narayanan, A novel high speed two stage
detector for spectrum sensing. Elsevier Procedia Technol. 6, 682–689 (2012)
[11] S Maleki, APandharipande, G Leus, in IEEE Proceedings of International Conference on Acoustic Speech and Signal Processing. Two-stage spectrum sensing for cognitive radios, (USA, March 2010), pp. 2946–2949 [12] PR Nair, AP Vinod, KG Smitha, AK Krishna, Fast
two-stage spectrum detector for cognitive radios in uncertain noise channels. IET Commun. 6(11), 1341–1348 (2012) [13] W Yue, B Zheng, Q Meng, W Yue, Combined energy
[image:7.595.55.279.414.592.2]45 [14] L Luo, NM Neihart, S Roy, DJ Allstot, A two-stage
sensing technique for dynamic spectrum access. IEEE Trans. Wirel. Commun. 8(6), 3028–3037(2009)
[15] W Ejaz, NU Hasan, S Lee, HS Kim “I3S: Intelligent Spectrum Sensing Scheme for Cognitive Radio Networks” EURASIP Journal on Advances in Signal Processing, vol. 2013, no. 1, p. 26, 2013
[16] A Fehske, JD Gaeddert, JH Reed, in IEEE Proceedings of Dynamic Spectrum Access Networks (DySPAN). A new approach to signal classification using spectral correlation and neural networks, (USA, November 2005), pp. 144–150
[17] A Sahai, N Hoven, R Tandra, in Proceedings of Allerton Conference on Communication, Control, and Computing. Some fundamental limits in cognitive radio, (USA, October 2004), pp. 1662–1671
[18] Tandra, R., Sahai, A.: „SNR walls for signal detection‟, IEEE J. Sel. Topics Signal Process., 2008, 2, (1), pp. 4– 17
[19] Sonnenschien, A., Fishman, P.M.: „Radiometric
detection of spread spectrum signals in noise of uncertain power‟, IEEE Trans. Aerosp. Electron. Syst., 1992, 28, (3), pp. 654–660
[20] Sutton, P.D., Nolan, K.E., Doyle, L.: „Cyclostationary signatures in practical cognitive radio applications‟, IEEE J. Selected Areas Commun., 2008, 26, (1), pp. 13– 24
[21] Gardner, W.A.: „Spectral correlation of modulated signals‟, IEEE Trans. Commun., 1987, 35, (6), pp. 584– 601
[22] W. Yue, B. Zheng, and Q. Meng, “Cyclostationary property based spectrum sensing algorithms for primary detection in cognitive radio systems,” Journal of Shanghai Jiaotong University (Science), vol. 14, no. 6, pp. 676–680, Dec. 2009
[23] Ghasemi, A., Sousa, E.S.: „Spectrum sensing in cognitive radio networks: requirements, challenges and design trade-offs‟, IEEE Commun. Mag., 2008, 46, (4), pp. 32– 39.