Clustering of huge datasets using Machine Intelligence
Techniques
Shyam Mohan J. S.
Assistant Professor
Dept. of CSE, SCSVMV, Enathur,Kanchipuram,
Tamilnadu, India
Shanmugapriya P.
Associate Professor
Dept. Of CSE, SCSVMV, Enathur,Kanchipuram,
Tamilnadu, India
ABSTRACT
Cluster identification is useful for finding insights into the huge datasets for finding out the attributes, characteristics of a particular dataset. Today, many organizations have started to use their own data analytic tools for finding clusters.
This paper focuses on various algorithms for finding clusters for huge and different datasets. We have used different datasets and applied MapReduce algorithms for achieving the results. The experimental results obtained in substantial algorithmic computations provide clusters that are used for quick decision making. We present the results performed over various datasets that scales well with respect to both data set size and data set dimensionality.
Keywords
Machine Intelligence, Dimensionality reduction.
1.
INTRODUCTION
Clustering is considered as one of the unsupervised learning model that deals with partioning the data that is used for further learning.[1].
Some of the key features of clusters are given below: 1. Instances in the same cluster must be similar. 2. Instances in the different clusters will be different. Clustering is done in various methods like:
1. Feature extraction and selection i.e., selecting the most common features from the original data. 2. Choosing the correct clustering algorithm. 3. Evaluating the results obtained for prediction. 4. Provide results for the clusters obtained.
Collaborating with huge data sets is useful for identification of research challenges because each dataset pose different aspects during processing and analysis in multi dimensional space. As the datasets increases, dimensionality increases and it becomes more complex to form clusters. For high dimensional datasets, grouping of datasets is a difficult task.[2].Finding clusters in the subsets of dimensions is imperative task. In other words, subspace clustering is used to find the clusters in the subspaces of the datasets.[3]. Example, DBSCAN clustering algorithm is used to generate clusters in the full dimensional space.
2.
MOTIVATIONAL EXAMPLES
Many motivational examples can be given for machine intelligence clustering techniques for real world examples are explained below:
High dimensional Data sets in Biology: Forming clusters for biological datasets was proposed by Cheng and Church called as bi-clustering for microarray datasets. In biology, high dimensional data sets are obtained from microarray chips in the form of a matrix in which each cell contains rows and columns where rows represent the expression level of a gene and the later represent experimental condition.[4]. Combining rows and columns can be clustered to form meaningful biological inferences. However, only a subset of genes is taken into consideration for experiments related to a particular cellular process.[5][6].
Bioinformatics: In bioinformatics, finding locations of genes pose research challenge. Genomes are represented using Expressed Sequence Tag (EST) that contains portions of genes expressed as mature mRNA of length at least 500–800 nucleotides long.[7][8].
3.
DATA REDUCTION TECHNIQUES
Many data reduction techniques have been proposed in the literature. Depending on their objective, they can be divided into global alignment and local alignment methods.[9].There is a fundamental difference between the two families of methods. Global alignment can be seen as a full-sequence matching approach for global optimization, where the objective is to identify the minimum number of changes that should be performed to one sequence so as to convert it to the other, by forcing the alignment to span the whole sequence. In contrast, the objective of local alignment is to identify local regions within the compared sequences that are highly similar to each other, while they could be globally divergent. Hence, the result of local alignment is to match several subsequences within the two sequences, while allowing for gaps in the alignment.
Parallel processing is essential for large-scale analytics. Principal Component Analysis (PCA) is a well known model for dimensionality reduction in statistical analysis, which requires a demanding number of I/O and CPU operations.[10]. Principal Component Analysis (PCA), a fundamental dimensionality reduction model in statistics and machine learning.PCA has the advantage of being applicable to any data set with numeric dimensions.[11].
EntityRel proposes a new measure for computing the context-aware relevance between two heterogeneous entities, constructs a biomedical entity correlation graph from unstructured data, extending the scope of the study to unstructured text data and extends the meta path based relationship analysis from mining relevance between homogeneous typed entities to heterogeneous typed ones and infers top-k most effective meta paths from data.
pre-processing step and can handle large query sizes and similarity ranges while maintaining competitive accuracy and retrieval runtime.[12]. It works in a filter-and-refine manner. Its key component is the dimensionality reduction technique that it uses to transform the strings from their original representation to a more compact one. Effectively, this results in a mappingof the original string space to a new string space of reduced dimensionality. This is shown in table 1.
4.
CLUSTERING ALGORITHMS
Clustering algorithms are classified into four types. They are given below:
Connectivity-based clustering: Data points that are closer in the data space are more related (similar) than to data points farther away. The clusters are formed by connecting data points according to their distance. Ex: Dendrogram- hierarchical clustering.
Centroid-based clustering: Clusters are represented by a central vector or a centroid (not necessarily member of the dataset).It is an iterative clustering algorithm that uses the closest point from the centroid.
Distribution-based clustering: It is used in statistics and it also referred to as distributional modeling. Ex: Gaussian distribution.
Density-based Clustering: Clusters are defined as areas of higher density within the data space compared to other regions. Data points in the sparse areas are usually considered to be noise points.[13].
5.
PROBLEM STATEMENT
Recall from the introduction that clustering is used for classification of datasets into groups.[14].Majority of the technologies that exist today use data analysis tools for performing insights and for making effective decisions. But, most of the data analysis tools are used for in-house.
Example 1 : Assume that government agencies want to know the statistics of people affected by malaria during 2008-2015. Of course, there are many data analysis tools that can fetch the results across various medical datasets available in India. But ,if the agencies want to know the statistics of mobile users during the same year , it has to take datasets from mobile data operators and perform analysis. Therefore this led to our idea for combining datasets taken from various sources viz., mobile phone users, medical or genome datasets, datasets spread across all the government and private sectors that can be used for effective data processing.
Example 2 : Let us assume {p1,p2,p3,----pn} are people belonging to a particular area.
{c1,c2,c3,…….cn}denote cars that are buyed by people in the same area.
If the user want to know about the number of cars brought by the person in the particular area, it is easy to find as we have enough data tools to perform analysis. If the same person owns a house, then this data would not be available to the user as the status of the person owning a car is only taken into consideration.
Example 3: Given a large dataset consisting of high dimensional elements, how could one cluster these datasets? One possible solution is to choose algorithms that can scale well and can run in parallel.
6.
RELTAD WORK
6.1
MapReduce
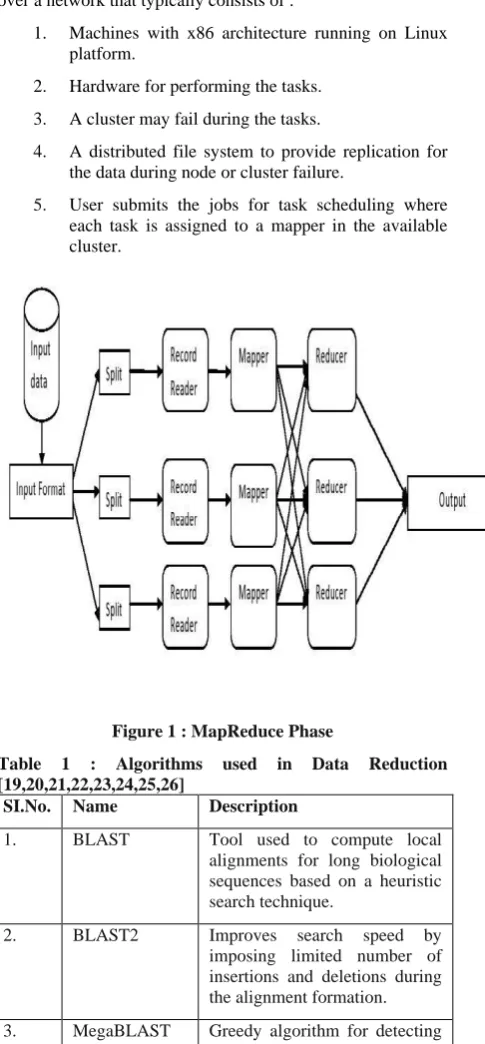
Large scale dataset processing is effectively done by MapReduce framework that performs parallel processing. MapReduce uses two functions viz., Map and Reduce and provides the details related to the data storage, distribution, replication, load balancing, etc.[15].At the map stage, input file and outputs are passed as (key, value) pairs and outputs are shuffled based on the key. The received pairs and results are combined at the reduce stage. MapReduce is easily scalable across many systems and it is cost effective.[16]. Choosing the right application and environment is the first main principle for performing the MapReduce over different datasets. [17][18]. A large cluster of computers are connected over a network that typically consists of :
1. Machines with x86 architecture running on Linux platform.
2. Hardware for performing the tasks. 3. A cluster may fail during the tasks.
4. A distributed file system to provide replication for the data during node or cluster failure.
[image:2.595.317.560.235.758.2]5. User submits the jobs for task scheduling where each task is assigned to a mapper in the available cluster.
Figure 1 : MapReduce Phase
Table 1 : Algorithms used in Data Reduction [19,20,21,22,23,24,25,26]
SI.No. Name Description
1. BLAST Tool used to compute local alignments for long biological sequences based on a heuristic search technique.
2. BLAST2 Improves search speed by imposing limited number of insertions and deletions during the alignment formation. 3. MegaBLAST Greedy algorithm for detecting
a result of sequencing 4. MPBLAST and
miBLAST
Different versions of BLAST used for parallel queries.
5. BLAT Builds an index of the database and then, given a query, it linearly scans the query searching for matches in the index
6. OASIS Widely applied local alignment similarity measure.
7. The Shift-Or algorithm
Bit manipulation methods that also search for a query in a target sequence.
8. RBSA Embedding-based method for subsequence matching under local alignment that employs an alphabet reduction technique where, all the odd letters of the alphabet are replaced by 1 and all the even letters are replaced by 0.
9. short-read sequencing methods
performs near-exact subsequence matching by setting, queries are substantially shorter than the target sequences, they are expected to match locally, with or without gaps in the alignment, and more importantly they assume the presence of a subsequence match in the target database sequence that is highly similar to the query. Ex: SOAP
10. q-gram Based on the pigeon-hole principle, according to which if two sequences have a certain degree of similarity they must share a minimum number of subsequences (q-grams).
6.2
K-Means Clustering Algorithm
It is s an unsupervised learning algorithm in which clusters are formed based on similarity i.e, patterns in the datasets can be found out easily.[27].
The steps involved in K-Means algorithm are given below: 1. Select k objects randomly from initial cluster centers.
2. Other objects remaining are assigned to the similar clusters based on the distance between the object and the cluster center.
3. Calculate the new mean for each cluster.
4. Repeat steps 2 and 3 until the criterion function varies. Calculation of distances and new mean for K-Means algorithm is done the next paper (part 2). For each iteration, a total of (nk) distance computations are required where n is the number of objects and k is the number of clusters. Distance computations between one object and the centers are irrelevant compared with the distance computations between other objects with the corresponding centers. Therefore, all the distance computations are executed in parallel.[28].
6.3
Applying
K-Means
Algorithm
on
MapReduce
6.3.1 Pseudo code for Map Function
Algorithm 1: Map (key, value)Input: enter values for center variables, the offset key and the sample values.
Output: (key, value) pair, where the key represents the index of the closest center point and value represents a string comprise of sample information.
1. Create samples instances from value;
2. Set minimumDistance = Double.MAX VALUE; //Initialize the auxiliary variable
3. index = -1;
4. For i=0 to centers.length do distance= ComputeDistance(instance, centers[i]);
If distance < minimumDistance {
minimumDistance = distance; index = i;
}
5. End For
6. Read index as key;
7. Create value as string comprising of values with different dimensions;
8. output (key_, value_) pair; 9. End
6.3.2 Pseudo code for Combine-function
Algorithm 2: combine (key, V)Input: set key, V as the index and list of samples assigned to the cluster.
Output: ( key_, value_) pair, where the key represents the index of the cluster and value represents a string comprised to the sum of the samples in the same cluster and the sample number
1. Initialize [ ] ;//to record the sum of the values in V; 2. set the counter value to 0 ;//To record the sum of sample number in the same cluster
{
Construct sample instances from V.next();
Add the values of different dimensions of instance to [] num++;
4. }
5. Read key as key;
6. Construct value as string consisting of the computed sum values of different dimensions and numbers;
7. output (key_, value_) pair; 8. End
6.3.3 Pseudo code for Reduce-function
Algorithm 3: Reduce (key, V)Input: Set key as the index of the cluster and V as the list of the partial sums from different host
Output: (key _, value_) pair, where key represents the index of the cluster and value represents a string representing the new center
1. Initialize [] ;// Record the sum of value in sample V in the same cluster
2. Set counter NUMBER to 0 //Record the sum of sample number in the same cluster;
3. while(V.hasNext()){
Construct the sample instance from V.next();
Add the values of different dimensions of instance to [] NUMBER += num;
4. }
5. Divide the entries of [] by NUMBER to get the new center’s coordinates;
6. Read key as key;
7. Construct value as string // comprise of the center’s coordinates;
8. output (key_, value_) pair; 9. End
7.
EXPLORING DATASETS
We have applied K-Means algorithm implemented on MapReduce to various data sets. Some of the data sets where we have applied are given below:
7.1
1000 Genomes
The 1000 Genomes Project consist the details of human genetic variation (SNPs), structural variants, and their haplotype context. The last phase of the project consisted of over different populations of 26 with more than 2500 individuals that were used to produce haplotypes with 80 million or more variants.
For genetic algorithms, parallel implementation can be done in two ways viz., Coarse-grained parallel GA and Fine-grained parallel GA. In the first one, each node is given population that is further split into process and then the individuals are migrated to other node after map phase and in the later case each individual is assigned to a separate node
for fitness evaluation. Neighboring nodes communicate with each other for selection and remaining operations.
Genetic algorithms have five phases: 1. Initial population
2. Fitness function 3. Selection 4. Crossover 5. Mutation
7.2 Pseudo code for GA
STARTGenerate the initial population Compute fitness
REPEAT Selection Crossover Mutation Compute fitness
UNTIL population has converged STOP
7.3 Pseudo code for loading datasets
library(datasets)head(GA)
8.
SYSTEM SETUP AND CLUSTER
CONFIGURATION
We compare the performance of K-Means algorithm on various datasets. The algorithm was executed for 800-830 iterations (apprx.) on six different systems with two nodes each running hadoop on Virtual Machines (Vm’s) , i.e, each system has two virtual machines installed in it where the hadoop process was executed successfully.
All the computations were executed on a cluster that consisted of approximately 1000 machines..Each machine Configuration is given in table 2. Computations were performed on the cluster of machines with 1GBPS leased line supply. Subsequently, some part of the memory was kept for backup based on the amount of data to be processed in each cluster of machine. Executions were performed every day in the morning.
9.
EVALUATION CRITERIA ND
RESULTS
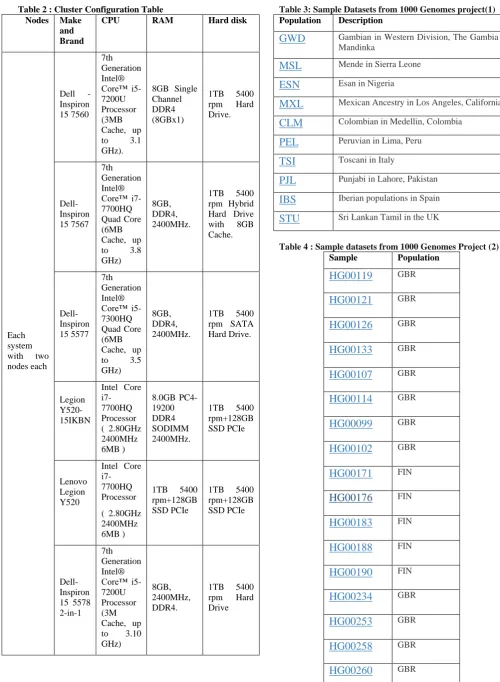
Table 2 : Cluster Configuration Table
Nodes Make
and Brand
CPU RAM Hard disk
Each system with two nodes each
Dell - Inspiron 15 7560
7th Generation Intel® Core™ i5-7200U Processor (3MB Cache, up to 3.1 GHz).
8GB Single Channel DDR4 (8GBx1)
1TB 5400 rpm Hard Drive. Dell-Inspiron 15 7567 7th Generation Intel® Core™ i7-7700HQ Quad Core (6MB Cache, up to 3.8 GHz)
8GB, DDR4, 2400MHz.
1TB 5400 rpm Hybrid Hard Drive with 8GB Cache. Dell-Inspiron 15 5577 7th Generation Intel® Core™ i5-7300HQ Quad Core (6MB Cache, up to 3.5 GHz)
8GB, DDR4, 2400MHz.
1TB 5400 rpm SATA Hard Drive.
Legion Y520-15IKBN
Intel Core i7-7700HQ Processor ( 2.80GHz 2400MHz 6MB )
8.0GB PC4-19200 DDR4 SODIMM 2400MHz.
1TB 5400 rpm+128GB SSD PCIe
Lenovo Legion Y520
Intel Core i7-7700HQ Processor ( 2.80GHz 2400MHz 6MB )
1TB 5400 rpm+128GB SSD PCIe
1TB 5400 rpm+128GB SSD PCIe
Dell-Inspiron 15 5578 2-in-1
7th Generation Intel® Core™ i5-7200U Processor (3M Cache, up to 3.10 GHz)
8GB, 2400MHz, DDR4.
1TB 5400 rpm Hard Drive
Table 3: Sample Datasets from 1000 Genomes project(1)
Population Description
GWD
Gambian in Western Division, The Gambia -Mandinka
MSL
Mende in Sierra LeoneESN
Esan in NigeriaMXL
Mexican Ancestry in Los Angeles, CaliforniaCLM
Colombian in Medellin, ColombiaPEL
Peruvian in Lima, PeruTSI
Toscani in ItalyPJL
Punjabi in Lahore, PakistanIBS
Iberian populations in SpainSTU
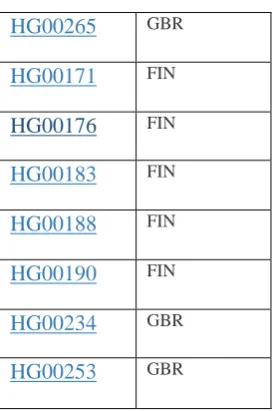
Sri Lankan Tamil in the UKTable 4 : Sample datasets from 1000 Genomes Project (2)
Sample Population
[image:5.595.36.537.68.751.2]HG00265
GBRHG00171
FINHG00176
FINHG00183
FINHG00188
FINHG00190
FINHG00234
GBR [image:6.595.99.237.66.272.2]HG00253
GBRTable 5 : Data extraction for a particular dataset
HG00119
Sex Male
Bio Sample ID
SAME125348
Search Coriell
HG00119
Population British
Code GBR
Description British in England and
Scotland
Superpopulation European
Second Order
HG00124
10.
HANDLING FAULT TOLERANCE
Performing MapReduce tasks for huge datasets requires effective fault tolerant machines. This can be achieved by keeping a backup for the tasks based on the amount of data to be processed.
10.1 Master Failure
Writing from periodic checkpoints is an easy task for the Master node. If the task dies, a new copy can be created from the previous state. However, node failure is avoided if only single master node is taken for computation.
10.2 Worker Failure
During data processing, the master pings for and every worker periodically and waits for its reply. If there is no response, the worker is marked as failed. Map tasks completed are reset back to the idle state and keeps scheduling and re-scheduling based on the completion of the task.
10.3 Backup Tasks
Sometimes, machines may take more time to process huge datasets (stragglers)that can reduce the speed of execution time .To avoid this problem, as soon as MapReduce tasks are completed , backup copies are created so that there is no re-scheduling of the tasks. The task is completed only if backup for each task is done successfully.
10.4 Performance
[image:6.595.343.582.174.372.2]We measure the performance of MapReduce computations running on a cluster of machines. One computation searches through approximately 2TB of data looking for the sample present in GA and the other look s for the sample population data.
[image:6.595.332.584.428.612.2]Figure 2: Execution time for 1000 genome datasets
Figure 3 : Accuracy of tasks over clusters
11.
CONCLUSION
This paper gives an overview of tests performed on various datasets and the results the performance of the same is shown in figure 2 and 3. The same tests can applied for a vast amount of different datasets. The cluster systems and their configurations are shown in table 2.
We are thankful to all those who have extended their support for completing this paper on time.
12.
REFERENCES
[1] Steinbach M, Ertöz L, Kumar V (2004) The challenges of clustering high dimensional data. In: New directions in statistical physics. Springer, Berlin Heidelberg. pp 273– 309.
[2] Fan J, Han F, Liu H (2014) Challenges of big data analysis. National Science Review 1(2):293–314. [3] Parsons L, Haque E, Liu H (2004) Subspace clustering for
high dimensional data: a review. ACM SIGKDD Explor News l6(1):90–105.
[4] Babu MM (2004) Introduction to microarray data analysis. In: Grant RP (ed). Computational genomics: Theory and application. Horizon Press, UK. pp 225–249
[5] Jiang D, Tang C, Zhang A (2004) Cluster analysis for gene expression data: a survey. IEEE Trans Knowl Data Eng 16(11):1370–1386
[6] Cheng Y, Church GM (2000) Biclustering of expression data. Proc Int Conf Intell Syst Mol Biol 8:93–103. [7] Jongeneel CV (2000) Searching the expressed sequence
tag (est) databases: panning for genes. Bioinformatics 1:76–92.
[8] Liu B, Wang X, Zou Q, Dong Q, Chen Q (2013) Protein remote homology detection by combining chous pseudo amino acid composition and profile-based protein representation. Mol Inf 32(9–10):775–782.
[9] Altschul SF, Gish W, Miller W, Myers EW, Lipman DJ (1990) Basic local alignment search tool. J Mol Biol 215(3):403–410.
[10] Halko, N.H., Martinsson, P.-G., Shkolnisky, Y., Tygert, M.: An algorithm for the principal component analysis of large data sets. SIAM J. Sci. Comput. 33(5), 2580–2594 (2011).
[11] Carlos Ordonez Et.Al.” PCA for large data sets with parallel data summarization” Distrib Parallel Databases (2014) 32:377–403, Springer, DOI 10.1007/s10619-013-7134-6.
[12] Alexios Kotsifakos et.al.” DRESS: dimensionality reduction for efficient sequence search”, Data Min Knowl Disc (2015) 29:1280–1311, Springer, DOI 10.1007/s10618-015-0413-2.
[13]Ester M, Kriegel H, Sander J, Xu X (1996) A density-based algorithm for discovering clusters in large spatial databases with noise. Int Conf Knowl Discov Data Min 96(34):226–231
[14] Dongkuan Xu et.al,” A Comprehensive Survey of Clustering Algorithms”. Ann. Data. Sci. Springer-Verlag Berlin Heidelberg 2015.
[15] Dean, Jeffrey, and Sanjay Ghemawat. "MapReduce: simplified data processing on large clusters." Communications of the ACM 51, no. 1 (2008): 107-113. [16] Nivranshu Hans et.al,” Big Data Clustering Using Genetic Algorithm On Hadoop Mapreduce”. INTERNATIONAL JOURNAL OF SCIENTIFIC & TECHNOLOGY RESEARCH VOLUME 4, ISSUE 04, APRIL 2015: 58-62.
[17] J. Dean and S. Ghemawat. Mapreduce: Simplified data processing on large clusters. OSDI, 2004.
[18] Jeffrey Dean and Sanjay Ghemawat, “MapReduce: Simplified Data Processing on Large Clusters” Google, Inc.USENIX Association OSDI ’04: 6th Symposium on Operating Systems Design and Implementation.
[19] Altschul S, Madden T, Schffer R, Zhang J, Zhang Z, MillerW, Lipman D (1997) Gapped blast and psi-blast: a new generation of protein database search programs. Nucleic Acids Res 25:3389–3402.
[20] Korf I, Gish W (2000) Mpblast : improved blast performance with multiplexed queries. Bioinformatics 16:1052–1053.
[21] Bhadra R, Sandhya S, Abhinandan KR, Chakrabarti S, Sowdhamini R, Srinivasan N (2006) Cascade psiblast web server: a remote homology search tool for relating protein domains. Nucleic Acids Res 34(Web–Server– Issue):143–146.
[22] Zhang Z, Schwartz S,Wagner L,MillerW(2000) A greedy algorithm for aligning dna sequences. J Comput Biol 7:203–214.
[23] Kent WJ (2002) Resource BLAT-The BLAST-like alignment tool. Genome Res.
[24] SunY,Han J,YanX,Yu PS,Wu T (2011) Pathsim: meta path-based top-k similarity search in heterogeneous information networks. PVLDB 4(11):992–1003. [25] Hastie, T., Tibshirani, R., Friedman, J.H.: The Elements
of Statistical Learning, 1st edn. Springer, New York (2001).
[26] Ming Ji Et.al,” Mining strong relevance between heterogeneous entities from unstructured biomedical data”, Data Min Knowl Disc (2015) ,Springer,29:976– 998. DOI 10.1007/s10618-014-0396-4.
[27] Max Bodoia , “MapReduce Algorithms for k-means Clustering”.