Comparison of the Performance of IPFC
(series-series) and UPFC (series-shunt) FACTS Controller in
Power System
Samima Akter
P.G.Scholar
Priyanath Das,
PhD. Associate ProfessorDepartment of Electrical Engineering, National Institute of Technology Agartala, Jirania, Tripura (west), Pin - 799055, India
.
ABSTRACT
Modeling, simulation and comparison of the performance of IPFC (series-series) and UPFC (series-shunt) FACTS controllers for voltage stability enhancement and improvement of power (real and reactive power) transfer capability have been presented in this paper. A simple transmission line system is modeled in MATLAB/SIMULINK software. Initially, basic transmission line system model is simulated. After simulating this uncompensated model, power flow results are obtained. The power profile has been studied for an uncompensated system. Results obtained for the uncompensated system are then compared with the results obtained after compensating the system using IPFC (series-series) and UPFC (series-shunt) FACTS devices. The simulation results demonstrate performance of the system with the inclusion of the above (IPFC and UPFC) FACTS devices in improving the voltage stability and power profile. All simulations have been carried out in MATLAB/SIMULINK environment.
General Terms
MATLAB/SIMULINK, FACTS, Power Flow, Voltage Stability
Keywords
FACTS, voltage profile, IPFC, UPFC, voltage security, PSPICE
1.
INTRODUCTION
Modern power systems are highly complex and are designed as such to fulfil the growing demands of power with better power quality. High technology now-a-days are being used for controlling power flow. Due to this, power quality is improved. Modern technology and new constructions of transmission line are also needed for improving power system security, profitability and reliability. Apart from these factors, restructuring of transmission line are expensive and also take considerable amount of time. Restructuring of transmission line and increasing demand on the transmission network has resulted in reduction of stability margins and increased the risks of cascading outages and blackout (voltage collapse) [1]. Voltage collapse occurs when power systems are heavily loaded, faulted, or have reactive power shortages. Voltage collapse is system instability and it occurs due to many power system components [5].
Voltage instability is the inability of the power system to meet the demand for reactive power in the heavily loaded system. One of the most important cause of voltage instability in a system is the occurrence of reactive power imbalance in the system [11]. Reactive power imbalance occurs when system is faulted, heavily loaded and voltage fluctuation is there. This problem can be effectively tackled by the introduction of high power electronic controllers which can inject or absorb reactive power as per system requirement. One of the most important reactive power sources is FACTS (Flexible A.C transmission system) device. These devices allow “Flexible” operation of AC transmission system without stressing the system. This paper investigates the performance of series-series (Interline Power Flow Controller) and series-shunt (Unified Power Flow Controller) FACTS controllers by compensating real and reactive power flow.
Shunt compensation is used in all high voltage, EHV systems to supply reactive power and improve voltage profile. Series compensation is used to increase transmission line capacity, system stability etc. The benefits of employing FACTS are many [12], [19]:
Reduction of system losses
Improvement of dynamic and transient stability
Control of real and reactive power as per system requirement
Voltage stability and security improvement
Flexibility in operation
Less active and reactive power loss
Power profile and power quality improvement
Optimal system operation
Improving line capacity and loadability of the system
Increasing power flow capability through the transmission line
Voltage stability and voltage regulation improvement
Efficiency of the system improvement
Voltage margin improvement
FACTS controllers can be divided in four categories:-
Shunt controller-SVC and STATCOM,
Series controller-TCSC, SSSC and TCPAR
Series-series-IPFC
This paper deals with comparison between IPFC and UPFC FACT devices.
1.1 Literature Review
Thorough research works are going on in finding newer concepts for minimizing the reason of voltage collapse. Minimizing reason of voltage collapse means increasing power system stability (Dynamic, transient and steady-state stability), voltage margin and voltage security in the system [3]. Voltage collapse occurs in a system when transmission lines are heavily loaded, power demand is increased, faults occurring in a system etc. So, many methods are used for determining voltage stability. There are three types of voltage stability: static voltage stability, dynamic voltage stability and transient voltage stability [5]. Ref. [7] investigates the enhancement of steady-state voltage stability for a secure power system using SVC (static VAR compensator) and TCSC (Thyristor controlled series capacitor). To investigate the effectiveness of the FACTS (Flexible A.C transmission system) controller under different fault conditions the equal area-criteria is applied and simulation is conducted in [8]. In [9], performance of the UPFC for power system stability (dynamic stability) improvement is compared with the other FACTS devices (SVC, TCSC and SSSC) by using two-area criteria. Power electronic based controllers are now-a-days being used for solving instability problem. Effectiveness of SVC and STATCOM in improvement of voltage security of a multi-bus power network has been studied in [10].
For improving power flow and voltage stability FACTS controller were first introduced in HVDC transmission line. In [11], performance analysis and comparison of various FACTS devices [FC, SVC, and STATCOM] in power system have been studied. A systematic procedure for modelling, simulation and optimal tuning of SSSC-based controller in a multi-machine power system has been studied in [13]. Modeling and digital simulation of IPFC (Interline power flow controller) and UPFC (unified power flow controller) was done by using MATLAB and PSPICE software in [14]. In [15], effects of SVC and STATCOM in static voltage stability margin enhancement were studied. Simulation and comparison of various FACTS devices (FC-TCR, UPFC) using program with integrated circuits emphasis (PSPICE) software have been done in [16]. IPFC FACTS controller provides optimal system operation by reducing the power loss and improving the voltage profile [17]. In [18], saddle node bifurcation analysis is applied for finding optimal location of SVC and TCSC.
In this paper comparison and detailed analysis of the performance of IPFC series) and UPFC (series-shunt) FACTS (Flexible A.C transmission system) controllers have been done using MATLAB/SIMULINK software. First we determine the impedance (line impedance and source impedance) value for optimum performance. By varing the value of capacitor (d.c link) of IPFC and UPFC models, power flow through the system is tabulated and studied to find the FACTS device which gives desirable performance at low capacitor rating.
2.
PERFORMANCE ANALYSIS OF
FACT DEVICES
[image:2.595.328.541.135.297.2]2.1
System Model
Figure 1: Uncompensated system model
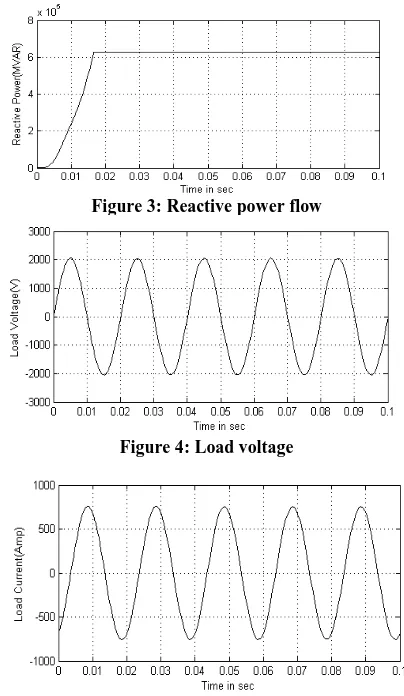
Figure [1] shows the basic transmission line model of an uncompensated system. Above system is modeled in MATLAB/SIMULINK software. In the above system model two scopes, two voltage measurements block, two current measurement blocks and one active and reactive power block are provided. 11KV voltage is supplied from the ac voltage source to the basic transmission line model. The source impedance branch (0.01+0.001) Ω is represented by R1, L1, line impedance branch (5+0.033)Ω represented by R2, L2 and load is kept fixed at 20MW and 40MVAR represented by R3,L3 respectively. Scopes display the real power (P) and reactive power (Q), source voltage (V) and source current (I), load voltage (V1) and
load current (I1) generated during simulation. Voltage
measurement block is used to measure the source and load voltage, current measurement block is used to measure the instantaneous current flowing through the transmission line, active and reactive power block is used to measure the real and reactive power in load side. Results obtained after simulation are shown below:
[image:2.595.338.521.534.639.2]Figure 3: Reactive power flow
Figure 4: Load voltage
.
Figure 5: Load current
Load voltage is found to be 2.0kv when uncompensated system model is simulated using MATLAB/SIMULINK software. Power flow is obtained without any compensation. The graphs obtained show that receiving end voltage is far below the sending end voltage for stable operation of the system. In order to keep the system stable we have to provide reactive power compensation. Voltage stability also depends on reactive power. In this paper, to get better system performance, IPFC (series-series) and UPFC (series-shunt) FACTS controllers have been studied and compared to obtained the best compensation under a given operating condition. All the plots for the compensated IPFC and UPFC systems have been shown for a capacitor value 250µF
.
2.2 Compensated System Model
2.2.1 IPFC Compensated
[image:3.595.317.548.74.220.2]The SIMULINK model of IPFC with line voltage of 11kv is shown below:
Figure 6: IPFC compensated system
The above figure shows the compensated model of Interline power flow controller (IPFC). IPFC is simulated for different capacitor values. For a particular value of capacitor(250µF) plots for real power(P), reactive power(Q), load voltage(V1) and load current(I1) are shown
[image:3.595.336.525.331.573.2]below.
[image:3.595.348.540.626.734.2]Figure 7: Real power flow
Figure 8: Reactive power flow
45 .
Figure 10: Load current
[image:4.595.322.557.86.233.2]Real power, reactive power and receiving end voltage have been obtained by varing the capacitor value till 1400µF. Power profiles obtained for different capacitor values of the controller are tabulated below:
Table 1: Variation in power flow for different values of capacitance
From the above table, it is seen that both power flows are improved impressively up to a certain limit of capacitance (1300µF). Beyond this, if we increase the value of capacitance then power profile deteriorates. So, best compensation is obtained for a capacitor value of 1300µF for this system. Also receiving end voltage is improved proportionally with increase in capacitance value.
2.2.2 UPFC compensated
The SIMULINK model for a UPFC (unified power flow controller) compensated system is shown below:
Figure 11: UPFC compensated system
The above configuration shows the basic model of UPFC [image:4.595.333.534.324.711.2]
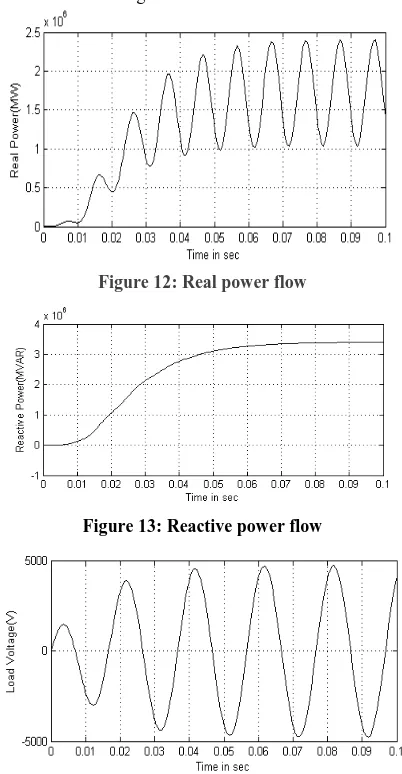
FACTS device connected to the system. The model is compensated for various capacitor values. Plots showing theimprovement in power profiles as well as load voltage and load current are given below:
Figure 12: Real power flow
Figure 13: Reactive power flow
Figure 14: Load voltage
SL
NO
Capacita
nce
(µF)
Real
Power
(MW)
Reactive
Power
(MVAR)
1 150 0.540 0.76
2 180 0.56 0.795
3 200 0.58 0.82
4 250 0.62 0.875
5 300 0.66 0.94
6 400 0.77 1.08
7 600 1.05 1.47
8 800 1.42 2.00
9 900 1.9 2.65
10 1000 1.9 2.65
11 1100 2.08 3.00
12 1200 2.2 3.15
13 1300 2.2 3.16
14 1400 2.15 3.0
0.5 1 1.5 2 2.5 3 3.5
Real power
[image:4.595.69.283.331.542.2]From the above graphs, it is seen that there is an improvement in the power profile (real and reactive power) as well as the receiving end voltage after simulation. At capacitor value 150µF, real power
(0.91MW), reactive
[image:5.595.76.282.79.199.2]Power (1.27MVAR) and receiving end voltage (2.9kv) are obtained. Power flows obtained with change in capacitance are tabulated below:
[image:5.595.310.548.132.333.2]Figure 15: Load current
Table 2: Variation in power flow for different values of capacitance
From the above table, it is seen that real and reactive power increases with the introduction of capacitance up to 250µF. At this point, injection of real and reactive power to the system is maximum. If the capacitance value is increased beyond this point, then power and voltage profile both will deteriorate. In case of UPFC controller at capacitor rating 250µF and 1300µF voltage is found to be 4.7KV and 2.4KV respectively. So, we can conclude that desirable performance is obtained in case of UPFC (series-shunt) compensated system at capacitor rating 250µF.
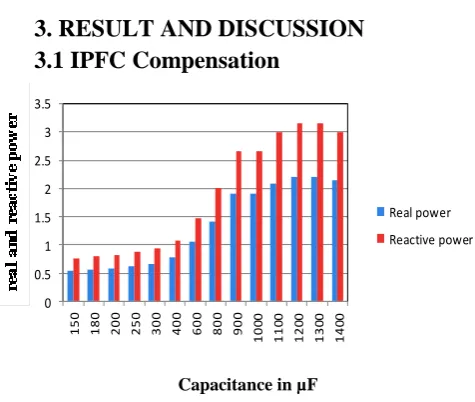
3. RESULT AND DISCUSSION
3.1 IPFC Compensation
Capacitance in µF
Figure 16: Variation in power flow for different value of capacitance (150-1400µF)
Above graph shows the variation of power flow for different capacitor values for an IPFC connected to the system. Power flows (real and reactive) improve proportionally with increase in capacitance up to 1300µF. Beyond this; if we increase the value of capacitance then power flow is decreased. So, in this case desirable performance is obtained at capacitor value 1300µF
.
3.2 UPFC Compensation
Capacitance in µF
Figure 17: Variation in power flow for different value of capacitance (150-1400µF)
SL
NO
Capacitan
ce(µF)
Real
Power
(MW)
Reactive
Power
(MVAR)
1 150 0.91 1.27
2 180 1.6 2.28
3 200 2.00 2.85
4 250 2.375 3.35
5 300 2.12 2.98
6 400 1.42 2.03
7 600 0.95 1.32
8 800 0.78 1.1
9 900 0.725 1.02
10 1000 0.685 0.97
11 1100 0.65 0.925
12 1200 0.62 0.92
13 1300 0.60 0.865
14 1400 0.6 0.85
0 0.5 1 1.5 2 2.5 3 3.5
150 180 200 250 300 400 600 800 900
1
0
0
0
1
1
0
0
1
2
0
0
1
3
0
0
1
4
0
0
[image:5.595.72.293.258.454.2] [image:5.595.322.563.486.643.2]From the above graph [17] it is clear that real and reactive power flow is improved impressively up to a capacitor rating of 250µF beyond which it deteriorates.
[image:6.595.72.285.180.373.2]4. COMPARISON TABLE
Table 3: Comparison between IPFC and UPFC FACTS Device for real and reactive power improvement
Fact Device
Capacitance(250µF) Capacitance(1300µF)
Real Power
(MW)
Reactive power
(MVAR)
Real Power
(MW)
Reactive Power
(MVAR)
IPFC
(series-series)
0.62 0.875 2.2 3.16
UPFC
(series-shunt)
2.375 3.35 0.60 0.865
From the above comparison table, it is seen that there is considerable improvement in real and reactive power with change in capacitance value. At capacitor rating 250µF series-shunt (UPFC) FACTS device is seen to give optimum performance and in case of series-series (IPFC) FACTS device at capacitor rating of 1300µF gives best results. But increased capacitor rating means increase in the cost of the equipment. So, we can conclude that UPFC gives better performance (power profile) when compared to IPFC for a given operating condition with much low value of capacitance.
5. COMPARISON GRAPH
Capacitance in µF
Capacitance in µF
Figure 18: Comparison graph between IPFC and UPFC FACTS Devices for power flow improvement
Above comparison graph shows the behaviour (real and reactive power) of IPFC and UPFC FACTS devices for different capacitor rating (150-1400µF). From this graph it
is observed that in case of UPFC FACTS controllers, real & reactive power improves only up to a certain value of capacitance (250µF) beyond which it deteriorates. Again we see that both power profiles are compensated to a large extent when IPFC FACTS controller is incorporated into the system and power flow improves directly with the increase in capacitor rating upto (1300µF). Beyond this, increasing the capacitance value deteriorates the power profile. So, after comparing the performances of UPFC and IPFC, UPFC controller is found to give optimum performance at capacitor rating of 250µF.
6. CONCLUSION
MATLAB/ SIMULINK environment is used for this comparative study to model and simulate IPFC and UPFC connected to a simple transmission line. In this paper, the voltage stability enhancement and power profile improvement by IPFC and UPFC FACTS devices is presented. Real and reactive power of the system is compared with and without the presence of IPFC and UPFC in the system. Then performance of series-series (IPFC) and series-shunt (UPFC) FACTS compensators is compared. It is seen from the above simulation results that both the power flow and voltage profiles are improved with the addition of the above compensating devices. IPFC provides compensation from a capacitor value as low as 150µF but gives better performance at capacitor rating 1300µF after which its performance (power profile and voltage profile) deteriorates. UPFC will give desirable performance (real power 2.375MW, reactive power 3.35MVAR and receiving end voltage 4.7KV) at capacitor rating 250µF. But IPFC fails to give any impressive performance beyond this point. If the rating of capacitor is increased then cost of the equipment is also increased. So, after comparing the performances of series-series(IPFC) and series-shunt(UPFC) FACTS devices it can be concluded that desirable performance is obtained with the addition of UPFC(series-shunt) to the system for a capacitor value of 250µF.
7. REFERENCES
[1] K. R. Padiyar, “Facts Controllers in Power Transmission and Distribution,”
[2] N. G Hingorani & Laszlo Gyugyi, “Understanding FACTS: concepts and technology of flexible AC transmission System”, IEEE Press, New York (2000).
[3] Samima Akter, Anulekha Saha and Prof. Priyanath Das, “Modelling, Simulation and Comparison of Various FACTS Devices in Power System”, International Journal of Engineering Research and Technology, ISSN: 2278-0181, Vol.1, Issue 8, October-2012
.
[4] CIGRE, “FACTS Overview”, IEEE Power Engineering Society, 95 TP 108, April 1995
.
[5] Abhijit Chakrabarti & Sunita Halder, “Power SystemAnalysis Operation and Control”.
[image:6.595.51.300.523.685.2]
[7] Bhavin. M. Patel,” Enhancement of Steady State Voltage Stability Using SVC and TCSC”, National Conference on Recent Trends in Engineering & Technology, 13-14May2011.
[8] Rahul Somalwar and Manish Khemariya,”A Review of Enhancement of Transient Stability by FACTS Devices”, International Journal of Emerging Technologies in Sciences and Engineering, Vol.5, No.3, March2012
[9] D. Murali, Dr. M. Rajaram & N. Reka, “Comparison of FACTS Devices for Power System Stability Enhancement”, International Journal of Computer Applications, Volume8-No.4, October 2010
.
[10] Priyanath Das, Sunita Halder nee Dey, AbhijitChakrabarti and Tanaya Dutta,”A Comparative Study in Improvement of Voltage Security in A Multi-Bus Power System using STATCOM and SVC’, International Conference on Energy, Automation and Signal (ICEAS), 28-30De, 2008.
[11] Anulekha Saha, Priyanath Das and Ajoy kumar chakraborty,”Performance Analysis and Comparison of Various FACTS Devices in Power System”, International Journal of Computer Applications, Volume 46-No.15, May2012.
[12] Dr. B.R.Gupta & Er. Vandana Singhal,“ Power System Operation and Control”
[
13] Sidhartha Panda,”Modelling, Simulation and optimal tuning of SSSC-based controller in a multi-machine power system”, World Journal of Modelling and Simulation, Vol.6 (2010) No.2, pp. 110-121, England, UK.
[14] A.P.Usha Rani and B.S.Rama Reddy,” Modelling and Digital Simulation of Interline Power Flow Controller System”, International Journal of Computer and Electrical Engineering, Vol. 2, No.3, June 2010, 1793-8163.
[15] Mehdi Ahmadi Kamarposhti and Mostafa Alinezhad,”Comparison of SVC and STATCOM in Static Voltage Stability Margin Enhancement”, World Academy of Science, Engineering and Technology 50 2009
.
[16] S. Sankar, S. Balaji & S.Arul,”Simulation and Comparison of Various FACTS Devices in Power System”, International Journal of Engineering Science and Technology, Vol.2 (4), 2010, 538-547. [17] Akhilesh A. Nimje, Chinmoy Kumar Panigrahi, Ajaya
Kumar Mohanty, “Interline Power Flow Controller: Review paper”, International Electrical Engineering Journal(IEEJ),ISSN 2078-2365, Vol.2(2011), No. 3, pp. 550-554
.
[18] Ahad Kazemi and Babak Badrezadeh,”Modelling and Simulation of SVC and TCSC to Study their Effects on Maximum Loadability point”, EPRI technical report EL-4365, April 1987.