The Effects of Different Noise Types on Heart Rate
Variability in Men
Chang Sun Sim,
1Joo Hyun Sung,
1Sang Hyeon Cheon,
2Jang Myung Lee,
3Jae Won Lee,
4and Jiho Lee
1Departments of 1Occupational and Environmental Medicine and 2Urology, Ulsan University Hospital, University of Ulsan College of Medicine, Ulsan; 3Department of Mechanical Engineering, University of Ulsan College of Engineering, Ulsan;
4Indoor Environment & Noise Research Division, National Institute of Environmental Research, Incheon, Korea.
Received: January 2, 2014 Revised: April 3, 2014 Accepted: April 18, 2014 Corresponding author: Dr. Jiho Lee, Department of Occupational and Environmental Medicine, Ulsan University Hospital,
University of Ulsan College of Medicine, 877 Bangeojinsunhwan-doro, Dong-gu, Ulsan 682-714, Korea.
Tel: 82-52-250-7288 , Fax: 82-52-250-7289 E-mail: [email protected]
∙ The authors have no financial conflicts of interest.
© Copyright:
Yonsei University College of Medicine 2015 This is an Open Access article distributed under the terms of the Creative Commons Attribution Non-Commercial License (http://creativecommons.org/ licenses/by-nc/3.0) which permits unrestricted non-commercial use, distribution, and reproduction in any medium, provided the original work is properly cited.
Purpose: To determine the impact of noise on heart rate variability (HRV) in men, with a focus on the noise type rather than on noise intensity. Materials and Meth-ods: Forty college-going male volunteers were enrolled in this study and were ran-domly divided into four groups according to the type of noise they were exposed to: background, traffic, speech, or mixed (traffic and speech) noise. All groups ex-cept the background group (35 dB) were exposed to 45 dB sound pressure levels. We collected data on age, smoking status, alcohol consumption, and disease status from responses to self-reported questionnaires and medical examinations. We also measured HRV parameters and blood pressure levels before and after exposure to noise. The HRV parameters were evaluated while patients remained seated for 5 minutes, and frequency and time domain analyses were then performed. Results: After noise exposure, only the speech noise group showed a reduced low frequen-cy (LF) value, reflecting the activity of both the sympathetic and parasympathetic nervous systems. The low-to-high frequency (LF/HF) ratio, which reflected the ac-tivity of the autonomic nervous system (ANS), became more stable, decreasing from 5.21 to 1.37; however, this change was not statistically significant. Conclu-sion: These results indicate that 45 dB(A) of noise, 10 dB(A) higher than back-ground noise, affects the ANS. Additionally, the impact on HRV activity might dif-fer according to the noise quality. Further studies will be required to ascertain the role of noise type.
Key Words: Autonomic nervous system, heart rate variability, noise
INTRODUCTION
The term noise refers to undesirable sound. Noise has become the most frequently encountered environmental pollutant in daily life due to several reasons such as improved standards of living, urbanization, and industrialization. In Korea, noise-related complaints account for 35.4% of all environment-noise-related complaints, indi-cating that problems with noise are not restricted to people with specific occupa-tions; rather, they are ubiquitous, independent of sex, age, and region.
pre-exposure and post-exposure HRV parameter results with background, traffic, speech, and mixed noise (traffic and speech). Second, we evaluated the impact of noise on the ANS as measured by the HRV, depending on the noise type and sound quality.
MATERIALS AND METHODS
Subjects
We recruited 40 volunteers from a single college through advertisements and classified the volunteers into four groups according to the type of noise they were exposed to: back-ground noise, traffic noise, speech noise, and mixed noise (traffic and speech). All subjects were healthy; they had no medical problems and were not taking medications that would influence HRV. Approval for this study was obtained from the Review Committee at Ulsan University Hospital with regard to scientific and ethical considerations (UUH-IRB-11-109).
Methods
Questionnaire
A week before the test, we distributed consent forms, infor-mation leaflets, and questionnaires to the subjects. The questionnaires requested information regarding socio-de-mographic variables such as age, smoking status, drinking status, presence of disease, susceptibility to noise, hobbies related to noise or sound, sleep status, psychosocial stress state, and the ability to cope with stress. To measure the psychosocial stress level, we used the psychosocial well-being index short form (PWI-SF), which was composed of
four items and 18 questions.24 To assess the ability to cope
with stress, we used the Connor-Davidson resilience scale
(CD-RS), which included five items and 25 questions.25
Qualitative analysis of noise sources and sounds
The proposed noise sources were self-made and were clas-sified into four types. The sound quality was analyzed using Harmony-SQ 1.0 (SCIEN Co. Ltd., Taipei, Taiwan). Back-ground noise to which the control group was exposed was set to the basic environmental noise level [35 dB(A)]. The traffic noise to which the experimental groups were exposed to comprised aircraft and road traffic noise. Speech noise comprised noise similar to that produced by several people talking simultaneously. Mixed noise comprised both traffic to annoyance. The direct health-related effects of noise on
humans are hearing impairment, speech disturbance, per-formance issues, mental problems, sleep disturbance, and
annoyance,1-4 while indirect health-related effects are
dys-function of the autonomic nervous system (ANS) and car-diovascular system.
The ANS, a peripheral nervous system component, con-trols smooth muscle, myocardium, external secretion glands,
and some internal secretion glands to maintain homeostasis.15
Factors that can affect the ANS include noise, mental stress,
temperature, vibration, smoking, and exercise.16-20 The
influ-ence of noise on the ANS manifests as sympathetic
hyperac-tivity, as noise is known to act as a stressor.5-7 To measure the
impact of noise on the human body, including the ANS, vari-ous surveys have often been conducted, which usually in-clude questionnaires to assess annoyance, sleep disorders, cognitive performance, and task performance, as well as tests
to assess hormone levels and heart rate variability (HRV).5,8-14
HRV refers to cyclic changes in the heart rate and acts as a non-invasive electrocardiographic marker, reflective of the activities of the sympathetic and vagal components of
the ANS on the cardiac sinus node.21 In 1996, the European
Society of Cardiology and the North American Society of Pacing and Electrophysiology organized a task force team of experts in their respective fields to standardize the termi-nology and measurement methods and define physiological and pathological inter-relationships in order to establish
ap-propriate standards for HRV.14
Currently, there are several papers on the relationship be-tween noise exposure and HRV. For example, Umemura
and Honda22 and Björ, et al.18 showed that the type and
presence of noise, respectively, could affect HRV results.
Additionally, Lee, et al.23 reported that HRV results were
af-fected by the level of noise.
To date, most HRV studies have used sound pressure lev-els that exceed 50 dB(A). Furthermore, questionnaire sur-veys have been the most common method of assessing the impact of sound quality on health, and as such, the rele-vance of HRV as an objective indicator has not been estab-lished. Therefore, we aimed to identify the impact of sound type and quality on ANS activity on the heart in an environ-ment where the sound intensity was limited to levels below 50 dB(A), which is known not to have a significant impact on the human body.
Statistical analysis
The Kruskal-Wallis test was used to compare age, anthro-pometric measurements, audiometry results, and systolic and diastolic blood pressure measurements in the back-ground, traffic, speech, and mixed noise groups. We also performed the chi-square test to compare individual differ-ences in susceptibility to noise. Additionally, we performed the Mann-Whitney U test to compare individual abilities to cope with social and psychological stresses between the background noise group and the other groups. To account for interpersonal differences in heart rate indicators, we compared the values obtained before and after noise expo-sure. We used the Wilcoxon signed-rank test to compare the differences in variables within each group before and after noise exposure, and the Kruskal-Wallis test was used to compare the differences in the variables between the four groups before and after noise exposure. After adjusting for smoking status, alcohol consumption, body mass index (BMI), social status, psychological stress levels, and the ability to cope with stress, we used a general linear model to compare the differences in HRV according to the sound type. We used SPSS 19.0 software (IBM SPSS Inc., Chica-go, IL, USA) for data analysis. For each analysis, the sig-nificance level was 0.05.
RESULTS
Characteristics of the study subjects
The average age was 23.9±1.8 years, and the average BMI
was 23.7±2.1 kg/m2. There were no statistically significant
differences between the groups.
From the results of the audiometry test, the average hear-ing levels of the left and right ears were 7.7±4.1 and 9.0±3.5 dB, respectively; however, this difference was not statisti-cally significant. There were also no statististatisti-cally significant differences in the systolic and diastolic blood pressure lev-els before and after noise exposure and among the four groups (Table 1). Additionally, we found no statistically significant differences between the groups with regard to drinking and smoking status (data not shown).
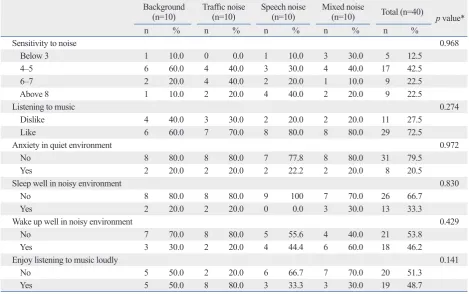
Noise susceptibility
On the basis of the results of the survey on noise susceptibil-ity (0‒10), scores in the range of 4‒5 accounted for 42.5% of scores. Overall, 72.5% of the subjects enjoyed listening to music, and 79.5% felt no anxiety when they were quiet. and speech noise. All noises types were set at levels of 45
dB(A). We analyzed sound quality in five domains: specific loudness (the strength of a sound as perceived by an individ-ual), specific sharpness (the sharpness of a sound), specific roughness (the roughness of a sound), fluctuation strength (the uniformity of a sound), and tonality (the dominance of
a certain utterance).26
Clinical examination and HRV testing
For 2 days, we examined 5 volunteers in each group (20 stu-dents per day) only in the morning, to minimize diurnal stress changes. We measured each volunteer’s height, weight, blood pressure (before and after noise exposure), and clini-cal laboratory values (aspartate aminotransferase‒alanine aminotransferase ratio; levels of γ-glutamyl transpeptidase, blood lipids, and blood glucose, as well as a complete blood count). A pure tone audiometry test and otoscopy were per-formed to identify any ear-related medical problems. Before exposure, we measured the blood pressure, heart rate, and HRV. We performed the same evaluations for all subjects during a 1-hour period, while presenting pre-configured and generated sounds [45 dB(A) level] through an amplifier (L1400, Intron-M, CA, USA) and speaker in an anechoic room. After noise exposure, we measured the blood pres-sure, heart rate, and HRV again.
Psychosocial stress states and the ability to cope with stress
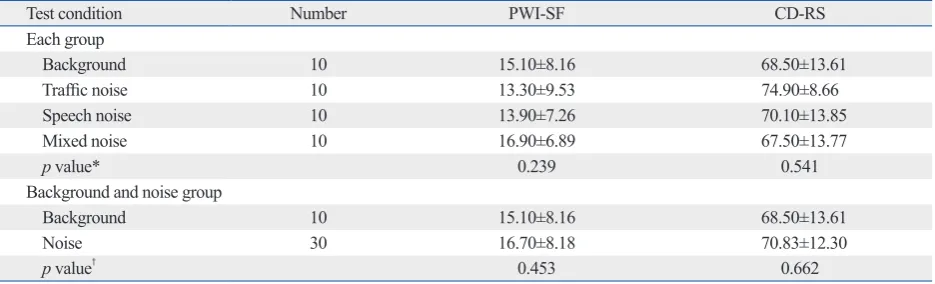
Susceptibility to noise was affected by the subjects’ social and psychological states of stress and their ability to cope with stress. Therefore, we used the PWI-SF and CD-RS to Additionally, 66.7% of the subjects could not sleep well in
[image:4.595.56.529.159.348.2] [image:4.595.56.526.428.722.2]noisy environments, and 46.2% woke easily in noisy envi-ronments, while 48.7% enjoyed loud music. There were no statistically significant differences between the four groups (Table 2).
Table 1. General Characteristics of Subjects According to Noise Groups
Background
(n=10) Traffic noise (n=10) Speech noise (n=10) Mixed noise (n=10) Total (n=40) p value† Ages (yrs) 24.7±1.3 24.5±1.8 23.0±1.8 23.2±1.8 23.9±1.8 0.096 Height (cm) 173.7±5.6 177.4±6.7 171.2±5.4 176.4±4.6 174.7±5.9 0.038 Weight (kg) 70.6±5.7 72.5±8.8 70.9±8.0 75.5±7.8 72.4±7.6 0.507 Body mass index (kg/m2) 23.4±2.2 23.0±2.2 24.2±2.1 24.2±1.9 23.7±2.1 0.561
PTA (dB)*
Left 8.5±2.3 9.3±5.6 7.5±4.4 5.5±2.9 7.7±4.1 0.134 Right 9.7±2.5 9.7±4.6 8.7±3.8 7.8±3.0 9.0±3.5 0.448 Pre-exposure
SBP‡ 127.8±10.9 124.4±10.9 130.6±9.9 128.6±9.6 127.9±10.2 0.666
DBP‡ 84.0±5.9 81.8±9.2 82.8±6.7 86.2±5.6 83.7±6.9 0.734
Post-exposure
SBP‡ 129.4±8.4 131.8±21.7 123.8±14.1 131.4±10.5 129.1±14.4 0.526
DBP‡ 86.4±5.0 90.0±16.9 79.0±9.5 89.2±7.4 86.2±11.2 0.056
PTA, pure tone audiometry; dB, decibel; SBP, systolic blood pressure; DBP, diastolic blood pressure. Mean±standard deviation.
*Pure tone average: average of hearing threshold at 500, 1000, and 2000 Hz.
†p-value was calculated by Kruskal-Wallis test.
‡Statistically no significant before and after noise exposure.
Table 2. Environmental Noise Sensitivity in Each Group
Background
(n=10) Traffic noise (n=10) Speech noise (n=10) Mixed noise (n=10) Total (n=40) p value*
n % n % n % n % n %
Sensitivity to noise 0.968
Below 3 1 10.0 0 0.0 1 10.0 3 30.0 5 12.5 4‒5 6 60.0 4 40.0 3 30.0 4 40.0 17 42.5 6‒7 2 20.0 4 40.0 2 20.0 1 10.0 9 22.5 Above 8 1 10.0 2 20.0 4 40.0 2 20.0 9 22.5
Listening to music 0.274
Dislike 4 40.0 3 30.0 2 20.0 2 20.0 11 27.5 Like 6 60.0 7 70.0 8 80.0 8 80.0 29 72.5
Anxiety in quiet environment 0.972
No 8 80.0 8 80.0 7 77.8 8 80.0 31 79.5 Yes 2 20.0 2 20.0 2 22.2 2 20.0 8 20.5
Sleep well in noisy environment 0.830
No 8 80.0 8 80.0 9 100 7 70.0 26 66.7 Yes 2 20.0 2 20.0 0 0.0 3 30.0 13 33.3
Wake up well in noisy environment 0.429
No 7 70.0 8 80.0 5 55.6 4 40.0 21 53.8 Yes 3 30.0 2 20.0 4 44.4 6 60.0 18 46.2
Enjoy listening to music loudly 0.141
No 5 50.0 2 20.0 6 66.7 7 70.0 20 51.3 Yes 5 50.0 8 80.0 3 33.3 3 30.0 19 48.7
type and found no statistically significant differences. In the speech noise group, the LF values were negative, in con-trast to values for the other noise groups (Table 5).
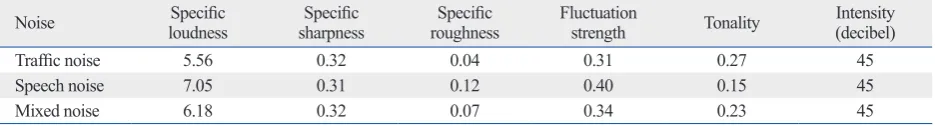
Sound quality analysis by noise type
When we compared the sound quality of speech noise with that of the other two noise types, we found that the specific loudness, specific roughness, and fluctuation strength were higher; however, the tonality was lower for speech noise. The parametric values of mixed noise were located be-tween the values for traffic and speech noise (Table 6).
DISCUSSION
It is generally accepted that noise exposure enhances
sympa-thetic nerve activity.18,27 Although investigators have sought
to measure stress responses to acute noise exposure, the currently used objective parameters include stress hormone
levels and HRV.9,10,28 Measurements of heart rate and blood
pressure changes are well established methods for
measur-ing overall cardiovascular responses.29 However, these
methods can exhibit immediate reactions upon exposure to strong noise, and it is difficult to identify such changes in
re-sponse to weak or moderate noise.30 Therefore, recent
stud-ies have investigated variables associated with ANS activity.
In a study by Lee, et al.,23 which compared HRV
accord-ing to noise loudness, no noise-related differences in HF, an indicator of parasympathetic nervous system activity, were observed when the same subjects were presented with white noise at levels of 23, 50, 60, 70, and 80 dB(A). However, significant increases were observed in LF and the LF/HF identify the degree of individual susceptibility. For the
PWI-SF, the mixed noise group received the highest score, 16.9± 6.89, among the four noise groups. For the CD-RS, the traf-fic noise group had a higher score than the other groups. However, there were no significant differences between the groups as a whole (Table 3).
HRV before and after noise exposure
Comparisons between the HRV subgroup parameters be-fore and after noise exposure revealed statistically signifi-cant differences in SDNN, PSI, TP, HF, and the LF/HF ra-tio. Moreover, after noise exposure, there were increases in SDNN, LF, and HF, yet a decrease in PSI. There were no significant differences between measurements taken before and after exposure to background noise. In the noise groups, there were statistically significant differences in SDNN, PSI, and HF. With regard to noise categories, the speech noise group showed a decrease in LF after noise exposure. There were no statistically significant differences between the traffic and mixed noise groups; however, similar pat-terns were observed throughout all groups (Table 4).
The differences between HRV parameter values before and after exposure were positive for SDNN, TP, VLF, and HF, although differences were negative for PSI and the LF/ HF ratio. In particular, only the speech noise group had negative LF and LF/HF ratio values, indicating a reduced pattern that contrasted with the other groups; however, this difference was not statistically significant (data not shown).
[image:5.595.72.540.557.699.2]After adjusting for alcohol consumption, smoking status, BMI, psychosocial stress state, and ability to cope with noise, we used a general linear model to compare the differ-ences in HRV before and after exposure according to noise
Table 3. Results of the Psychosocial Well-Being Index-Short form (PWI-SF) and Connor-Davidson Resilience Scale (CD-RS) for Each Group
Test condition Number PWI-SF CD-RS
Each group
Background 10 15.10±8.16 68.50±13.61 Traffic noise 10 13.30±9.53 74.90±8.66 Speech noise 10 13.90±7.26 70.10±13.85 Mixed noise 10 16.90±6.89 67.50±13.77
p value* 0.239 0.541
Background and noise group
Background 10 15.10±8.16 68.50±13.61 Noise 30 16.70±8.18 70.83±12.30
p value† 0.453 0.662
Mean±standard deviation.
*p-value was calculated by Kruskal-Wallis test.
ratio as the noise level increased. This finding was inter-preted as demonstrating increased sympathetic nervous sys-tem activity simultaneously with the increased acute noise level. Among studies that observed changes in heart rate
ac-cording to noise type, Umemura and Honda22 measured
changes in subjects’ heart rates after listening to classical music, rock music, and noise. Among subjects who listened to classical music, LF (an indicator of sympathetic nervous system activity) decreased during the stable stage, whereas among subjects who listened to rock music or noise, LF in-creased. This indicated that the sympathetic nervous system was inhibited in subjects who listened to classical music, yet excited in subjects who listened to rock music or noise. It can also be inferred that classical music would promote comfort, whereas rock music or noise would induce dis-comfort or tension. Therefore, it could be suggested that even noises of the same intensity may have different
im-pacts on the ANS, depending on the type of noise.31-34
In this study, which took place a basic dead room setting, we created a quasi-experimental environment and investigat-ed the influence of noise on the ANS according to the sound quality, rather than strength. Conversation with the subjects was not disrupted while background noise was presented at 35 dB(A), and traffic noise, speech noise, and mixed noise (traffic+speech) were presented at 45 dB(A). After noise exposure, both the systolic and diastolic blood pressure lev-els tended to increase; however, these increases were not statistically significant. This result implies that either the experimental noise levels did not significantly affect the hu-man body or it was difficult to determine changes in indica-tors such as blood pressure at low noise levels. After noise exposure, the HRV parameters SDNN, TP, VLF, LF, and HF increased; however, PSI decreased and the LF/HF ratio was closer to 1. These results suggest that with appropriate noise exposure levels, we could observe activated ANS function and an improved degree of overall balance between the sympathetic and parasympathetic nervous systems. Typically, the theory of noise acting as a stressor and exert-ing a negative impact on the human body has been domi-nant. According to the results obtained in this study, noise might act as a eustressor that relieves anxiety resulting from
silence.35 Additionally, these results suggest that an
appro-priate noise level can positively affect the ANS.
In this study, only subjects who were exposed to speech noise showed a reduced LF value. This finding reflects the inhibition of the sympathetic nervous system in this group. Furthermore, even for a given level of noise, the impact on
Table 4.
Summary of Statistics of Differences in Heart Rate V
ariability Parameters before and after Exposure
HRV parameters
Background noise (n=10)
Speech noise (n=10)
Traffic noise (n=10)
Mixed noise (n=10)
Noise total (n=30)
Total (n=40) Pre Post Pre Post Pre Post Pre Post Pre Post Pre Post SDNN 63.9±25.4 79.9±37.5 45.5±24.9 48.9±18.9 51.0±22.5 67.5±28* 62.4±30.5 69.9±35.1 53.0±26.3 62.1±28.8 † 55.7±26.2 66.5±31.6 † PSI 22.0±13.7 18.0±14.8 54.6±44.8 27.6±16.4* 36.0±27.7 20.3±12.8* 19.8±9.2 18.1±9.9 36.8±33.1 22.0±13.5 † 33.1±30.0 21.0±13.7 † TP 4086.4±5099.5 5694.0±5607.7 1954.9±2284.0 2299.3±2325.8 2222.4±2138.6 4052.8±3245.3* 3570.7±3424.6 4587.8±4737.1 2582.7±2682.4 3646.6±3591.6 2958.6±3433.1 4158.5±4201.8 † VLF 1775.5±3236.7 2073.9±2757.7 459.4±464.2 1328.5±1995.1 475.9±405.1 1463.7±1453.1* 1478.0±1750.8 2270.6±3758.7 804.4±1 141.8 1687.6±2540.5 1047.2±1889.0 1784.2±2565.7 LF 1256.2±1399.7 2158.3±2825.3 1226.2±1931.4 398.7±271.5 1216.0±1507.7 1699.4±1689.8 1257.2±1070.0 1258.8±1396.1 1233.1±1489.6 11 19.0±1347.5 1238.9±1449.9 1378.8±1843.9 HF 1054.7±858.5 1461.8±1 102.7 269.4±326 527.1±437.4* 530.5±543.0 889.6±900.2* 835.6±1039.6 1058.4±1483.5 545.2±717.8 840.0±1017.8 † 672.6±776.6 995.5±1060.8 † LF/HF ratio 1.9±1.5 1.8±1.9 5.2±10.2 1.4±2.1 3.4±4.0 2.9±2.8 2.5±2.0 2.1±2.5 3.7±6.3 2.1±2.5 3.3±5.6 2.0±2.3 †
SDNN, standard deviation of normal to normal intervals; PSI, physical stress index; TP
, total power; VLF
, very low frequency; LF
, low frequency; HF
, high frequency; H
RV , h ea rt ra te va ria bil ity
; Pre, pre-exposure; Post,
post-exposure. Mean±standard deviation. *p<0.05 by Wilcoxon
’
s signed rank test.
ber of subjects in each group was small (n=10). Several fac-tors can affect the heart rate and ANS, including age, sex, changes in blood pressure, respiratory activity, smoking, al-cohol consumption, caffeine use, physical activity, obesity, mental stress, emotional disorders, sleep disturbance, thy-roid dysfunction, and drug use. Additionally, HRV results
have been found to depend on age and sex.36-39 However, it
is impossible to control changes in each factor in real-life situations. We attempted to control confounders by restric-tion at the sampling stage (age and sex) and by statistical analysis (smoking, alcohol consumption, and BMI). In ad-dition, in order to consider the subjects’ states of stress be-fore performing the tests, we corrected for the psychosocial stress state and the ability to cope with stress before
analyz-ing the data.40
In conclusion, these results provide evidence that 45 dB(A) of noise, which is 10 dB(A) higher than the back-ground level, affects the ANS. Furthermore, the quality of the noise might affect HRV. Further studies will be required to ascertain the role of noise types and soundscapes.
ACKNOWLEDGEMENTS
This study was supported by research grants from the Na-tional Institute of Environmental Research of the Ministry
the ANS might differ according to the type of noise.31-34 In
this study, the LF/HF ratio decreased from 5.21 to 1.37 (clos-er to 1), suggesting that the ANS became more stable aft(clos-er speech noise exposure. Likely due to the fact that speech noise is more common and familiar than other noises, an appropriate level of speech noise increased the subjects’ comfort levels. These results are in accordance with those of previous studies, which showed that classical music
in-creased comfort and dein-creased the LF level.22
In the sound analysis, the specific loudness, specific roughness, and fluctuation of speech noise were higher than those of other noises, yet the tonality and specific sharpness of speech noise were lower. These characteristics of speech noise could be related to the level of stress.
Unlike previous studies, this study was designed to as-sess the qualitative impact of sound, rather than the intensi-ty of noise. Although the results were not statistically sig-nificant, we observed decreases in both the LF value and the LF/HF ratio in the speech noise group alone. According to the sound quality results, speech noise exhibited different characteristics from other noises. Moreover, it could be suggested that the qualitative elements of noise have an im-pact on stress levels. Although previous studies made little progress, the results of this study suggest a new direction in terms of qualitative noise.
This study has several limitations. For example, the
num-Table 5. Summary of Statistics of Differences in Heart Rate Variability Parameters for Each Group before and after Exposure, after Adjusting for Confounding Variables†
HRV parameters Background (n=10) Traffic noise (n=10) Speech noise (n=10) Mixed noise (n=10) p value* SDNN 17.42±6.92 17.07±7.15 -0.64±7.52 9.44±6.96 0.636 PSI -4.90±7.07 -18.66±7.31 -23.16±7.68 -1.72±7.11 0.199 TP 1963.50±926.34 1731.42±957.17 -298.71±1006.89 1403.11±931.85 0.471 VLF 526.29±836.74 705.79±864.59 603.58±909.50 1112.30±841.72 0.768 LF 928.91±592.37 718.59±612.09 -1091.47±643.88 3.63±595.90 0.470 HF 508.35±196.68 307.04±203.22 189.18±213.78 287.19±197.85 0.106 LF/HF ratio -0.14±2.03 0.10±2.10 -4.06±2.21 -0.78±2.05 0.742
SDNN, standard deviation of normal to normal intervals; PSI, physical stress index; TP, total power; VLF, very low frequency; LF, low frequency; HF, high frequency; HRV, heart rate variability; BMI, body mass index; PWI-SF, psychosocial well-being index short form; CD-RS, Connor-Davidson resilience scale; ANCOVA, analysis of covariance.
Estimated mean±standard error.
*p value was calculated by ANCOVA.
[image:7.595.69.538.94.196.2]†Confounding variables: smoking, alcohol, BMI, PWI-SF, CD-RS.
Table 6. Average Sound Quality Values
[image:7.595.72.540.290.353.2]18. Björ B, Burström L, Karlsson M, Nilsson T, Näslund U, Wiklund U. Acute effects on heart rate variability when exposed to hand transmitted vibration and noise. Int Arch Occup Environ Health 2007;81:193-9.
19. Kobayashi F, Watanabe T, Akamatsu Y, Furui H, Tomita T, Ohashi R, et al. Acute effects of cigarette smoking on the heart rate vari-ability of taxi drivers during work. Scand J Work Environ Health 2005;31:360-6.
20. Hayashi N, Nakamura Y, Muraoka I. Cardiac autonomic regula-tion after moderate and exhaustive exercises. Ann Physiol An-thropol 1992;11:333-8.
21. Sztajzel J. Heart rate variability: a noninvasive electrocardio-graphic method to measure the autonomic nervous system. Swiss Med Wkly 2004;134:514-22.
22. Umemura M, Honda K. Influence of music on heart rate variabili-ty and comfort--a consideration through comparison of music and noise. J Hum Ergol (Tokyo) 1998;27:30-8.
23. Lee GS, Chen ML, Wang GY. Evoked response of heart rate vari-ability using short-duration white noise. Auton Neurosci 2010; 155:94-7.
24. Kim KH, Kim JW, Kim SH. Influences of job stressors on psy-chosocial well-being, fatigue and sleep sufficiency among fire-fighters. Korean J Occup Environ Med 2006;18:232-45. 25. Baek HS, Lee KU, Joo EJ, Lee MY, Choi KS. Reliability and
va-lidity of the Korean version of the connor-davidson resilience scale. Psychiatry Investig 2010;7:109-15.
26. Prakash A, Joute K, Jain VK. An estimation of annoyance due to various public modes of transport in Delhi. Noise Health 2006; 8:101-7.
27. Tzaneva L, Danev S, Nikolova R. Investigation of noise exposure effect on heart rate variability parameters. Cent Eur J Public Health 2001;9:130-2.
28. Dishman RK, Nakamura Y, Garcia ME, Thompson RW, Dunn AL, Blair SN. Heart rate variability, trait anxiety, and perceived stress among physically fit men and women. Int J Psychophysiol 2000;37:121-33.
29. Carter N, Henderson R, Lal S, Hart M, Booth S, Hunyor S. Car-diovascular and autonomic response to environmental noise dur-ing sleep in night shift workers. Sleep 2002;25:457-64.
30. Holand S, Girard A, Laude D, Meyer-Bisch C, Elghozi JL. Effects of an auditory startle stimulus on blood pressure and heart rate in humans. J Hypertens 1999;17(12 Pt 2):1893-7.
31. Alvarsson JJ, Wiens S, Nilsson ME. Stress recovery during expo-sure to nature sound and environmental noise. Int J Environ Res Public Health 2010;7:1036-46.
32. Trimmel M, Atzlsdorfer J, Tupy N, Trimmel K. Effects of low in-tensity noise from aircraft or from neighbourhood on cognitive learning and electrophysiological stress responses. Int J Hyg Envi-ron Health 2012;215:547-54.
33. Byers JF, Smyth KA. Effect of a music intervention on noise an-noyance, heart rate, and blood pressure in cardiac surgery patients. Am J Crit Care 1997;6:183-91.
34. White JM. Effects of relaxing music on cardiac autonomic bal-ance and anxiety after acute myocardial infarction. Am J Crit Care 1999;8:220-30.
35. Selye H. Confusion and controversy in the stress field. J Human Stress 1975;1:37-44.
36. Kim GM, Woo JM. Determinants for heart rate variability in a normal Korean population. J Korean Med Sci 2011;26:1293-8. 37. Liao D, Barnes RW, Chambless LE, Simpson RJ Jr, Sorlie P,
of Environment, Republic of Korea (grant number: 2011-0916).
REFERENCES
1. Sandrock S, Schutte M, Griefahn B. Mental strain and annoyance during cognitive performance in different traffic noise conditions. Ergonomics 2010;53:962-71.
2. Elmenhorst EM, Elmenhorst D, Wenzel J, Quehl J, Mueller U, Maass H, et al. Effects of nocturnal aircraft noise on cognitive per-formance in the following morning: dose-response relationships in laboratory and field. Int Arch Occup Environ Health 2010;83:743-51.
3. Saremi M, Grenèche J, Bonnefond A, Rohmer O, Eschenlauer A, Tassi P. Effects of nocturnal railway noise on sleep fragmentation in young and middle-aged subjects as a function of type of train and sound level. Int J Psychophysiol 2008;70:184-91.
4. Sandrock S, Schütte M, Griefahn B. Impairing effects of noise in high and low noise sensitive persons working on different mental tasks. Int Arch Occup Environ Health 2009;82:779-85.
5. Goyal S, Gupta V, Walia L. Effect of noise stress on autonomic function tests. Noise Health 2010;12:182-6.
6. Umemura M, Honda K, Kikuchi Y. Influence of noise on heart rate and quantity of work in mental work. Ann Physiol Anthropol 1992;11:523-32.
7. Tassi P, Saremi M, Schimchowitsch S, Eschenlauer A, Rohmer O, Muzet A. Cardiovascular responses to railway noise during sleep in young and middle-aged adults. Eur J Appl Physiol 2010;108: 671-80.
8. Findeis H, Peters E. Disturbing effects of low frequency sound immissions and vibrations in residential buildings. Noise Health 2004;6:29-35.
9. Ising H, Braun C. Acute and chronic endocrine effects of noise: Review of the research conducted at the Institute for Water, Soil and Air Hygiene. Noise Health 2000;2:7-24.
10. Babisch W. Stress hormones in the research on cardiovascular ef-fects of noise. Noise Health 2003;5:1-11.
11. Basner M, Müller U, Elmenhorst EM. Single and combined ef-fects of air, road, and rail traffic noise on sleep and recuperation. Sleep 2011;34:11-23.
12. Zekveld AA, Kramer SE, Festen JM. Cognitive load during speech perception in noise: the influence of age, hearing loss, and cognition on the pupil response. Ear Hear 2011;32:498-510. 13. Siu KC, Suh IH, Mukherjee M, Oleynikov D, Stergiou N. The
impact of environmental noise on robot-assisted laparoscopic sur-gical performance. Surgery 2010;147:107-13.
14. Heart rate variability: standards of measurement, physiological in-terpretation and clinical use. Task Force of the European Society of Cardiology and the North American Society of Pacing and Electrophysiology. Circulation 1996;93:1043-65.
15. Kang SS. Biological sciences. Seoul: Academybook; 2000. 16. Lambert EA, Lambert GW. Stress and its role in sympathetic
ner-vous system activation in hypertension and the metabolic syn-drome. Curr Hypertens Rep 2011;13:244-8.
Cardiol 1996;28:1539-46.
39. Jensen-Urstad K, Storck N, Bouvier F, Ericson M, Lindblad LE, Jensen-Urstad M. Heart rate variability in healthy subjects is relat-ed to age and gender. Acta Physiol Scand 1997;160:235-41. 40. Parati G, Di Rienzo M. Determinants of heart rate and heart rate
variability. J Hypertens 2003;21:477-80. Heiss G. Age, race, and sex differences in autonomic cardiac
func-tion measured by spectral analysis of heart rate variability--the ARIC study. Atherosclerosis Risk in Communities. Am J Cardiol 1995;76:906-12.