© Associated Asia Research Foundation (AARF)
A Monthly Double-Blind Peer Reviewed Refereed Open Access International e-Journal - Included in the International Serial Directories. Page | 162
A STUDY ON ANALYZING THE TREND OF NPA LEVEL IN PRIVATE
SECTOR BANKS AND PUBLIC SECTOR BANKS WITH SPECIAL
REFERENCE TO SBI AND ICICI
Gargi
Research Scholar
Faculty of Commerce
Banaras Hindu University-221005
Address- Room no. 168, Gomti Hostel, Triveni Complex
BHU, Varanasi-221005
ABSTRACT
Banking is an important segment of the tertiary sector and acts as a back bone of economic
progress. Banks are supposed to be more directly and positively related to the performance of
the economy. Lending fund is the main function of any bank. Banks lend funds to various sector
such as agriculture, industry, personal and housing. A loan is an asset for a bank as the interest
payments and the repayment of the principal create a stream of cash flows. It is from the interest
payments that a bank makes profit.NPAs are one of the major areas of concern for the Indian
banking industry. The problem of NPA is not limited to only Indian public sector banks, but it
prevails in the entire banking industry. The objective of this study is to analyze the trend of the
NPA in SBI and ICICI bank in India and to make a comparative study among the selected
banks.This study shows that extent of NPA is comparatively very high in public sectors banks as
compared to private banks. Although various steps have been taken by government to reduce the
NPAs but still a lot needs to be done to curb this problem.
International Research Journal of Management and Commerce
ISSN: (2348-9766) Impact Factor- 5.564, Volume 5, Issue 2, February 2018
Website- www.aarf.asia, Email : [email protected] , [email protected]
© Associated Asia Research Foundation (AARF)
A Monthly Double-Blind Peer Reviewed Refereed Open Access International e-Journal - Included in the International Serial Directories. Page | 163 Keywords: Non-performing Assets, Public Sector Banks, Private Sector Banks, Comparative Study
INTRODUCTION
The banking system is a crucial component of the global economy. Banks are in the business of
accepting deposits for the purpose of lending, and act as financial intermediaries between
depositors with surplus funds and borrowers who are in need of funds (Banks are supposed to be
more directly and positively related to the performance of the economy. The weak banking
sector may have an unfavorable effect on other sectors). Bank lends funds to various sectors such
as agriculture, industry, services, personal, housing etc. A loan is an asset for a bank as the
interest payments and the repayment of the principal create a stream of cash flows. It is from the
interest payments that a bank makes its profits. A banker shall be very cautious in lending
because banker is not lending money out of his own capital. A major portion of the money lent
comes from the deposits received from the public. Private and Public Sector Banks occupy a
major part of banking in India. Public and Private Sector both played important role in the
economic development of Nation. The best indicator for the health of the banking industry in a
country is its level of Non-performing assets (NPAs). It reflects the performance of banks. NPA
has a direct impact on the profitability, liquidity and solvency position of the bank. Higher NPA
indicates inefficiency of the bank and lower NPA indicate better performance and management
of funds. To improve the efficiency and profitability of banks the NPA need to be reduced and
controlled.NPAs reflect the performance of banks. A high level of NPAs suggests high
probability of a large number of credit defaults that affect the profitability and net-worth of
banks and also erodes the value of the asset. It is necessary to trim down NPAs to improve the
financial health of the banking system.A Non-Performing Asset (NPA) is defined as a credit
facility in respect of which the interest and/or installment of principal has remained past due for a
specified period of time. In India, the definition of NPA‟s has changed over time. According to
Narasimham Committee report(1991), those assets for which the interest and/ or installment of
principal remain due for a period of four quarters (180 days) should be considered as NPA. With
© Associated Asia Research Foundation (AARF)
A Monthly Double-Blind Peer Reviewed Refereed Open Access International e-Journal - Included in the International Serial Directories. Page | 164
year ending March, 2004 in theIndian financial system. Thus as per present convention, a non
performing asset refers to a loan or advance when it ceases to generate income for the bank.
Earlier an asset was considered as Non-Performing Asset based on the concept of “past dues”.
Accordingly, a Non-Performing Assets would be a loan or an advance where:
i. interest and/ or instalment of principal remain overdue for a period of more than 90 days
in respect of a term loan,
ii. the bill remains overdue for a period of more than 90 days in the case of bills purchased
and discounted,
iii. the instalment of principal or interest thereon remains overdue for two crop seasons for
short duration crops,
iv. the instalment of principal or interest thereon remains overdue for one crop season for
long duration crops,
v. theamount of liquidity facility remains outstanding for more than 90 days, in respect of a
securitization transaction undertaken in terms of guidelines on securitization dated
February 1, 2006.
vi. in respect of derivative transactions, the overdue receivables representing positive
mark-to-market value of a derivative contract, if these remain unpaid for a period of 90 days
from the specified due date for payment.
In case of interest payments, banks should, classify an account as NPA only if the interest due
and charged during any quarter is not serviced fully within 90 days from the end of the quarter.
Note: An account should be treated as 'out of order' if the outstanding balance remains continuously in excess of the sanctioned limit/drawing power. In cases where the outstanding
balance in the principal operating account is less than the sanctioned limit/drawing power, but
there are no credits continuously for 90 days as on the date of Balance Sheet or credits are not
enough to cover the interest debited during the same period, these accounts should be treated as
© Associated Asia Research Foundation (AARF)
A Monthly Double-Blind Peer Reviewed Refereed Open Access International e-Journal - Included in the International Serial Directories. Page | 165 ASSET CLASSIFICATION
Banks are required to classify Non-Performing Assets further into the following three categories
based on the period for which the asset has remained Non-Performing and the reliability of the
dues:
i. Substandard Assets
ii. Doubtful Assets
iii. Loss Assets
Substandard Assets
With effect from March 31, 2005, a substandard asset would be one, which has remained NPA
for a period less than or equal to 12 months. Such an asset will have well defined credit
weaknesses that jeopardize the liquidation of the debt and are characterized by the distinct
possibility that the banks will sustain some loss, if deficiencies are not corrected.
Doubtful Assets
With effect from March 31, 2005, an asset would be classified as doubtful if it has remained in
the substandard category for a period of 12 months. A loan classified as doubtful has all the
weaknesses inherent in assets that were classified as substandard, with the added characteristic
that the weaknesses make collection or liquidation in full, – on the basis of currently known
facts, conditions and values – highly questionable and improbable.
Loss Assets
A loss asset is one where loss has been identified by the bank or internal or external auditors or
the RBI inspection but the amount has not been written off wholly. In other words, such an asset
is considered uncollectable and of such little value that its continuance as a bankable asset is not
© Associated Asia Research Foundation (AARF)
A Monthly Double-Blind Peer Reviewed Refereed Open Access International e-Journal - Included in the International Serial Directories. Page | 166 TYPES OF NPA
GROSS NPA: Gross NPA is an advance which is considered irrecoverable, for banks has
made provisions, which is still held in bank‟s books of accounts. Gross NPA are the sum
total of all loan assets that are classified as NPAs as per RBI guidelines as on balance
sheet date. Gross NPA reflects the quality of the loan made by banks.
It can be calculated with the help of following ratio:
Gross NPA Ratio= Gross NPAs / Gross Advances
NET NPA: Net NPAs are those type of NPAs in which the bank has deducted the
provisions regarding NPAs. Net NPA shows the actual burden of banks. Since in India,
Banks balance sheets contain a huge amount of NPAs and the process of recovery and
written off of loans is very time consuming, the banks have to make provisions against
the NPAs according to the Central Bank guidelines.
It can be calculated by following:
NET NPA Ratio= Gross NPAs – Provisions / Gross advances – Provisions
Factors contributing to NPA
According to the recent study conducted by RBI, the factors contributing to NPA are
divided into 2 segments
(i) Internal factors
(ii)External factors
(iii) Other factors
Internal factors
a) Diversion of fund for expansion, diversification, modernization or for taking up new projects.
b) Diversion of fund for assisting or promoting associate concerns.
c) Time or cost overrun during the project implementation stage.
d) Business failure due to product failure, failure in marketing etc.
e) Inefficiency in bank management.
f) Slackness in credit management and monitoring.
© Associated Asia Research Foundation (AARF)
A Monthly Double-Blind Peer Reviewed Refereed Open Access International e-Journal - Included in the International Serial Directories. Page | 167 External factors
a) Recession in the economy as a whole
b) Price escalation of inputs.
c) Exchange rate fluctuations
d) Change in government policies
Other factors
a) Liberalization of the economy and the consequent pressures from liberalization like several competitions, reduction of tariffs etc.
b) Poor monitoring of credits and failure to recognize early warning signals shown by standard assets.
c) Sudden crashing of capital market and inability to raise adequate funds.
d) Mismatching of funds i.e. using loan granted for short term for long term transactions.
e) Granting of loans to certain sectors of the economy on the basis of government directives
rather than commercial imperatives.
REVIEW OF LITERATURE
Rajeev, M., Mahesh, H.P., (2010) in their paper titled “Banking Sector Reforms and
NPA: A Study of Indian Commercial Banks” tries to analyze the Indian trends of NPAs from various dimensions and explains how to recognize and reduce the problem of NPA. The paper
also discusses the functions of the joint liability groups or self-help groups in enhancing the loan
recovery rate.
Patnaik, B.C.M., Satpathy, I., Mohapatra, A.K (2011) in their paper title “Demystifying NPAs on education Loan: A survey (with special Reference to selected urban, rural areas and Bank officials of Odisha)” tries to examine the quantitative trend and pattern in growth of NPA with special reference to the education loan scheme, in Odisha. Author explain the causes,
by questionnaire survey of the defaulters, who are students of different colleges, author also gave
suggestions to overcome the problem.
Prasad and Veena (2011) in their study on “NPAs Reduction Strategies for Commercial
© Associated Asia Research Foundation (AARF)
A Monthly Double-Blind Peer Reviewed Refereed Open Access International e-Journal - Included in the International Serial Directories. Page | 168
not generate any income, whereas, the bank is required to make provisions such as assets. The
NPAs have destructive impact on the return on assets in the following ways. The interest income
of banks reduced it is to be accounted only on receipt basis. The current profits of the banks are
eroded because the providing of doubtful debts and writing it off as bad debts and it limits the
recycling funds.
Chatterjee, Mukherjee and Das (2012) in their study on “Management of
non-performing assets- a current scenario” has concluded that early diagnosis of the problems and analysis of the reason for irregularity, with appropriate strategies Bank can prevent slippage as
NPA. Proper identification of the guarantor should be checked by the Bank including scrutiny of
his/her wealth. Framing reasonably well documented loan policy and rules. Sound credit
appraisal on well-settled banking norms with emphasis on reduction in Gross NPAs rather than
Net NPAs Position of overdue accounts is reviewed on a weekly basis to arrest slippage of fresh
account to develop and the behavior of NPAs of the three categories of Banks is observed.
B.Selvarajan and Dr. G. Vadivalagan(2013) stated in their paper “A Study on
management of Non-Performing Assets in priority sector reference to Indian banks and Public Sector banks” that only Public Sector is not facing the problem of NPAs but the problem of NPAs is spread in the entire banking system. Priority sector lending is main cause of bad debts
in Indian Banks. In the paper the priority sector advances has been analyzed in the detail under
three major heads that is Agriculture, Small scale Industry and other priority sector. Further
weaker section advances, which form part of priority sector, have also been studied.
H.S. (2013) in the paper “A study on causes and remedies for Non-Performing assets in
Indian public sector banks with special reference to agricultural development branch, State Bank of Mysore” has analyzed that bankers can avoid sanctioning loans to the non-creditworthy borrowers. There should be careful appraisal of the project which involves checking the
economic viability of the project. A banker must consider the return on investment on a proposed
project. If the calculated return is sufficiently higher than the credit amount he can sanction the
loan. Secondly, he can constantly monitor the borrower in order to ensure that the amount
sanctioned is utilized properly for the purpose to which it has been sanctioned. This involves the
© Associated Asia Research Foundation (AARF)
A Monthly Double-Blind Peer Reviewed Refereed Open Access International e-Journal - Included in the International Serial Directories. Page | 169
Arora and Ostwal (2014) conducted study on “Unearthing the Epidemic of
Non-PerformingAssets: A Study of Public and Private Sector Banks” which tries to explain the concept of Non-Performing assets and examine the classification of loan assets of Public and
Private Sector Banks. It also analyzes the comparison of loan assets of Public sector and Private
Sector Banks. The study concluded that Public Sectors declining due to increase in NPAs ratio
compare to Private Sectors and suggest that there is need to check the NPAs of Public Sector
banks so that Indian banking system becomes efficient.
OBJECTIVES OF THE STUDY:
To evaluate the performance of the State Bank of India and ICICI Bank in India with
reference to the problem of Non-Performing Assets.
To analyze the trend of the NPA in State Bank of India and ICICI Bank in India. To make comparative study of NPA of SBI and ICICI Bank.
RESEARCH METHODOLOGY SAMPLE SIZE:
The number of total scheduled commercial banks in India is 91 in which Public Sector Banks are
27, Private Sector Banks are 20 and Foreign Banks are 44. The study covers one bank from the
Public sector and one bank from the Private Sector and their comparative study.
SOURCES AND COLLECTION OF DATA:
This research study is descriptive in nature .The present study is based on secondary data,
obtained through annual reports of SBI and ICICI Bank, annual bulletins of Reserve Bank of
India, statistical reports related to banking in India, journals, magazines, newspapers and other
published material available.
PERIOD OF STUDY:
The present study has covered a period of five financial years from 2011-2012 to 2015-2016.
TOOLS AND TECHNIQUES
The data has been analyze by using tables, average, standard deviation, coefficient of variance
© Associated Asia Research Foundation (AARF)
A Monthly Double-Blind Peer Reviewed Refereed Open Access International e-Journal - Included in the International Serial Directories. Page | 170
and Profit and show average, standard deviation and coefficient of variance of Gross NPA Ratio
and Net NPA Ratio of SBI and ICICI Bank. By correlation we want to determine where there is
any relationship between Net profit and Net NPA of SBI and ICICI Bank or not.
LIMITATATIONS:
The study is mainly based on secondary data.
The study is restricted to SBI and ICICI Bank only, results of study may not be
applicable to other banks.
STATE BANK OF INDIA
The State Bank of India (SBI) is one of the leading bank in India. The State Bank of India (SBI)
is India's largest commercial bank. The bank has been striving sincerely to adhere to the efforts
of providing utmost customer satisfaction to the best possible extent. The SBI has at present
extended its banking business all over India by establishing 16,000 branches. Not only this, the
bank has made its roots secured internationally as well. At present, SBI has 131 branches in 32
countries all over the world. SBI caters the needs of the customers by providing services round
the clock. Besides, the customers can also avail the facilities of online banking and transactions.
ICICI BANK
ICICI Bank is India‟s largest Private Sector Bank with total assets of Rs.7206.95 billion(US$
109 billion) at March 31, 2016 and profit after tax Rs.97.26 billion for the year ended March
31,2016. ICICI Bank currently has a network of 4501 Branches and 14,271 ATM‟s across India.
ICICI Bank offers a wide range of banking products and financial services to corporate and retail
customers through a variety of delivery channels and through its group companies.
INTERPRETATION AND ANALYSIS
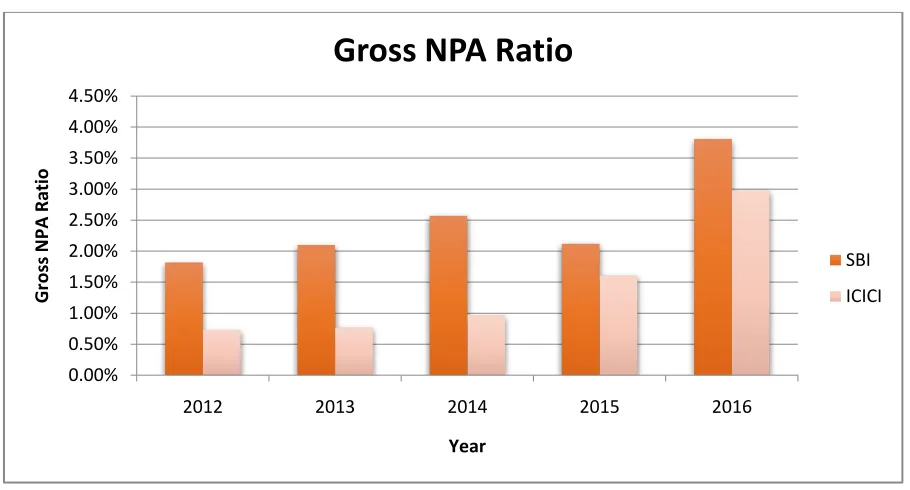
Gross NPA Ratio of State Bank of India and ICICI BANK
The data related to Gross NPA of SBI and ICICI Bank have been collected and interpreted with
the help of the following tables. In addition to this Average and Standard Deviation has been also
© Associated Asia Research Foundation (AARF)
[image:10.612.106.561.350.595.2]A Monthly Double-Blind Peer Reviewed Refereed Open Access International e-Journal - Included in the International Serial Directories. Page | 171 Table 1:
(Rs. in million)
State Bank of India ICICI Bank
Year Gross NPA Gross
Advances
Gross NPA Ratio
Gross NPA Gross Advances
Gross NPA Ratio
2011-2012 371560 7578886 4.90% 92926 1923338 4.83%
2012-2013 511894 10785571 4.75% 96078 2984163 3.22%
2013-2014 616054 12451224 4.95% 105058 3472115 3.03%
2014-2015 567253 13354237 4.25% 150947 3989620 3.78%
2015-2016 981728 15094998 6.50% 262212 4501826 5.82%
Average 609697.8 11852983.2 5.07% 141444 3374212 4.14%
SD 227224.35 2851735.9 0.85% 71433.9 989570 1.17%
(Sources: SBI and ICICI Bank Annual Report)
Graphical Presentation:
INTERPRETATION
It is observed from the table no 1 the Gross NPA ratio has shown an increasing trend in State
Bank of India from 2011-2012 to 2013-2014 except the year 2014-1015 which has shown
0.00% 0.50% 1.00% 1.50% 2.00% 2.50% 3.00% 3.50% 4.00% 4.50%
2012 2013 2014 2015 2016
Gr
o
ss
N
PA
R
atio
Year
Gross NPA Ratio
SBI
© Associated Asia Research Foundation (AARF)
A Monthly Double-Blind Peer Reviewed Refereed Open Access International e-Journal - Included in the International Serial Directories. Page | 172
decreasing trend in Gross NPA ratio. Gross NPA ratio of State Bank of India increased from 4.90
percent in 2011-2012 to 6.50 percent in 2015-2016.
Gross NPA ratio of ICICI Bank shown a decreasing trend except the year 2014-2015 and
2015-2016 which has shown increasing trend in Gross NPA ratio. Gross NPA ratio of ICICI decreased
from 4.83 percent in 2011-1012 to 3.78 percent in 2014-2015.State Bank of India has higher
Gross NPA ratio as compare to ICICI bank.
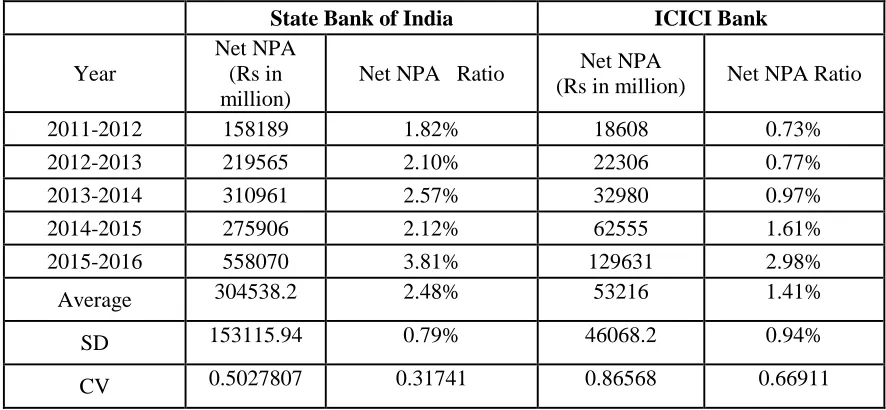
Net NPA Ratio of State Bank of India and ICICI BANK
The data related to Net NPA of SBI and ICICI Bank has been collected and interpreted with the
help of the following tables. In addition to this Average, Standard Deviation, Coefficient of
[image:11.612.84.527.361.566.2]variation have been also calculated
Table 2:
(Rs in Millions)
State Bank of India ICICI Bank
Year
Net NPA (Rs in million)
Net NPA Ratio Net NPA
(Rs in million) Net NPA Ratio
2011-2012 158189 1.82% 18608 0.73%
2012-2013 219565 2.10% 22306 0.77%
2013-2014 310961 2.57% 32980 0.97%
2014-2015 275906 2.12% 62555 1.61%
2015-2016 558070 3.81% 129631 2.98%
Average 304538.2 2.48% 53216 1.41%
SD 153115.94 0.79% 46068.2 0.94%
CV 0.5027807 0.31741 0.86568 0.66911
© Associated Asia Research Foundation (AARF)
A Monthly Double-Blind Peer Reviewed Refereed Open Access International e-Journal - Included in the International Serial Directories. Page | 173 Graphical Presentation:
INTERPRETATION
It is observed from the table no.2 the Net NPA ratio has shown an increasing trend in State Bank
of India from 2011-2012 to 2015-2016 except the year 2014-2015 which has shown decreasing
trend in the Net NPA ratio.Net NPA Ratio of State Bank of India increased from 1.82 to 3.81 in
2015-2016. Net NPA ratio of ICICI BANK shown a decreasing trend from 0.73 percent in
2011-2012 to 2.98 percent 2015-2016.The average of net NPA ratio of SBI is 2.48 percent and ICICI
BANK is 41 percent. The Standard Deviation of net NPA ratio of SBI is 0.79 percent and ICICI
BANK is 0.94 percent. The coefficient of variance of net NPA ratio of SBI is 0.317 and ICICI
BANK is 0.669.
Net Profit and Net NPA of State Bank of India and ICICI BANK
The data related to Net NPA and Net Profit of SBI and ICICI Bank has been calculated. In
addition to this Correlation has been also calculated to establish a relationship between Net NPA
and Net Profit.
0.00% 0.50% 1.00% 1.50% 2.00% 2.50% 3.00% 3.50% 4.00% 4.50%
2012 2013 2014 2015 2016
Ne
t
NPA
R
ati
o
Year
Net NPA Ratio
SBI
© Associated Asia Research Foundation (AARF)
[image:13.612.67.551.94.268.2]A Monthly Double-Blind Peer Reviewed Refereed Open Access International e-Journal - Included in the International Serial Directories. Page | 174 Table 3:
(Rs in millions)
State Bank of India ICICI Bank
Year Net Profit Net NPA Net Profit Net NPA
2011-2012 117073 158189 64653 18608
2012-2013 141050 219565 83255 22306
2013-2014 108912 310961 98105 32980
2014-2015 131016 275906 111754 62555
2015-2016 99506 558070 97263 129631
Correlation(r) -.679 .510
(Sources: SBI and ICICI Bank Annual Report)
RELATIONSHIP BETWEEN NET PROFIT AND NET NPA
As we can see that correlation for SBI is equal to -0.679. It means that there is a negative relation
between Net Profits and NPA of SBI. It simply means that profits increase but NPA not increase.
It is because of the good management on the side of bank. NPA is directly related to Total
Advances given by bank and banks main source of income is interest earned by bank. Since we
have seen earlier that total advances are increasing so interest income is increasing and profits
are also increasing. But as we know there are two types of Customers (good and bad). Good customers‟ leads to increase in profits by paying interest and installments on total advances
timely and Bad customers leads to increase in NPA by not paying interest and installment on
total advances timely. This is because of mismanagement and wrong choice of client. That is the
only reason of positive relation between NPA and Profit. If there is good management by bank
like in case of SBI where correlation between Net Profit and Net NPA is found to be -0.679,
which indicates that amount of NPA decreases and Profits will increase more by the amount not
becoming NPA. So there is negative relation between profits and NPA.
Assets classification of Gross NPA of ICICI Bank
The table shows the assets classification of Gross NPA of ICICI Bank. Assets are divided into
© Associated Asia Research Foundation (AARF)
[image:14.612.67.538.86.161.2]A Monthly Double-Blind Peer Reviewed Refereed Open Access International e-Journal - Included in the International Serial Directories. Page | 175 Table 4
(Rs. in billions) Non-performing Assets 2012 2013 2014 2015 2016
Sub-standard Assets 14.49 18.72 22.42 26.67 40.91
Doubtful Assets 73.35 67.91 62.74 100.63 195.94
Loss Assets 7.79 9.84 20.38 25.52 30.36
Total 95.63 96.47 105.54 152.42 267.21
(Sources: ICICI Bank Annual Report)
Sector wise Gross NPA of ICICI Bank
This Table shows Sector wise Gross NPA of ICICI Bank
Table 5:
.
(Rs in billions)
2012 % 2013 % 2014 % 2015 % 2016 %
Retail Finance 59.73 62.5% 58.14 60.3% 41.17 39.0% 33.78 22.2% 38.25 14.3%
Iron /Steel 0.95 1.0% 1.99 2.1% 2.43 2.3% 9.74 6.4% 65.04 24.3%
Service non-finance 0.39 0.4% 8.77 9.1% 15.18 14.4% 23.53 15.4% 29.30 11.0%
Roads, ports, telecom,
urban development
and other
infrastructure
- - 0.14 0.1% 8.19 7.8% 18.27 12.0% 26.01 9.7%
Construction - - 2.24 2.3% 3.19 3.0% 7.36 4.8% 22.22 8.3%
Shipping 0.45 0.5% 0.38 0.4% 0.67 0.6% 15.00 9.8% 19.60 7.3%
Power 0.09 0.1% 0.09 0.1% 0.07 0.1% - - 17.51 6.6%
Whole Sale / Retail Trade
2.12 2.2% 4.16 4.3% 4.07 3.9% 4.53 3.0% 5.90 2.2%
Food and Beverage 2.64 2.8% 1.94 2.0% 3.68 3.5% 3.94 2.6% 4.55 1.7%
Manufacturing Products
- 1.9% 1.33 1.4% 4.91 4.6% 4.78 3.1% 3.58 1.3%
Electronics and
engineering
2.38 2.5% 2.59 2.7% 2.93 2.8% 8.06 5.3% 3.01 1.1%
Metal and Products 1.11 1.2% 1.06 1.1% 1.05 1.0% 1.72 1.1% 1.10 0.4%
Service and Finance 1.07 1.1% - 0.0% 0.57 0.5% 0.56 0.4% 0.52 0.2%
Crude and Petroleum - - 0.04 0.0% 0.02 0.00% 0.20 0.00% 0.20 0.0%
Mining - - 0.20 0.2% 0.20 0.2% 0.93 0.6% - -
Cement - - - - 0.03 0.3% 0.30 0.2% - -
Paper and paper
products
0.79 0.79% - - - -
Textile 1.84 1.9% - - - -
[image:14.612.42.592.309.680.2]© Associated Asia Research Foundation (AARF)
A Monthly Double-Blind Peer Reviewed Refereed Open Access International e-Journal - Included in the International Serial Directories. Page | 176
Gems and Jewellery 1.75 1.8% - - - -
Chemical and
fertilizers
1.56 1.6% - - - -
Other Industries 18.52 19.4% 13.40 13.9% 16.91 16.0% 19.90 13.1% 30.60 11.60%
Total 95.63 100% 96.47 105.54 100% 152.42 100% 267.21 100%
(Sources: ICICI Bank Annual Report)
At March 31, 2013, the net Non-Performing loans in the retail portfolio were 0.72% of net retail
loans ascompared with 1.22% at March 31, 2012. The decrease in the ratio was primarily on
account of sharp decline in accretion to retail NPAs.At March 31, 2014, Net Non-Performing
loans in the retail portfolio were 0.62% of net retail loans as compared with 0.72% at March 31,
2013. The decline in the ratio was primarily on account of continued low in accretion to retail
NPAs. The gross non-performing assets increased from 152.42 billion at March 31, 2015 to
267.21 billion at March 31, 2016 primarily due to additions in non-performing assets in iron/steel
and products, construction and power sectors
Sector-wise Gross NPA of SBI
This table contains the data related to the sector wise NPA of SBI. Table covers the five years
[image:15.612.70.540.412.631.2]data of sector wise NPA of SBI.
Table 6:
(Rs in crores)
Sector
March‟2016 March‟2015 March‟2014 March‟2013 March‟2012
NPA(Rs in crores) Ratio (%) NPA(Rs in crores) Ratio (%) NPA(Rs in crores) Ratio (%) NPA(Rs in crores) Ratio (%) NPA(Rs in crores) Ratio (%) Large Corporate
20696 6.27
1510 0.54 2402 0.99 1000 0.57 515 0.41 Mid Corporate 41515 17.12 23029 9.76 26257 11.05 18443 8.67 12747 7.21 SME 17032 7.82 16387 7.78 15465 7.85 14528 7.16 11929 6.36 Agriculture 8687 6.93 10652 8.9 10660 9.2 10138 9.39 7778 9 Retail 2458 0.75 2528 0.93 3034 1.28 4269 2.04 4187 2.31 Industry 7785 2.92 2619 1.17 3787 1.77 2811 1.66 2520 1.86
TOTAL 98173 6.50 56725 4.25 61605 4.95 51189 4.75 39676 4.44
© Associated Asia Research Foundation (AARF)
A Monthly Double-Blind Peer Reviewed Refereed Open Access International e-Journal - Included in the International Serial Directories. Page | 177
The category wise priority sector NPAs for the study period is shown in above table. It is clear
with the help of table that NPA of mid corporate, SME and agriculture is the cause of concern
for SBI. Since these loans are granted under pressure from the government, bank could not apply
the loan criteria strictly while sanctioning loans and it could not force recovery very
aggressively, thanks to government intervention. Moreover, uncertain monsoon and other natural
calamities have their impact on the agriculture. As a result, the recovery of loans from this sector
becomes a casualty
RESEARCH FINDINGS
Gross NPA ratio of State Bank of India is increasing from 2011-2012 to 2013-
2014except,the year 2014- 2015 again it rises in 2015-2016.
Gross NPA ratio of ICICI Bank is decreasing from 2011-2012 to 2013- 2014except, in
the year 2014-2015 and 2015-2016.
Net NPA ratio of both Banks are continuously increasing.
Gross advances of both banks are increasing continuously since 2011-2012.
Net profit of SBI is increasing from 2010-2011 till 2012-2013 but slipped down in the
year 2013-2014.
Net profit of ICICI Bank is increasing continuously since 2010-2011.
CONCLUSION
Finally it can conclude that the banks can avoid sanctioning loans to the non-creditworthy
borrowers by adopting certain measures. Banker can constantly monitor the borrower in order to
ensure that the amount sanctioned is utilized properly for the purpose to which it has been
sanctioned. NPA or Non-Performing Assets are the types of assets which are the subject of major
concerns to the banking sector and the other non-banking financial institutions. NPAs reflect the
overall performance of the banks. The NPAs have always been a big worry for the banks in
India. The Indian banking sector faced a serious problem of NPAs. A high level of NPAs
suggests high probability of a large number of credit defaults that affect the profitability and
liquidity of banks. The money locked up in NPAs has a direct impact on profitability of the bank
as Indian banks are highly dependent on income from interest on funds lend. The objective of
© Associated Asia Research Foundation (AARF)
A Monthly Double-Blind Peer Reviewed Refereed Open Access International e-Journal - Included in the International Serial Directories. Page | 178
comparative study among the selected banks.This study shows that extent of NPA is
comparatively very high in public sectors banks as compared to private banks. Although various
steps have been taken by government to reduce the NPAs but still a lot needs to be done to curb
this problem.
References:
1) Prasad, G.V.B. &Veena, D. (2011), „NPAs Reduction Strategies for Commercial Banks in India‟, IJMBS Vol. 1, Issue 3
2) Chatterjee, C. and Mukherjee, J. and Das, R. (2012), „Management of Non-Performing
Assets - a current scenario‟, International Journal of Social Science & Interdisciplinary
Research, Vol.1 Issue 11
3) Selvarajan, B. &Vadivalagan, G. (2013), „A Study on Management of Non-Performing
Assets in Priority Sector reference to Indian Bank and Public Sector Banks (PSBs)‟,
Global Journal Of Management and Business Research, Vol. 13, Issue 1
4) H. S., S. (2013), „ A study on causes and remedies for non-performing assets in Indian
public sector banks with special reference to agricultural development branch, state bank of Mysore‟, International Journal of Business and Management Invention , Volume 2
Issue 1, PP.26-38
5) Arora, N, Ostwal,N (2014),Unearthing The Epidemic Of Non-Performing Assets: A Study Of Public And Private Sector Banks. Retrieved from SMS Varanasi, Vol. X, No. 1;
June 2014
6) Meenakshi, R., and Mahesh, H. P. (2010). Banking Sector Reforms and NPA: A study of Indian Commercial Banks. Institute for Social and Economic Change, 1-15 retrieved on
February 3rd 2015
7) Patnaik, B.C.M, Satpathy, I, Mohapatra, A.K (2011) Demystifying NPAs on Education Loan: A Survey (With Special Reference to Selected Urban, Rural Areas And Bank
Officials Of Odisha). Retrieved from JBFSIR Volume 1, Issue 4 (July, 2011) ISSN
2231-4288
8) www.sbi.co.in
© Associated Asia Research Foundation (AARF)
A Monthly Double-Blind Peer Reviewed Refereed Open Access International e-Journal - Included in the International Serial Directories. Page | 179 10) www.rbi.org.in
11) www.moneycontrol.com
12) Annual Report of SBI