Java Earthquake Program (JEP) to Predict the
Recurrence Time of Significant Earthquake in Indonesia
Ario Muhammad
Department of Civil Engineering Narotama University Surabaya – Indonesia
Ratih Nur Esti Anggraini
Departement of Informatics Institut Teknologi Sepuluh November
Surabaya - Indonesia
ABSTRACT
This paper developed the Java Earthquake Program (JEP) to predict the recurrence time of significant earthquake in Indonesia. The 59 events of significant earthquake in Indonesia were taken from the National Geophysical Data Center (NGDC) of United States. Five probabilistic models were used to represent the significant earthquake data in Indonesia. The models were tested by two goodness fit tests, Kolmogorov-Smirnov (K-S) and Chi-Square test. The goodness of fit tests showed that gamma distribution is an appropriate model to represent the significant earthquake data in Indonesia. The JEP result shows that the next earthquake will be occurred on 64 days after the last hit earthquake. With the 7 days of error, it was confirmed that the range period of the next significant earthquake in Indonesia was on January 26 to February 9, 2013. This work successfully proved the reliability of the use of JEP to predict the Indonesia significant earthquake.
Keywords
Java earthquake program (JEP), gamma distribution, K-S test, Chi-Square test.
1. INTRODUCTION
Except of flooding, earthquake is also widely noted as one of the biggest natural disasters causing in the greatest loss of life, economic and social. One of the regions hit regularly by the earthquake is Indonesia. This region is located among Indo-Australian, Pacific, and Eurasian plates making this region is widely known as one of the most seismically active zone. Not only locates in seismically active zone, Indonesia area is also in the region of active and potentially active volcanoes which are Circum pacific belt and Trans Asiatic belt. It leads on the high intensity of earthquake hit in this region. In addition, the insufficient design and construction, inappropriate planning of the infrastructure in Indonesia added with the highest density of Indonesian population in the seismic zone area have increased the damage due to natural disasters, especially earthquakes.
Many historical and recent earthquakes in Indonesia have resulted in social and economic losses. During the period of 1996 to 2000, 4 significant earthquakes hit Indonesia. It caused in the death of more than 130 people, at least 1400 were seriously injured, and losses of at least $30 millions [1-4]. In the last 10 years, Indonesia was hit by some significant earthquakes and caused on the great economic loss reaching to $2 miliion and more than 200.000 people killed. One of the biggest earthquake on this period occurred in Sumatra and Andaman Island caused on the death of 280.000 people and
loss of $1.6 million becoming the sixth deadliest natural disaster in history recorded [5-16].
Many researches have developed the method on predicting the recurrence time of earthquake due to its devastating effects on both social and economic aspects. Recently, large number of researchers has addressed on predicting the recurrence time of earthquake, especially on the significant earthquake events. One of the prediction methods conducted by the scientific community to predict the recurrence time of earthquake is probabilistic analysis. It has proved to be an appropriate method to predict the recurrence time of earthquake in several seismically active zones such as in Mexico, Turkey, Teheran, Italy, Taiwan and Los Angeles [17-21].
The prediction of earthquake recurrence time using probabilistic analysis needs to solve some mathematical computations. The employing of probability models to represent the data distribution of earthquake is performed by solving the equation of each model. It can be conducted by several commercial programs such as MATLAB, Ms. Excel, SPSS, etc. However, those commercial programs are not free and have less flexibility on advancing the probabilistic analysis. In this paper, the free Java programming language was used to build the preliminary program conducted the earthquake prediction time using probabilistic analysis. This program was then named as Java Earthquake Program (JEP). Five theoretical probabilistic distributions are used in JEP to model the significant earthquake data in Indonesia. Those five models are tested by goodness-of-fit test in order to find the appropriate model represented the earthquake data. Conditional probability of the chosen model is then employed to estimate the prediction time of the next earthquake.
2. METHODOLOGY
The National Geophysical Data Center (NGDC) of United States recorded destructive earthquake all over the world. These earthquake data would be then defined by NGDC as significant earthquake once it reaches one of the following criteria: Causes the loss of at least $1 million, the number of people killed is 10 or more, the minimum magnitude of the earthquake is 7.5, or it generates the tsunami. In this research, the last 10 years events of significant earthquakes in Indonesia from 2002 to 2012 were used to predict the recurrence time of the next significant earthquake. The NGDC recorded 59 events of significant earthquake hit Indonesia in the last 10 years with the range of magnitude (Mw) from 6.2 to 9.0.
forecasted. The forecasting process was done by calculating the maximum value of conditional probability.
2.1. Overviews of probabilistic analysis and
goodness fit test
[image:2.595.49.299.225.387.2]Theoretical probability models were used to model the data of Indonesia significant earthquake. The probability model chosen used in this work was not based on the background knowledge of their suitability on modeling the data. The five used probability models were normal, lognormal, gamma, beta, and pareto. Their properties are shown in Table 1.
Table 1 Employed statistical cummulative distribution function and their properties
Type Cumulative Distribution Function (CDF)
Mean Variance
Normal
Lognormal
Gamma
Beta
Pareto
The Kolmogorov–Smirnov (K–S) and Chi-Square tests are the two of the widely used goodness-of-fit tests in statistics [22]. The Kolmogorov-Smirnov (K-S) test is based on the empirical distribution function (ECDF). Once we have the data with n
ordered data points x1, x2, ...xn then the ECDF is expressed as
the following:
(1)
where is the indicator function, equal to 1 if Xi ≤ x and
equal to 0 otherwise [23]. The probability model will be acceptable if the maximum difference of cumulative distribution function (CDF) of theoretical probability model , and ECDF is less than the critical value ). This critical value is associated with the size of observed data and level of significance described by the following equation:
(2)
The level of significance used to find the critical value for K-S test is 0.1. The critical value at the level of significance of 0.1 used in this research is 0.1938. On the other hand, the framework of Chi-Square test compares the frequencies of theoretical probability model and the observed data . The summation of the difference (S), between the observed and probability model is defined as the chi square. The probability model will be acceptable if the summation value is less than chi square distribution value ( as presented in Eq.3. This chi-square distribution value is determined based on the observed data size and level of significance. The level of significance of 0.1 is also employed in this work as same as used for K-S test and it is confirmed that the chi square distribution value ( ) is 39.087.
(3)
2.2. Earthquake Prediction
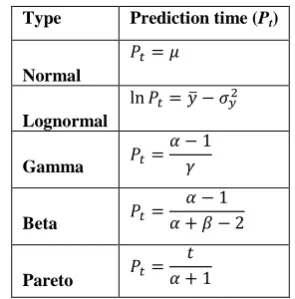
Once the suitability of those five models was examined, the chosen probability model was then used to predict the recurrence time of the significant earthquake. The data used in this paper was assumed to be dependent with the time of the previous significant earthquake. Furthermore the conditional probability function can be employed to determine the next significant earthquake time. Based on the previous investigations conducted by Utsu [24], Hagiwara [25], Ferraes [17], Jafari [26], Tripathi [27], and Orfanogiannaki and Papadopoulos [28] the mode of conditional probability can be used to predict the recurrence time of the earthquake. The maximum value of conditional probability in this paper is defined as the prediction time of the next earthquake. The prediction time equation of each model is presented in Table 2.
Table 2 Prediction time of each probability model Type Prediction time (Pt)
Normal
Lognormal
Gamma
Beta
Pareto
The square error calculation proposed by Benjamin and Cornell [30] is used to evaluate the result of recurrence time prediction. Let the variance of the recurrence time from the earthquake catalog is defined as and the mean of the recurrence time of the earthquake is expressed as , then the square error can be defined as:
(4)
3. PROGRAM DESCRIPTION
3.1 Flowchart of the built program
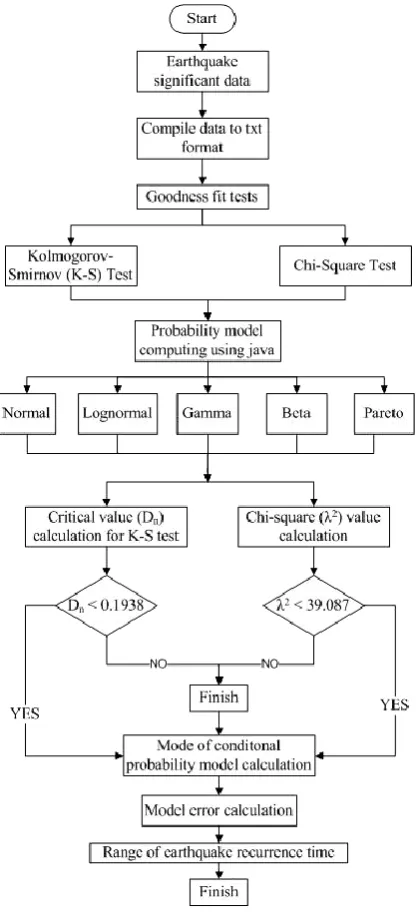
The significant earthquake data taken from NGDC was compiled to the txt file before it would be used on the Java programming language. The goodness fit tests were firstly evaluated in order to determine the parameters of probabilistic models that are needed to predict the recurrence time of earthquake. The K-S test was performed by estimating the CDF value whereas the frequency resulted from each probability model was used to conduct the Chi-Square test. The CDF calculation of each probability model was conducted by writing the program from their equations as shown in Table 1. The CDF value was firstly determined in order to get the frequency of each probability model. After calculating the CDF and frequency of each probability model, the K-S and Chi-Square test would be conducted (Fig. 1). These goodness fit tests were employed in Java programming language by programming each parameter of the tests based on Eq. (2) and (3).
[image:2.595.353.501.290.440.2]of conditional probability was then used to predict the earthquake recurrence time. The calculation of maximum conditional probability in Java programming language was performed by writing their equation as presented in Table 2. The error square function was needed to assess the result of earthquake prediction time. The error function programming in this JEP was improved using Eq. (4). Finally, this error value was then used to define the range of significant earthquake prediction time.
Figure 1 Procedure of earthquake recurrence time prediction
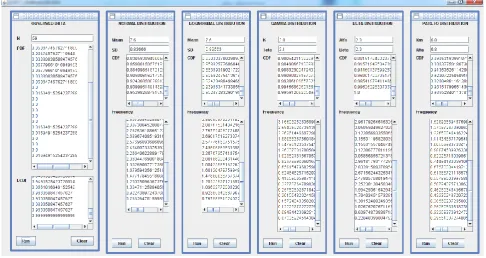
[image:3.595.306.553.287.640.2]3.2 Input, running program, and output
Fig. 2 shows the screen view of JEP. The figure performs the calculation of PDF and ECDF of observed data and the determination of CDF and frequency for each probabilitymodel. The parameter of input and output of each probability computing is presented in Table 3.
Total number of the significant earthquake data (N) is the only input on calculating the CDF and density (PDF) of the observed data. The observed data frequency of each magnitude has calculated from the original data before it would be used to conduct the goodness-fit-tests. Normal and lognormal model need N, mean and standard deviation (SD) to calculate the CDF and frequency. Gamma distribution use ka and teta as the input parameter to determine the CDF and its frequency while beta model inputs alfa and beta as the parameters to perform the probabilistic analysis. In addition, the last model used in this work, pareto distribution, need Xm
and alfa to calculate the cumulative and frequency. The expected outputs of each probability models are cumulative value (CDF) and frequency. As mentioned previously, these two values were needed to process the goodness fit-tests, K-S and Chi-Square test.
Table 3 The output and input parameters of each model
Probability
Model Input
Observed data Number of data (N) Mean Standard Deviation (SD)
Normal Number of data (N) Mean Standard Deviation (SD)
Lognormal Number of data (N) Mean Standard Deviation (SD)
Gamma Number of data (N) k teta
Beta Number of data (N) alfa beta
Pareto Number of data (N) Xm alfa
Probability Model
Output
PDF CDF Frequency
Observed data Yes Yes No
Normal Yes Yes Yes
Lognormal Yes Yes Yes
Gamma Yes Yes Yes
Beta Yes Yes Yes
Pareto Yes Yes Yes
The running program process to calculate each parameter of the models is just simply conducted by click the “Run” button. “Clear” button is used once we need to change the input parameters.
4
RESULT AND DISCUSSION
The significant earthquake is ocurred in all of the areas of Indonesia except in Borneo island. The earthquake occurrence distribution is located from east to the west of Indonesia which are in Sumatra, Java, NTT, NTB, Celebes, Moluccas, and Papua. The data showed that about 62% of the significant earthquake was occurred in Sumatra area, 15% was hit in
[image:3.595.304.554.290.640.2]β on performing beta distribution. On the other hand, the α and Xm value to calculate the CDF of pareto distribution are
6.8 and 6.0 respectively. Additionally, the 29 points were used
[image:4.595.54.541.121.379.2]as the amount of the data to simulate these five probability models since the width interval is chosen as 0.1.
Figure 2 Screen view of Java-based program to perform the probabilistic analysis
4.1 Result of goodness fit test
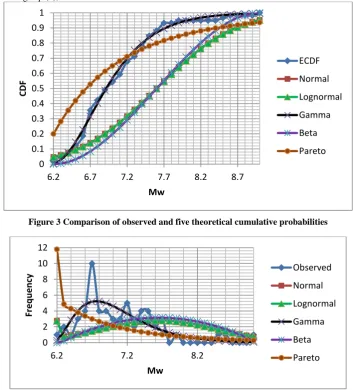
The comparison value of cumulative probability models and empirical data using to simulate the K-S test is presented in Fig. 3. The maximum critical value (Dn(max)) of each model
and its comparison to the limit of critical value at the level of siginificance of 0.1 is shown in Table 4. The table precisely shows that the suitable probability model to represent the distribution of significant earthquake data in Indonesia is gamma distribution model. The maximum critical value (Dn(max)) of gamma distribution is 0.044 which is less than
0.1938 as the critical value ( ) at the level of significance 0.1. Contrary with the maximum critical value (Dn(max)) of
gamma distribution, the maximum critical value (Dn(max)) of
lognormal, normal, beta, and pareto distribution are 0.3954, 0.395, 0.40, and 0.30 respectively. These values are greater than the critical value ( ) at the level of significance 0.1. It exacly indicates that those four models are inapropriate to simulate the significant earthquake in Indonesia.
The comparison of observed and theoretical probability model frequencies which will be representing the chi square goodness fit test is presented in Fig. 4 while the value of chi square distribution of each model is described in Table 4. The chi-square goodness fit test shows that gamma and pareto distribution are suitable to represent the significant earthquake data distribution in Indonesia. The chi square distribution values ( 2) of gamma and pareto distribution are 11.705 and 16.338 respectively (Table 3). It is less than the chi square distribution value ( 2) at the level of significance of 0.1. The
chi square distribution values of other 3 models are 49.172, 49.243, and 40.39 represented the model of normal, lognormal, and beta respectively. Noted that for beta distribution model, the chi square distribution value ( 2) calculation does not include the zero value hence the value above only uses for non zero frequency. Pareto distribution is
only suitable on chi-square test but based on the result of K-S test, this probability model is not suitable to represent the data. Furthermore based on those two goodness fit tests results, it is exactly confirmed that the gamma distribution is the appropriate model to represent the significant earthquake data distribution in Indonesia.
4.2 Result of earthquake prediction time
Since the result of two goodness tests shows that gamma distribution model is an appropriate model to represent the significant earthquake data in Indonesia, this model is then be used to predict the earthquake recurrence time. The data must be regroup from the first earthquake occurrence on October 10, 2002 to the last earthquake event on December 10, 2012. The recurrence time is then calculated between two earthquake events started from the first to the last event as shown in Table 5. The mean ( ) of the earthquake data is 64 days while standard deviation ( ) is 3.75 resulting on the variance ( ) of 14.08. Table 2 expressed the prediction time (Pt) of gamma distribution which is determined by the
following equation:
(5)
Eq. (5) precisely indicates that the value of α and γ must be firstly calculated before the earthquake prediction time is estimated. It can be determined using the equation of mean ( ) and variance ( ) of gamma distribution taken from Table 1. Using the equation of both mean and variance of gamma distribution, the α and γ are then calculated which are 290.705 and 4.54 respectively. Those two values are then employed to Eq. (5) in order to calculate the earthquake prediction time. It is found that the prediction time (Pt) is 64 days. It means that
earthquake, December 10, 2012, another significant earthquake will be hit Indonesia region.
To control the earthquake prediction time resulted from mode of 10onditional probability of gamma distribution, the square error is calculated. Using Eq. (4), it is found that the error of
time prediction is 7 days. With the error of 7 days, the range period of significant earthquake recurrence time in Indonesia is on January 26 to February 9, 2013.
[image:5.595.119.473.128.519.2]
Figure 3 Comparison of observed and five theoretical cumulative probabilities
[image:5.595.72.525.564.686.2]Figure 4 Comparison of observed and five theoretical frequencies
Table 4 Summary of two goodness fit tests
Probability Model At magnitude Dn(max) The suitability Probability Model At magnitude The suitability
Normal 7.5 0.395 No Normal 7.5 49.172 No
Lognormal 7.5 0.395 No Lognormal 7.5 49.243 No
Gamma 7.1 0.044 Yes Gamma 7.1 11.705 Yes
Beta 7.5 0.400 No Beta 7.5 40.390 No
Pareto 6.5 0.300 No Pareto 6.5 16.34 Yes
5
CONCLUSIONS
The Java earthquake program (JEP) was developed to predict the significant earthquake in Indonesia. The Indonesia significant earthquake data taken from USGS is used to build this program. The goodness fit tests result from JEP
confirmed that gamma distribution is reliable to model the significant earthquake data in Indonesia. The calculation result of maximum conditional probability from JEP indicated that the next significant earthquake will be occurred on 64 days after the last hit earthquake. With the error of 7 days, the range period of significant earthquake recurrence time in 0
0.1 0.2 0.3 0.4 0.5 0.6 0.7 0.8 0.9 1
6.2 6.7 7.2 7.7 8.2 8.7
CDF
Mw
ECDF
Normal
Lognormal
Gamma
Beta
Pareto
0 2 4 6 8 10 12
6.2 7.2 8.2
Fr
e
q
u
e
n
cy
Mw
Observed
Normal
Lognormal
Gamma
Beta
Indonesia is on January 26 to February 9, 2013. This result exactly confirmed that JEP is successfully applied to predict
[image:6.595.52.549.130.729.2]the significant earthquake in Indonesia.
Table 5 Significant earthquake data in Indonesia occurred from 2002-2012
Date Mw Occurrence
date (Years)
Recurrence time (Days)
Date Mw Occurrence
date (Years)
Recurrence time (Days)
October 10, 2002 7.6 2002.78 September 12, 2007 8.5 2007.70 34
November 2, 2002 7.4 2002.84 22 September 12, 2007 7.9 2007.70 0
May 26, 2003 7 2003.40 207 September 20, 2007 6.8 2007.72 8
January 28, 2004 6.7 2004.08 245 October 24, 2007 6.7 2007.82 34
February 5, 2004 7 2004.10 7 November 25, 2007 6.5 2007.90 31
February 7, 2004 7.3 2004.10 2 February 20, 2008 7.4 2008.14 86
July 25, 2004 7.3 2004.57 170 February 25, 2008 7.2 2008.15 5
November 11, 2004 7.5 2004.86 108 November 16, 2008 7.4 2008.88 265
November 26, 2004 7.1 2004.90 15 January 3, 2009 7.7 2009.01 48
December 26, 2004 9 2004.99 30 January 3, 2009 7.4 2009.01 0
January 1, 2005 6.7 2005.00 5 February 11, 2009 7.2 2009.11 38
February 19, 2005 6.5 2005.14 48 August 16, 2009 6.7 2009.63 188
February 26, 2005 6.8 2005.15 7 August 28, 2009 6.9 2009.66 12
March 2, 2005 7.1 2005.17 6 September 2, 2009 7 2009.67 4
March 28, 2005 8.6 2005.24 26 September 30, 2009 7.5 2009.75 28
April 10, 2005 6.7 2005.28 12 October 1, 2009 6.6 2009.75 1
May 14, 2005 6.7 2005.37 34 October 24, 2009 6.9 2009.82 23
May 19, 2005 6.9 2005.39 5 November 8, 2009 6.6 2009.86 14
July 5, 2005 6.7 2005.51 47 May 9, 2010 7.2 2010.36 184
November 19, 2005 6.5 2005.89 136 September 29, 2010 6.2 2010.75 142
January 27, 2006 7.6 2006.07 69 September 29, 2010 7.2 2010.75 0
March 14, 2006 6.7 2006.21 48 2010/20/25 7.7 2010.82 26
May 16, 2006 6.8 2006.38 63 April 3, 2011 6.7 2011.26 161
July 17, 2006 6.3 2006.40 10 August 30, 2011 6.8 2011.67 149
July 17, 2006 7.7 2006.55 52 September 5, 2011 6.6 2011.68 5
January 21, 2007 7.5 2007.06 187 January 10, 2012 7.2 2012.03 127
March 6, 2007 6.4 2007.18 46 August 18, 2012 6.3 2012.63 221
July 26, 2007 6.9 2007.57 142 August 26, 2012 6.6 2012.65 8
August 8, 2007 7.5 2007.61 12
October 12, 2012 6.7 2012.78 47
6
REFERENCES
[1] Todd, D. 1996. The January 1, 1996 Indonesia Earthquake. EERI Newsletter, February 1996, Volume 30, Number 2, pp 5.
[2] Todd, D. 1996. The January 1, 1996 Indonesia Earthquake. EERI Newsletter, February 1996, Volume 30, Number 2, pp 5.
[3] Subandono Diposaptono, Rahman Hidayat, Nanang Tyas Puspito, Hamzah Latief, Fusuni, Fumihiko Imamura, and Andy Moore. 1996. The February 17, 1996 Irian Jaya earthquake and tsunami. EERI Special Report, May 1996, pp 11.
[4] Gregorius Sandjaja and Teddy Boen. 2000. M 6.5 earthquake strikes Indonesia. EERI Newsletter, June 2000, Volume 34, Number 6, pp 5.
[5] Todd, D. 2000. Devastating earthquake strikes Sumatera.
EERI Newsletter, July 2000, Volume 34, Number 7, pp 5. [6] Azian Adnan, Hendriyawan, and Masyhur Irsyam. 2003. Effect of 11-2-02 Northern Sumatra Earthquake in Indonesia and Malaysia. EERI Newsletter, February 2003, Volume 27, Number 2, pp 4.
[7] Boen, T. 2004. Sumatra earthquake 26 December 2004.
United State Geological Survey (USGS).
[8] Boen, T. 2005. The northern Sumatra earthquake of March 28, 2005. EERI Special Earthquake Report, August 2005, pp. 2-8.
[9] Bigman Hutapea, Sindhu Rudianto, F.X. Toha, and Hartono. 2006. The Mw 6.3 Java, Indonesia, Earthquakeof 27, 2006. EERI Special Earthquake Report, August 2006, pp 1-8.
[10]Danny Hilman Natawidjaja, Adrin Tohari, Eko Subowo, and Mudrik R. Daryono. 2007. Western Sumatra earthquake of March 6, 27. EERI Special Earthquake Report, May 2007, pp 1-8.
[11]Briggs, R. 2007. 2007, Sumatra, Indonesia Earthquakes.
EERI Newsletter, October 2007, Volume 41, Number 10, pp 2.
[12]Boen, T. 2008. Sumbawa, Indonesia, Earthquake of November 25, 2007. EERI Newsletter, January 2008, Volume 42, Number 1, pp 8.
[13]Yashinsky, M. 2009. February 11 M7.2 EQ in Indonesia.
EERI Newsletter, April 2009, Volume 43, Number 4, pp 9.
[14]Teddy Boen, Sugeng Wijanto, Takim Andirono, and Danny Hilman. 2009. Tme M7.3 September 2, 2009, West Java quake. EERI Newsletter, October 2009, Vol. 43, Number 10, pp 4.
[15]Cedillos, V. 2010. Indonesian earthquake and tsunami.
EERI newsletter, December 2010, Vo. 44, Number 12, pp 4.
[16]Dengler, L. 2012. April 11, 2012, M8+ Sumatra earthquakes. EERI Newsletter, May 2012, Vol. 46, Number 5, pp 10.
[17]Ferraes SG. 2005. A probabilistic prediction of the next strong earthquake in the Acapulco-San Marcos segment, Mexico. Geofisica Internacional 44: 347-353.
[18]Yilmaz V, Erisoglu M, Celik HE. 2004. Probabilistic prediction of the next earthquake in the NAFZ (North Anatolian Fault Zone), Turkey. Dogus Universitesi Dergisi 5: 243-250.
[19]Jafari MA. 2010. Statistical prediction of the next great earthquake around Tehran, Iran. Journal of Geodynamics 49: 14-18.
[20]Laura S, Lawrence H. 2009. A test of physical-based strong ground motion prediction methodology with the 26 September 1997, Mw = 6.0 Colfiorita (Umbria-Marche
sequence), Italy earthquake. Tectonophysics 476: 145-158.
[21]Wang JP, Wu YM, Lin TL, Brant L. 2012. The uncertainties of a Pd3-PGV onsite earthquake early warning system. Soil Dynamic and Earthquake Engineering 36: 32-37
[22]Ang A, Tang W. 2003. Probability concept in engineering: emphasis on applications to civil and environmental engineering, 2nd edn. John Wiley & Sons, Inc., New Jersey, pp 293–294.
[23]Chakravarti, Laha, and Roy. 1967. Handbook of Methods of Applied Statistics, Volume 1, Johnl Wiley and Sons, pp. 392-394.
[24]Utsu T. 1972. Large earthquakes near Hokkaido and the expectancy of the occurrence of a large earthquake of Nemuro: Report of the Coordinating Committee for Earthquake Prediction 7: 7-13.
[25]Hagiwara Y .1974. Probability of earthquake occurrence as obtained from a Weibull distribution analysis of crustal strain. Tectonophysics 23: 323-318.
[26]Jafari MA .2010. Statistical prediction of the next great earthquake around Tehran, Iran. Journal of Geodynamics 49: 14-18.
[27]Tripathi J.N .2006. Probabilistic assessment of earthquake recurrence in the January 26, 2001 earthquake region of Gujarat. Indian Journal of Seismology 10: 119–130.
[28]Orfanogiannaki K, Papadopoulos G.A. 2007. Conditional probability approach of the assessment of Tsunami potential: application in three Tsunamigenic regions of the Pacific Ocean. Pure Appl. Geophys 164: 593–603. [29]Benjamin J. R, CORNELL CA. 1970. Probability,