Evaluation of Object Oriented Programming Skills of
Students with respect to Trait Emotional Intelligence
based on Students Performance
V. Maria Antoniate Martin
Assistant Professor
St. Joseph’s College
(Autonomous)
Tiruchirappalli - 2
ABSTRACT
Data Mining is the exploration and analysis of large quantities of data in order to discover meaningful, trends, relationships and rules. The objective of this study is to evaluate the students‟ object oriented programming skills and the trait emotional intelligence („TEI‟) based on the performance of the individual, this study also engages how skilled a student is in programming in accordance to the factors like academics, locality and gender. The student‟s character was divided into five trait emotional intelligence variables using the Trait Emotional Intelligence Questionnaire (TEIQue). These variables are wellbeing, self-control, emotionality, sociability and global trait EI. Likert scale was used to measure the TEI factors. Two Data mining techniques were applied in the resultant data set, (i) Association Rule Mining and (ii) Multilayer Perceptron. In this experiment the programming skills of the students were very strong of those who scored high in self-control, sociability and wellbeing and male students from rural areas, whereas female students who had scored high in sociability achieved first class in the same. This analysis can be used to improve the students‟ programming skills. They know about their levels and what could be done to improve themselves.
Keywords:
Association Rule Mining, Multilayer Perceptron, TEI, Programming skills.1.
INTRODUCTION
Data mining is extraction meaningful patterns from large amount of data. The first part of the questionnaire was about the students‟ demographic details. The second part was object oriented programming skills test conducted. Students programming skills marks are classified into A,B,C,D and F. F denotes failure, below 40 % marks are this category, C denotes Third class, the marks are 40% to 49%. B denotes second class; the marks are 50% to 59%. A denotes first class, the marks are 60% to 74%. D denotes distinction, the above 75% marks. The third part was the trait EI as measured by the Trait Emotional Intelligence Questionnaire (TEIQue) comprised of fifteen distinct facets. It has demonstrated that thirteen of these facets form four interrelated factors: Emotionality facets which are emotion-perception, empathy, emotion expression and relationships. Self-control facets are emotion control, impulsivity, and stress management. Sociability facets are emotion management, assertiveness, and social awareness. Well-being facets are happiness, optimism, and esteem. Two further facets are adaptability and self-motivation feed directly into the global trait EI score [18] [19]. The two data mining techniques Association Rule
Mining and Multilayer Perceptron were applied in the three resultant data sets. The Alpha Miner and Weka Tools are used for finding the result. Association rule is used to identify the frequent patterns in the resultant data set. Multilayer perception technique provides the classification of confusion matrix result by applying cross-validation [6] [7]. Multilayer perceptron illustrate the TP Rate, FP Rate and ROC values and the correctly classified instances and the incorrectly classified instances of the given resultant data set.
This paper is organized as follows. In Section 2 literature review related with data mining techniques, Object oriented programming skills and TEI factors are discussed. Section 3 focuses on the proposed methodology. It describes about the data mining techniques, Object Oriented Programming Skills test and TEI concepts. Section 4 is about the results of this experiment are examined. Section 5 provides the conclusion of this experiment. Section 6 describes about the acknowledgements. Section 7 explains about references used in this experiment. Section 8 describes about the author details.
2.
LITERATURE REVIEW
Data mining refers to extracting or “mining” knowledge from large amounts of data. Another popularly used term, Knowledge Discovery from Data (KDD) [1]. The overall process of KDD consists of preprocessing, data mining and post processing [9]. In Data Mining, Association rule mining is a technique for finding the frequent patterns in the resultant dataset. To find the useful knowledge, the data should be cleaned [2]. Most of the association rules have redundant information, so it cannot be used directly in an application. To avoid this situation two types of ARM techniques are used pruning and grouping [3]. To find an interesting measure the following rules are applied, Minimum Transactional Support and Minimum Confidence [4].
C. Deepa et. al. [11] [12] this paper‟s aim was to discover the accuracy for the compressive strength of high performance concrete by using data mining classification algorithms like Multilayer Perceptron, Rnd tree models, C-RT regression, M5P Tree models and Linear Regression are applied on the task.
Norazlina Khamis and Sufian Idris [5] this paper examines the important of object oriented programming and decides how to assess each student‟s programming skill as one of the biggest challenges for educators who teach programming courses. Finally, in this paper recommends better assessment approach to better understanding and facilitate the understanding the OO programming.
Mary Jo Jackson and Sharon Larisa Segrest, Andrew Cooper and K. V. Petrides [8] [16] this paper examines, the relationship between emotional intelligence and academic performance, as measured by the Trait Emotional Intelligence Questionnaire Short Form (TEIQue SF) Emotional intelligence was found to be positively associated with work experience. It has been admired as a successful predictor of job performance and leadership ability. Second paper showed good psychometric properties at the item and global level. This experiment suggestions and proposals for building emotional intelligence in pupils.
In this paper examines the main task of trait emotional intelligence in academic performance and in deviant behavior at school. The relationship between cognitive ability and academic performance. Those who students‟ high trait EI scores were less absences in the school [13] [15].
Maria jose snchez-ruiz, Juan carlos perez-gonzalez, & k. V. Petrides [17] in this paper, to discovered the students from different university faculties like technical studies, natural sciences, social sciences, arts, and humanities. Using the Trait Emotional Intelligence Questionnaire, social sciences would score higher than technical studies in Emotionality, arts would score higher than technical studies in Emotionality, arts would score lower than technical studies in Self-control, and female students would score higher than male students within the social sciences only.
Stella Mavroveli, K. V. Petrides, Carolien Rieffe, Femke Bakker [14] this paper to find the Trait EI was positively associated with adaptive coping styles and negatively associated with depressive thoughts. High trait EI scores received more nominations from their classmates for being co-operative and girls gave significantly more nominations to classmates with high trait EI scores for having leadership qualities.
3.
METHODOLOGY
3.1
Data Mining Techniques
The two data mining techniques are used in this experiment (i) Association Rule Mining (ARM) (ii) Multilayer Perceptron (MLP).
3.1.1
Association Rule Mining
The Association Rule Mining is used to find the frequent patterns from the resultant data set. Two types of ARM steps is pruning and joining. Minimum support and Minimum confidence are important techniques were applied in the dataset.
To finding the association the dataset was applied in the Alpha Miner Tool. The first step is data understanding, the dataset were applied in the input file. The second step is data preparation, the dataset were applied in dataset attributes, and it includes attribute, dataset, data type and role. The third step is data preparation, run the dataset using the transactionalization. The fourth step is association, the run dataset were applied, and the minimum support and minimum confidence are chosen and run. Finally step is reciprocate the result shown in exploration.
3.1.2
Multilayer Perceptron
Multilayer perceptron is used to find the student‟s Object Oriented Programming skills using confusion matrix. Detailed accuracy is achieved by using these following classifications, TP Rate, FP Rate and ROC area.
To find the correct accuracy using weka tool. In the first step the csv file is opened from preprocessing. Unwanted fields are remove. The second step is classify and choose the multilayer perceptron. The classification results are identified by Stratified cross-validation and Confusion Matrix. It consists of the following test options are Use Training set, Supplied test set, Cross-validation and Percentage split. Finally, result is taken from the classifier output.
3.2
Trait Emotional Intelligence
Trait Emotional Intelligence is classified by five factors. It consists of Well being, Self control, Emotionality, Sociability and Global Trait EI. The test was conducted to the student by TEI questionnaire. The seven point Likert-Scale is used in the questionnaire.
3.3
OO Programming Skills Test
[image:2.595.331.525.484.587.2]The Object Oriented Programs test was conducted to the students. It includes C, C++ and Java Questions.
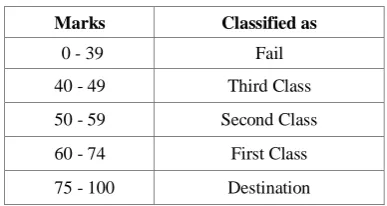
Table 1. Programming skills are classified
Marks Classified as
0 - 39 Fail
40 - 49 Third Class
50 - 59 Second Class
60 - 74 First Class
75 - 100 Destination
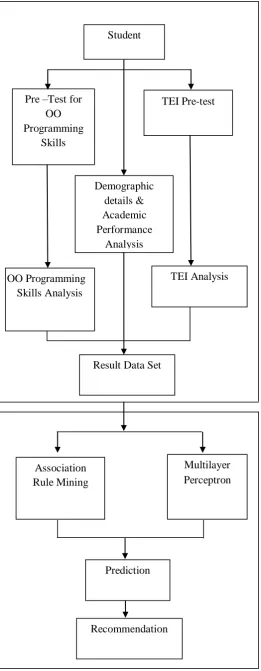
Fig.1 Design methodology
Two phases are discussed in figure 1. In the first phase the questionnaire was divided into three parts. This first part of the questionnaire contained demographic details and students academic details. It includes like name, age, gender, locality and educational qualification details. The second part of the questionnaire was Object Oriented programming skills. It includes C, C++ and Java questions. The third part of the questionnaire was Trait Emotional Intelligence Questionnaire (TEIQue). It includes 30 questions. The seven pointLikert scale (1- strongly disagree and 7- strongly agree) is used in this experiment. A pretest was conducted from small of students. The result from the pretest is analyzed and a re-test was conducted with large students.
The second phase contained two data mining techniques were applied in the resultant data set. The Association Rule Mining is to find the association between the students and academic and programming skills marks. The Multilayer Perceptron is to find the correct accuracy of students‟ details and error measures. Finally, predicts and recommendation a clear view of where students are good at and where they can improve the programming skills.
4.
RESULT AND DISCUSSION
[image:3.595.301.567.403.708.2]Alpha Miner tool was used on the resultant data set incorporating Association rule mining and likewise Weka tool is used for the Multilayer Perceptron technique.
Table 2: Association Rule Mining based on TEI and students programming skills.
Table 2 states that male students from rural areas with self control, sociability and well being agree are academically very strong and are either awarded with distinction or first class in programming skills, whereas female students who are
Rule
No. Rule
Items Size
Sup- port(%)
Confi- dence(%)
25 M, A => RURAL 3 10.90 100
31 RURAL, D => M 3 10.90 100
52 SA, D => M 3 10.90 100
65 M, A => WBA 3 10.90 100
106 SCN, SA => RURAL 3 10.90 100
118 EN, SCA => RURAL 3 10.90 100
160 WBA, B => RURAL 3 10.90 100
161 B => RURAL, WBA 3 10.90 100
162 RURAL, B => WBA 3 10.90 100
165 RURAL, D => WBA 3 10.90 100
188 RURAL, D => GTA 3 10.90 100
196 B => RURAL 2 10.90 100
203 SA, A => F 3 10.90 100
273 SA, A => WBA 3 10.90 100
276 SA, D => WBA 3 10.90 100
298 SA, D => EA 3 10.90 100
302 SCA, SN => WBA 3 10.90 100
365 B => WBA 2 10.90 100
396 EA, SD => GTA 3 10.90 100
OO Programming
Skills Analysis
Result Data Set
Demographic
details &
Academic
Performance
Analysis
Student
TEI Pre-test
Pre –Test for
OO
Programming
Skills
TEI Analysis
Multilayer
Perceptron
Recommendation
Prediction
Association
Rule Mining
Result Data Set
Classification
Association Rule
Mining
Decision Tree
Rule Based
sociability agree achieved first class in the same. The item sizes 2 and 3 have a minimum support of 10.90 and a 100% confidence for the relevant categories.
Table 3: Confusion Matrix for students programming skills Gender wise
Classified As A B
A = MALE 67 1
B = FEMALE 3 39
Using Multilayered Perceptron detailed accuracy is achieved by using these following classifications, TP Rate, FP Rate, Precision, Recall, F-Measure and ROC area. In table 3 the results of the students programming skills are displayed which derives a conclusion that male students are sounder in programming than that of their female counterparts.
[image:4.595.64.273.134.211.2]The accuracy details are: correctly and incorrectly classified instances (96.3636%, 3.6364%), TP rate for male and female (0.985, 0.929), FP rate (0.071, 0.015), and ROC area (0.977, 0.977), the weighted average TP rate, FP rate and ROC area are (0.964, 0.05, and 0.977) respectively.
Table 4: Confusion Matrix for Students academic performance
Classified as A B C
A = A 48 0 0
B = D 2 42 0
C = B 0 0 18
Table 4 is classified according to the student‟s academic performance, where A represents first class, D represents distinction and B second class. It was found that maximum number of students scored first class in academics. The correctly and incorrectly classified instances are (98.1818%, 1.8182%), the weighted average TP rate, FP rate, and ROC area are (0.982, 0.014, 0.97) respectively.
Table 5: Confusion Matrix for Locality
Classified As A B
A = RURAL 75 7
B = URBAN 7 21
Table 5 describes the students programming skills based on the locality; it was found that students from rural areas had more skill in programming than students from urban areas. The classified instances are 87.2727% correctly and 12.7273% incorrectly, the weighted average TP rate, FP rate and ROC area are (0.873, 0.208, 0.811) respectively.
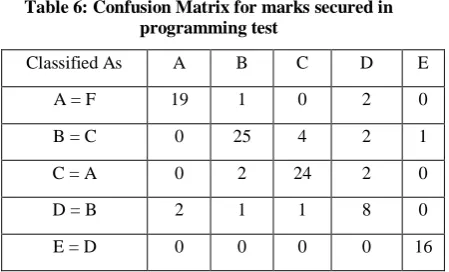
Table 6: Confusion Matrix for marks secured in programming test
Classified As A B C D E
A = F 19 1 0 2 0
B = C 0 25 4 2 1
C = A 0 2 24 2 0
D = B 2 1 1 8 0
E = D 0 0 0 0 16
Table 6 describes the results of the programming test conducted. F denotes failure, C denotes Third class, B second class, A first class and D denotes distinction. The accuracy details are as follows, correctly and incorrectly classified instances (83.6364%, 16.3636%), the weighted average TP rate, FP rate and ROC area are (0.836, 0.043, 0.895) respectively.
Table 7: Confusion Matrix for TEI’s first factor – Well Being
Classified As A B C
A = WBN 10 2 0
B = WBA 0 92 0
C = WBD 0 0 6
[image:4.595.57.280.379.450.2]Table 7 programming skills classified by TEI‟s first factor Well Being. Whereas WBN means well being neutral, WBA well being agree and WBD well being disagree, it was found that those students with well being agree had better programming skills. The accuracy details are as follows, correctly and incorrectly classified instances (98.1818%, 1.8182%), the weighted average TP rate, FP rate and ROC area are (0.982, 0.093, 0.947) respectively.
Table 8: Confusion Matrix for TEI’s second factor – Self Control
Classified As A B C
A = SCN 26 7 1
B = SCA 4 60 2
C = SCD 0 1 9
[image:4.595.309.549.583.678.2]13.6364%), the weighted average TP rate, FP rate and ROC area are (0.864, 0.128, 0.962) respectively.
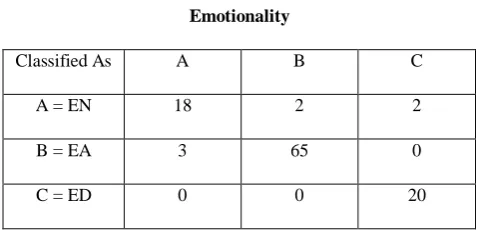
Table 9: Confusion Matrix for TEI’s third factor – Emotionality
Classified As A B C
A = EN 18 2 2
B = EA 3 65 0
C = ED 0 0 20
Table 9 programming skills classified by TEI‟s third factor Emotionality. EN means Emotional Neutral, EA Emotional Agree and ED Emotional Disagree, it was found that those students with emotionally agree had better programming skills. The accuracy details are as follows, correctly and incorrectly classified instances (93.6364%, 6.3636%), the weighted average TP rate, FP rate and ROC area are (0.936, 0.04, 0.977) respectively.
Table 12: Error Measures of MLP classification
Table 10: Confusion Matrix for TEI’s fourth factor – Sociability
Classified as A B C
A = SA 56 0 0
B = SN 2 22 6
C = SD 2 6 16
Table 10 programming skills classified by TEI‟s fourth factor Sociability. SA means sociability agree, SN Sociability Neutral and SD Sociability Disagree, it was found that those students with Sociability Agree had better programming skills. The accuracy details are as follows, correctly and incorrectly classified instances (85.4545%, 14.5455%), the weighted average TP rate, FP rate and ROC area are (0.855, 0.073, 0.922) respectively.
Classification Factors
Kappa statistics
Mean absolute
error
Root mean square
error
Relative absolute error
Root relative squared error
Gender 0.9223 0.0408 0.1728 8.6361% 35.5379%
Academic
performance 0.9708 0.0375 0.1281 9.0087% 28.0892%
Locality 0.6646 0.1285 0.3139 33.631% 71.9894%
Well-Being 0.9333 0.0185 0.111 9.3353% 35.9019%
Self-Control 0.7451 0.1005 0.2282 27.9045% 53.9275%
Emotionality 0.8841 0.063 0.1736 17.2175% 40.7103%
Sociability 0.7613 0.1073 0.2742 25.9407% 60.327%
GTEI 0.6775 0.1159 0.2945 33.6189% 71.2465%
Programming test
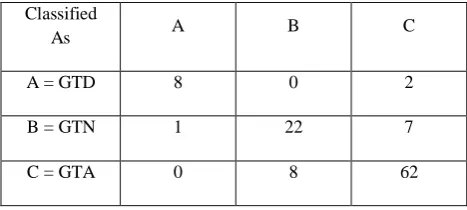
[image:5.595.47.288.112.227.2] [image:5.595.83.516.382.731.2]Table 11: Confusion Matrix for TEI’s final factor – Global Trait Emotional Intelligence
Table 11 programming skills classified by TEI‟s final factor Global Trait Emotional Intelligence (GTEI) which consists of Adaptability and Self-Motivation facets. GTD means Global Trait Emotional Intelligence disagree, GTN means Global Trait Emotional Intelligence neutral and GTA means Global Trait Emotional Intelligence agree, it was found that those students with Global Trait Emotional Intelligence neutral had better programming skills. The accuracy details are as follows, correctly and incorrectly classified instances Table 12 describes that error measure of MLP classification based on the confusion matrix. The classification factors are as follows, Gender, Academic performance, Locality, Well-being, Self-control, Emotionality, Sociability, GTEI and Programming test skills. The summary of Stratified cross-validation contains Kappa statistic, Mean absolute error, Root mean squared error and Relative absolute error. The result of multilayer perceptron shows low error rate and high level of accuracy result.
5.
CONCLUSION
This experiment was conducted to identify the students‟ Programming skills and academic performance with respect to their Trait Emotional Intelligence factors. An association was made between the TEI facets and the students programming skills. The main purpose of this study was to attain insight on how will a student perform based on the TEI and the student‟s programming skills. The association was possible through utilizing two data mining techniques, Association Rule Mining and Multilayer Perceptron. The association was found that male students from rural areas with Self Control, Sociability and Well Being Agree were awarded high in their programming skills, the female students who were Sociability Agree achieved first class in the same. Male students from a rural background performed well in programming skills than those from an urban background. This analysis is used to improve the students‟ programming skills in educational domain. It gives a solution for improve their TEI scores and reducing the students‟ low score in the TEI and programming skills in educational institution.
6.
ACKNOWLEDGMENTS
First and foremost, I thank the God for the blessings showered on me. I would like to thank my family, friends, colleagues, the publishers and all those who supported me.
7.
REFERENCES
[1] Jiawei Han and Micheline Kamber, “Data Mining: concepts and techniques”, Morgan Kaufmann Publishers, San Francisco, 2006.
[2] L. Arockiam et.al, “Deriving Association between Urban and Rural Students Programming Skills”, IJCSE International Journal of Computer Science and Engineering, Vol. 02, No. 03, 2010, 687-690.
[3] S. Kannan and R. Bhaskaran, “Association Rule Pruning based on Interestingness Measures with Clustering”, IJCSI International Journal Of Computer Science Issues, Vol. 6, No. 1, 2009, ISSN: 1694- 0784.
[4] Rakesh Agrawal, Tomasz Imielinski and Arun Swami, “Mining Association Rules between Sets of Items in Large Databases”, Proceedings of the 1993 ACM SIGMOD Sonference Washington DC, USA, May 1993. [5] Norazlina Khamis and Sufian Idris, “Investigation current object oriented programming assessment method” in Malaysia‟s University, Proceeding of the International Conference on Electrical Engineering and Informatics, Institut Teknologi Bandung, Indonesia June 17-19, 2007.
[6] Dhanraj, A. Ramesh and A. Suresh Kumar, “Recommended System for Students Academic Performance based on Personality and Informal Learning”, International Journal of Computer Applications (0975 – 8887) Volume 33- No. 7, November 2011.
[7] V. Maria Antoniate Martin, M.Edison and George Gabriel Richard Roy, “An Association between Trait Emotional Intelligence and Personality Trait based on Students Performance”, CiiT International Journal of Software Engineering and Technology, March 2012, ISSN: 0974 – 9632.
[8] Natalie L. Shipley, Mary Jo Jackson and Sharon Larisa Segrest, “The effects of emotional intelligence, age, work experience, and academic performance”, Research in Higher Educational Journal.
[9] C. Romero and S. Ventura, “Educational Data Mining: A Survey from 1995 t0 2005”, Expert System with Applications 33 (2007) 135 – 146.
[10]E. Chandra and K. Nandhini, “ Knowledge Mining from Student Data”, European Journal of Scientific Research, Vol.47, No. 1 (2010), pp. 156 – 163, ISSN: 1450 - 216X. [11]C. Deep, K. SathiyaKumari and V. Pream Sudha,
“Prediction of the Compressive Strength of High Performance Concrete Mix Usig Tree Based Modeling”, International Journal of Computer Applications (0975 – 8887) Volume 6- No. 5, September 2010.
[12]C. Deep, K. SathiyaKumari and V. Pream Sudha, “A Tree Based Model for High performance Concrete Mix Design”, International Journal of Science and Technology. Vol. 2(9), 2010, 4640-4646.
[13]K.V. Petridesa, Norah Fredericksonb, Adrian Furnhamb “The role of trait emotional intelligence in academic performance and deviant behavior at school”, Personality and Individual Differences, Vol.36, 2004, pp. 277–293. Classified
As A B C
A = GTD 8 0 2
B = GTN 1 22 7
[14]Stella Mavroveli, K. V. Petrides, Carolien Rieffe, Femke Bakker, “Trait emotional intelligence, psychological well-being and peer-rated social competence in adolescence”, British Journal of Developmental Psychology, 2007, Vol. 25, pp. 263–275.
[15]Stella Mavroveli, K.V. Petrides, Chloe Shove, Amanda Whitehead, “Investigation of the construct of trait emotional intelligence in children”, Eur Child Adolesc Psychiatry, 2008, Vol. 17, pp. 516–526.
[16]Andrew Cooper, K. V. Petrides, “A Psychometric Analysis of the Trait Emotional Intelligence Questionnaire–Short Form (TEIQue–SF) Using Item Response Theory Journal of Personality Assessment, 2010, Vol. 92(5), pp. 449–457.
[17]Maria Josesa Nchez-Ruiz, Juan Carlos Perez-Gonzalez, K. V. Petrides, “Trait emotional intelligence profiles of
students from different university faculties”, Australian Journal of Psychology, 2010, Vol. 62, No. 1, pp. 51–57. [18]M. J. Sánchez-Ruiz, D. Hernández-Torrano, J. C. Pérez-González, M. Batey and K. V. Petrides ”The Relationship between Trait Emotional Intelligence and Creativity Across Subject Domains” Springer, 2011. [19]Genetic and Environmental Correlations between Trait
Emotional Intelligence and Humor Styles [2009].
8. AUTHOR PROFILE
V. Maria Antoniate Martin is working as an Assistant Professor in Department of Information Technology, St. Joseph‟s College (Autonomous), Tiruchirappalli, Tamil Nadu, India. He has 1 year experience in teaching field and 2 years experience in his research area. He has published one research article in an international journal. His current area of research is Data Mining.