http://dx.doi.org/10.4236/jwarp.2014.611093
Reducing Nitrogen Loss in Subsurface Tile
Drainage Water with Managed Drainage and
Polymer-Coated Urea in a River Bottom Soil
Patrick R. Nash1, Kelly A. Nelson2, Peter P. Motavalli1
1Department of Soil, Environmental, and Atmospheric Sciences, University of Missouri, Columbia, USA 2Division of Plant Sciences, University of Missouri, Columbia, USA
Email: [email protected]
Received 23 June 2014; revised 21 July 2014; accepted 12 August 2014
Copyright © 2014 by authors and Scientific Research Publishing Inc.
This work is licensed under the Creative Commons Attribution International License (CC BY).
http://creativecommons.org/licenses/by/4.0/
Abstract
Poorly-drained, river bottom soils can be high corn (Zea mays L.) yielding environments, but sa-turated soil conditions often reduce corn yields. Wabash soils located in river bottoms in North-east Missouri have not been traditionally tile drained due to high clay content which requires narrow tile drain spacings. Increased land prices in the region have increased interest in tile draining poorly-drained bottom land soils to increase corn yields which could have a deleterious effect on water quality. The objectives of the three-year study were to determine whether use of managed subsurface drainage (MD) in combination with a controlled release N fertilizer could reduce the annual amount of 3
−
NO -N loss through tile drainage water compared to free subsur-face drainage (FD) with a non-coated urea application. Annual 3
−
NO -N loss through tile drainage water with FD ranged from 28.3 to 90.1 kg·N·ha−1. Nitrogen fertilizer source did not affect 3
− NO -N loss through tile drainage water, which was likely due to limited corn uptake over the three-year study due to adverse weather conditions. Averaged over three years, MD reduced tile water drained 52% and 3
−
NO -N loss 29% compared to FD. Reduction in 3
−
NO -N loss through tile drai-nage water with MD compared to FD was due to reduced tile flow during the non-cropping period. Annual flow-weighted mean concentration of 3
−
NO -N in the tile water was 5.8 mg·N·L−1 with FD and 8.1 mg·N·L−1 with MD. Tile draining river bottom soils at this location for continuous corn production may not pose a health risk over the evaluated duration.
Keywords
Tile Drainage
1. Introduction
Poorly-drained, silty clay soils in river bottoms located in Northeast Missouri and throughout the Midwestern U.S. often have high soil fertility [1] and can produce high corn yields. However, saturated soil conditions due to poor drainage, high seasonal water tables, and flooding due to the low landscape position often reduce corn yields. Soils of the Wabash soil series located in Northeast Missouri have a low overall soil hydraulic conductiv-ity (Ksat = 0.01 to 0.10 µm·sec−1) due to high clay content throughout the soil profile, which requires narrow subsurface tile drain spacing. Therefore, poorly-drained Wabash soils have not traditionally been tile drained as the cost of installing subsurface tile drainage systems is relatively high. Increased land prices in the region [2] and relatively high grain prices may now make tile draining poorly-drained, river bottom soils that have not tra-ditionally been drained an economically viable management option to reduce excessive soil moisture and in-crease corn yields.
The increased use of free subsurface drainage (FD) in agricultural fields has led to environmental concerns regarding N loading of surface waters [3]. An increased rate of water infiltration and transport out of soils with FD has increased N entering surface waters [4] [5]. Aquatic ecosystems can be sensitive to an anthropogenic ad-dition of N as it is one of the most limiting nutrients in aquatic ecosystems. Nitrogen concentrations above natu-ral levels in surface waters can result in hypoxia and eutrophication [3], which involves rapid algae growth and decomposition which in turn depletes oxygen levels below what is required for high forms of aquatic life [6]. Additionally, nitrate-N concentration above 10 mg·N·L−1 in drinking water has been reported to cause health problems [7].
The potential for NO3
−
-N entering surface waters as a result of agricultural fields with tile drainage is high due to N inputs and the high mobility of NO3
−
-N in soil [6] [8]. Additionally, the recent shift toward continuous corn production could further increase NO3
−
-N loss in tile drainage water as higher annual rates of N are re-quired to obtain maximum yield compared to crop rotations with soybean, small grains, or forage grasses [9]. A three-year continuous corn study with N applied at 224 kg·N·ha−1 annually, reported NO3
−
-N loss through tile drainage water as high as 59 kg·N·ha−1 annually [10]. Annual flow-weighted mean concentration of NO3
− -N in tile water from fields in corn production can be greater than 10 mg·N·L−1[11] [12] and have been reported as high as 43 mg·N·L−1 [10]. However, drier conditions that reduce tile flow can result in higher flow-weighted mean concentrations of NO3
−
-N in tile water compared to what would commonly be observed [13]. Research has shown up to 34% of the annual NO3
−
-N loss through tile drainage water occurred during the non-cropping period [14]. A managed subsurface drainage system (MD) is similar to FD, except for the addition of a water level control structure, which allows for the control of tile drainage flow. Managed drainage has re-duced annual water drained 30% to 50% compared to FD [14]-[16]. Annual reductions in NO3
−
-N loss in tile drainage water with MD compared to FD ranged from 32% to 58% [8] [10] [17]. The ability to reduce annual
3
NO−-N loss through tile drainage water with MD compared to FD was derived from reducing the amount of water drained during the non-cropping period [4] [18].
Controlled-release, polymer-coated urea fertilizer (PCU) may further reduce NO3
−
-N loss in tile drainage water flow. The rate of N release from PCU was a function of moisture and temperature [19]. In Missouri, PCU applied in April released less than 30% urea-N into the soil by June when broadcast on the soil surface [20] and less than 40% when incorporated in the soil at a shallow depth (2 - 5 cm) [21]. The controlled-release of urea-N with this technology could reduce the availability of applied N until later in the growing season when soil condi-tions are less conducive to environmental N loss and when plant N uptake is greater. Noellsch et al. (2009) [22] reported that PCU increased corn N uptake 24% in a low-lying landscape position compared to non-coated urea (NCU). Nelson and Motavalli (2013) [23] reported PCU increased corn yield 7% compared to NCU with FD.
Combining PCU with MD may greatly reduce early season N loss and increase corn uptake of applied N which could further reduce annual nitrate-N loss through tile drainage water. No research has evaluated the ef-fect of PCU on NO3
−
loss through tile drainage water. The objectives of the study were to 1) quantify the average concentration and annual loss of NO3
−
-N in tile drain water from a poorly-drained river bottom soil, and 2) determine whether MD with PCU could reduce NO3
−
-N loss in tile water compared to FD with NCU.
2. Materials and Methods
2.1. Site Description and Experimental Design
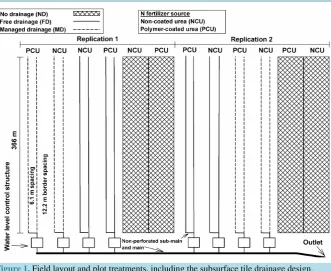
This three-year study (June, 2010 to June 2013) was conducted on a private farm production field in a river bot-tom soil located in Northeast Missouri (40˚3ꞌ11.5"N, 92˚4ꞌ21.2"W). The investigation was part of a larger project evaluating the effects of subsurface tile drainage and N fertilizer source on continuous corn production [24]. Subsurface tile drains (10.2 cm diameter, perforated plastic tubing) and water level control structures (AgriDrain Corporation, Adair, IA) were installed in the summer prior to the initiation of the study in April 2010. Tile drains were installed at a depth of 0.9 m with 6.1 m spacings. An additional 6.1 m separated each plot in order to limit movement of water and N into adjacent plots (Figure 1). Plots were 18 by 366 m long. Study years represented the period of time from application of N in the spring until the application of N the following season
(Table 1).
The study was arranged as a two-way factorial, two-replication, randomized complete-block design. Treat-ments included drainage (FD and MD) in combination with N fertilizer sources [NCU and PCU (ESN, Agrium Advanced Technology, Denver, CO)]. Nitrogen fertilizer was broadcast applied at 202 kg·N·ha−1 and incorpo-rated into the soil (5 - 10 cm) directly after application and prior to planting (Sunflower disk harrow, Beloit, KS). Deep tillage (Blu-Jet, SubTiller 4, Thurston Manufacturing Company, Thurston, NE) was used after harvest as a form of residue management. Harvest did not occur in 2010 as a flood in June 2010 resulted in a total crop fail-ure. Field site management including N application rates and dates, plant dates, harvest dates, and water level control with MD can be found in Table 1.
The soil type was a Wabash silty clay (fine, smectitic, mesic Cumulic Vertic Endoaquolls) located in a river bottom. Soil samples (composites of three subsamples) were collected from each plot to a depth of 0.0 to 0.3 m, 0.3 to 0.6 m, and 0.6 to 0.9 m in the fall after harvest each year using a Giddings hydraulic probe (Giddings Machine Company, Windsor, CO) fitted with a 4.5 cm diameter steel probe. Soil properties combined over plots are presented by depth over years inTable 2 were analyzed using standard soil testing analytical procedures for Missouri [25]. Soil NH4
+
-N and NO3 −
-N concentrations were converted from mg·kg−1 to kg·ha−1 based on soil bulk density measurements taken at the depths of 0 - 0.3, 0.3 - 0.6, and 0.6 - 0.9 m at the field site in 2013. Daily rainfall was measured on-site using a rain gauge and datalogger (Automata, Nevada City, CA).
2.2. Water Sample Collection, Flow, and Nitrate Loss Measurements
Pressure transducers (American Sensor Technologies, Mount Olive, NJ) measured water height year-round in each plot’s water-level control structure. Water height was measured every five minutes, and dataloggers stored the data (Automata, Nevada City, CA). During periods of flow in 2012 and 2013, daily water height readings were recorded manually in the water-level control structures using a Little Dipper field instrument (Heron In-struments, Dundas, Ontario), as a means of data quality assurance. Flow rates were obtained by subtracting the height of the slides from the water height readings in the control structures and then using the equation:
(
1)
( )
2Flow rate L m⋅ − =1.4533 Flow depth cm∗ (1)
The equation, obtained through laboratory testing [26], was specific to the dimensions of the water-level con-trol structures and angle of the top weir slides used in the study. Flow rates were divided by the area drained (12.2 × 366 m) to obtain measurements of flow over time and area, which estimated total daily flow from each plot. Portable automated water samplers (Teledyne ISCO, Lincoln, NE) were used in conjunction with liquid level actuators (Teledyne ISCO, Lincoln, NE) to collect water samples every six hours when flow was present. Water samples were combined into daily composite samples. During winter, water samples were manually collected approximately every other day when flow was present. Tile drainage water samples were stored in a refrigerator (5˚C) and filtered (1.5 µm, 934-AH, Whatman Glass Microfiber, General ElectricBio-Sciences, Pittsburgh, PA) prior to being analyzed for NO3
−
Figure 1. Field layout and plot treatments, including the subsurface tile drainage design.
Table 1. Field site management including fertilizer applications, plant and harvest dates, and water level control manage- ment with managed drainage during the study.
Field site management 2010 2011 2012
N fertilizer application 28 June 2010 8 May 2011 14 May 2012
Rate (kg·N·ha−1) 202 202 202
Planting date 29 June 2010 9 May 2011 15 May 2012
Rate (seeds·ha−1) 79,000 79,000 79,000
Harvest date† - 7 Nov. 2012 9 Nov. 2012
Water level control—Free drainage mode 28 Jun. 2010 25 Mar. 2011 23 Mar. 2012 Water level control—Managed drainage mode 6 Aug. 2010 13 July 2011 25 May 2012
Water level control—Free drainage mode -‡ 8 Oct. 2011 -
Water level control—Managed drainage mode - 13 Dec. 2011 -
†
[image:4.595.92.539.560.710.2]Corn crop was lost in 2010 due to a flood. ‡Not applicable.
Table 2. Selected soil chemical properties from fall soil analysis at depths of 0 to 0.3, 0.3 to 0.6, and 0.6 to 0.9 m in 2010, 2011, and 2012. Data were averaged over tile drainage systems and N fertilized sources.
Exchangeable (1 M NH4AOc)
Year Depth pH Organic matter Neut. acidity CEC† Bray I P Ca K Mg
4
NH+-N NO3
−-N
m 0.01 M CaCl2 g·kg−1 cmolc·kg−1 mg·kg−1 kg·ha−1
2010 0 - 0.3 5.2 26.0 5.1 27.7 46.5 8368 242 992 18.3 24.8
0.3 - 0.6 5.3 18.9 4.3 26.4 13.3 8026 191 1071 14.3 11.5
0.6 - 0.9 5.6 14.3 2.7 26.1 12.6 8321 208 1243 13.2 9.7
2011 0 - 0.3 5.4 31.4 4.2 25.5 44.2 7671 395 1003 32.9 14.1
0.3 - 0.6 5.9 24.6 2.4 26.3 11.6 8422 371 1252 18.2 11.5
0.6 - 0.9 6.3 18.5 0.9 24.2 6.3 8117 387 1284 15.6 8.8
2012 0 - 0.3 5.1 26.8 5.8 25.8 58.4 7255 256 928 16.1 47.7
0.3 - 0.6 5.5 20.3 3.7 25.5 9.5 7745 220 1155 5.5 14.1
0.6 - 0.9 5.9 14.9 2.0 23.7 4.2 7575 219 1208 5.3 6.7
†
2.3. Statistical Analysis
Soil N concentration, water drained, NO3 −
N loss, and flow-weighted mean concentration of NO3 −
-N in the tile drainage water by drainage period (FD period, MD period, and cumulative) and study year were statistically analyzed for treatment effects using ANOVA and PROC GLM with SAS v9.3 [27]. Soil NH4
+
-N and NO3 −
-N concentration after harvest was only affected by depth and year. Water drained, NO3
−
-N loss, and flow- weighted mean concentration of NO3
−
-N in the tile drainage water were not affected by N fertilizer source or year, but were affected by subsurface drainage system. Significant differences in treatment means were deter-mined using Fisher’s Protected LSD at P = 0.05 or 0.10.
3. Results and Discussion
3.1. Precipitation
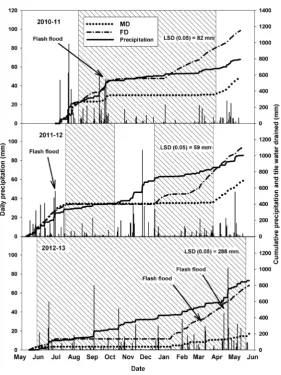
The intensity and distribution of precipitation varied over the three year study (July, 2010 through May, 2013)
(Figure 2). High precipitation throughout the 2010 growing season resulted in two flood events (June and
Sep-tember), which resulted in a complete crop failure. Precipitation over the period of July through September, 2010 was 532 mm, which was 280 and 349% greater than in 2012 and 2011, respectively. From October 2010 through March 2011, precipitation totaled 147 mm. Similar to 2010, high intensity precipitation during the spring resulted in a flood event in June; however, crop failure did not occur in 2011. Precipitation over the pe-riod of April through June, 2011 was 402 mm, which was 51% greater than in 2012. From July through October 2011, precipitation was low (168 mm) which resulted in drought conditions. Precipitation in November 2011 was high (226 mm), while precipitation from December 2011 through February 2012 was 184 mm which was common for the region and similar to 2010-2011 and 2012-2013. Drought conditions occurred through the spring, summer, and fall in 2012. High intensity precipitation events during the non-cropping period in April and June of 2013 (454 mm) resulted in multiple flooding events.
3.2. Soil Nitrogen Concentration
Excessive or lack of precipitation significantly (P ≤ 0.05) affected soil NH4
+
-N and NO3
−
-N after harvest at the depths of 0 - 0.3, 0.3 - 0.6 and 0.6 - 0.9 m over the three-year study (Table 3). From 2010 to 2011, soil NH4
+ -N concentration increased from 16.3 to 33.6 kg·N·ha−1 at 0 to 0.3 m depth, 14.6 to 18.4 kg·N·ha−1 at 0.3 to 0.6 m depth, and 12.8 to 16.2 kg·N·ha−1 at 0.6 to 0.9 m depth. Soil NH4
+
-N concentration in 2012 compared to 2010 was similar at the 0 to 0.3 m depth, and less at the 0.3 to 0.9 m depth. High soil NH4
+
-N concentration in 2011 was presumably due to low precipitation throughout the summer and fall that limited the conversion of NH4
+ -N to NO3
−
-N. Soil NO3
−
-N concentration at a 0.3 to 0.9 m depth was similar from 2010 to 2012. However, the soil NO3
−
-N at 0 to 0.3 m depth was 14.8 kg·N·ha−1 in 2011 which was lower than 2010 (26.4 kg·N·ha−1) and 2012 (46.5 kg·N·ha−1). The relatively high soil NO3
−
-N concentration in 2010 was presumably due to high pre-cipitation and limited corn N uptake due to complete crop failure. In 2012, soil NO3
−
-N concentration was greater than in 2010 and 2011, which was likely due to drought conditions throughout the spring and summer that limited environmental N loss and corn N uptake which was followed by high precipitation in the fall prior to harvest and soil sampling. Therefore, dry early growing season conditions in combination with wet fall condi-tions probably increased the potential for NO3
−
-N loss during the non-cropping period, and subsequently in-creased the potential for reducing annual NO3
−
-N with MD compared to FD.
3.3. Tile Water Drained
Cumulative water drained over each study year ranged from 800 to 1150 mm with FD and 201 to 691 mm with
MD (Figure 2). Throughout the three-year study, tile flow was constant with FD and with MD when in FD
Figure 2. Daily precipitation (bars), cumulative precipitation (solid lines), and tile water drained (dashed/dotted lines) by tile drainage system (FD = free drainage system and MD = managed drainage system) and years. The start of each study year corresponds to the spring N application. Shaded areas repre- sent the period of time that MD treatments were in managed drainage mode.
Table 3. Effect of year and depth on soil NH4
+
-N and NO3
−
-N concentrations after harvest. Data were averaged over N fertilizer source and drainage treatments.
Soil NH4
+-N Soil
3
NO−-N
Depth (m) 2010 2011 2012 2010 2011 2012
kg·N·ha−1 kg·N·ha−1
0 - 0.3 16.3 33.6 16.4 26.4 14.8 46.5
0.3 - 0.6 14.6 18.4 5.6 11.2 11.3 13.2
0.6 - 0.9 12.8 16.2 5.1 9.8 8.5 6.1
LSD (P = 0.05) 3.7 9.1
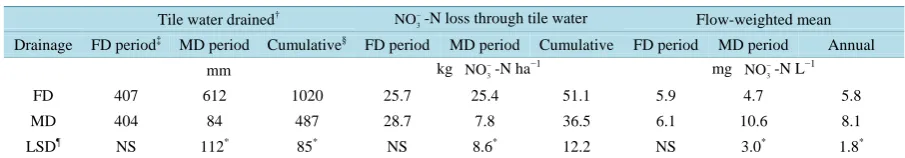
[image:6.595.174.456.79.455.2] [image:6.595.87.540.551.645.2]Table 4. Effect of drainage water management system on tile water drained, NO3−-N loss through tile water flow, and flow-weighted mean concentration of NO3−-N averaged over three years.
Tile water drained†
3
NO−-N loss through tile water Flow-weighted mean
Drainage FD period‡ MD period Cumulative§ FD period MD period Cumulative FD period MD period Annual
mm kg NO3
−-N ha−1 mg
3
NO−-N L−1
FD 407 612 1020 25.7 25.4 51.1 5.9 4.7 5.8
MD 404 84 487 28.7 7.8 36.5 6.1 10.6 8.1
LSD¶ NS 112* 85* NS 8.6* 12.2 NS 3.0* 1.8*
†
Abbreviations: FD = free drainage; LSD = least significant difference; MD = managed drainage; NS = not significant. ‡ FD period represents the pe-riod of time that tile flow was not restricted with MD, while MD pepe-riod represents the pepe-riod of time when tile flow was restricted with MD. § Cumu-lative or annual represents the period of time from application of N at planting until the application of N in the following year. ¶ A single asterisk fol-lowing an LSD value represents a P-level of 0.05 and no asterisk represents a P-level of 0.10.
the winter period due to limited freezing of the soil compared to soils in Ontario, Canada.
3.4. Nitrate-N Concentration and Loss in Tile Drainage Water
Cumulative NO3 −
-N loss averaged over the three study years ranged from 28.3 (2010-2011) to 90.1 kg·N·ha−1 (2011-2012) with FD (Figure 3), which was likely due to differences in tile flow, soil N concentration, and plant uptake. Previous research studies on continuous corn with FD have reported that annual NO3
−
-N loss through tile drainage water increased from 4 to 59 kg·N·ha−1 due to carry-over N [10] and 16.5 to 47.8 kg·N·ha−1 due to the application of N in the fall compared to spring [28]. Average NO3−-N loss through tile drainage water over a study year ranged 12.8 (2012-2013) to 70.2 kg·N·ha−1 (2011-2012) with MD. Similar to Gast et al. (1978) [10], high NO3
−
-N loss in the tile drainage water over the 2011-2012 study year was likely due to wet spring condi-tions and carry-over N, which resulted in approximately 60 kg NO3
−
-Nha−1 of loss for both FD and MD during the FD period from 9 May through 12 July, 2011. Additionally, a presumably high water table due to the low landscape position of the river bottom soil likely contributed to tile flow and the high annual NO3
−
-N loss through the tile drainage water, as compared to the annual 6 to 66 kg NO3
−
-N ha−1 loss reported in previous re-search with FD on upland soils in corn production [12] [28]-[30].
Nitrogen fertilizer source did not affect cumulative NO3 −
-N loss over the three-year study. Nitrogen presum-ably was not a limiting factor over the experiment due to dry summer and fall conditions that limited gaseous N loss and corn N uptake in combination with annual applications of 202 kg·N·ha−1. Averaged over three-years, cumulative NO3
−
-N loss though tile drainage water with MD (36.5 kg·N·ha−1) was significantly (P ≤ 0.10) re-duced 29% compared to FD (51.1 kg·N·ha−1) (Table 4). Previous research studies on upland soils have reported 32% to 58% reduction in annual NO3
−
-N loss through tile drainage water with MD compared to FD, which was attributed to reductions in the annual water drained with MD [14] [17] [18]. Although water drained over a study year was reduced 52% on average with MD compared to FD, NO3
−
-N loss was only reduced by 29%. Higher 3
NO−-N concentration in the tile water observed at times with MD compared to FD over the three-year study partially offset the reduction in water drained and subsequent NO3
−
-N loss through tile drainage water with MD
(Figure 3). Increased NO3
−
-N concentration in the tile drainage water with MD compared to FD was likely due the annual reduction in tile flow and limited corn uptake of applied N which may have increase soil N concentration.
Over the FD period, NO3 −
-N loss was similar between FD (25.7 kg·N·ha−1) and MD (28.7 kg·N·ha−1) on av-erage (Table 4). While over the MD period, MD significantly (P ≤ 0.05) reduced NO3
−
-N loss 69% compared to FD due to an 86% reduction in water drained over that period. In Ontario, Drury et al. (2009) [14] reported a 38% reduction in NO3
−
-N loss over the non-cropping period with MD compared to FD, which was due to a 34% reduction in water drained over non-cropping period. Greater reduction in water drained and subsequent NO3
− -N loss over the non-cropping period in this study may have been due to reduced freezing of the soil in Missouri as compared to in Ontario, Canada. These results indicate the potential to reduce the annual NO3
−
-N loss from tile drainage with MD may be greater in warmer climates with less potential for freezing of soil during the non- cropping period.
3.5. Flow-Weighted Mean Concentration of Nitrate-N in Tile Drainage Water
Similar to water drained and NO3
−
-N loss, flow-weighted mean concentration of NO3
−
[image:7.595.86.539.118.197.2]Figure 3. Daily concentration of NO3−-N in tile drainage water (circles) and cumulative NO3−-N loss (lines) by tile drainage treatment (FD = free draina- ge system and MD = managed drainage system) and years. The start of each study year corresponds to the spring N application. Shaded areas represent the period of time that MD treatments were in managed drainage mode. NS = not significant.
significantly (P ≤ 0.05) affected by drainage systems during the MD period and the entire study year (Table 4). Over the FD period, flow-weighted mean concentration of NO3
−
-N in the tile drainage water was similar be-tween MD (6.1 mg·N·L−1) compared to FD (5.9 mg·N·L−1). Over the MD period, flow-weighted mean concen-tration of NO3
−
-N in the tile drainage water was 125% greater with MD (10.6 mg·N·L−1) compared to FD (4.7 mg·N·L−1). Increased flow-weighted mean concentration of NO3
−
-N in the tile water with MD during the MD period as compared to the FD period was likely due to reduced tile flow, which has been reported between growing seasons with FD [13].
Average flow-weighted concentrations of NO3
−
-N over a study year were greater with MD (8.1 mg·N·L−1) compared to FD (5.8 mg·L·ha−1). Previous tile drainage research in corn production on upland soils have re-ported annual flow-weighted mean concentration of NO3−-N in tile water in the range of 6 to 43 mg·N·L−1
[10]-[13]. Annual flow-weighted mean concentration of NO3
−
-N was below what was commonly reported in upland soils in corn production, as well as below the 10 mg·N·L−1 required for drinking water standards [7]. This indicates that subsurface tile draining silty clay river bottom soils may not pose a health concern.
4. Conclusion
Similar to previous research on continuous corn in upland soils, cumulative NO3
−
water with FD ranged from 28.3 to 90.1 kg·N·ha−1. High NO3 −
-N loss in the tile drainage water in one of the study years was likely due to carry-over N from the previous season in combination with high tile flow due to wet conditions, as well as a presumably high water table due to the low landscape position that contributed to the tile water flow. Managed drainage was effective in reducing NO3
−
-N though the tile drainage water (29%) compared to FD over the three-year study. A reduction in NO3
−
-N loss with MD compared to FD was primarily due to reduced tile flow over the non-cropping period. However, reduced tile flow with MD in combination with dry growing season conditions likely limited environmental N loss and corn N uptake during non-flow periods did result in slightly higher NO3
−
-N concentration in the tile drainage water with MD compared to FD. Howev-er, flow-weighted mean concentration of NO3
−
-N was rarely higher than the 10 mg·N·L−1 drinking water stan-dard. Therefore, tile draining river bottom soils for improved continuous corn production may not be a major health risk.
Acknowledgements
The authors thank the Missouri Fertilizer and Ag lime distributors for their financial support of this study. We would also like to thank Chris Dudenhoeffer, Clint Meinhardt, John Shetley, and Brandon Hebbert, for helping with the collection of water samples, as well as Ashley Hall for her contributions to the laboratory work required for this study.
References
[1] Watson, F.C. (1979) Soil survey for Knox, Monroe, and Shelby Counties, Missouri. United States Department of Agriculture, Soil Conservation Service, U.S. Gov’t Printing Off., 8-20.
[2] University of Missouri Extension (2009) Farm Land Values for Missouri Counties. University of Missouri. http://extension.missouri.edu/p/g403
[3] United States Environmental Protection Agency (1992) The National Water Quality Inventory. The 1992 Report to Congress. USEPA, Washington DC.
[4] Fausey, N.R., Brown, L.C., Belcher, H.W. and Kanwar, R.S. (1995) Drainage and Water Quality in Great Lakes and Cornbelt States. J. Irrig. Drain Eng., 121, 283-288. http://dx.doi.org/10.1061/(ASCE)0733-9437(1995)121:4(283) [5] Gilliam, J.W., Baker, J.L. and Reddy, K.R. (1999) Water Quality Effects of Drainage in Humid Regions. In Skaggs,
R.W. and Van Schilfgaarde, J., Eds., Agricultural Drainage. Agron. Monogr. 38. ASA, CSSA, and SSSA, Wisconsin, 801-830.
[6] Burkart, M.R. and James, D.E. (1999) Agricultural-Nitrogen Contributions to Hypoxia in the Gulf of Mexico. Journal of Environmental Quality, 28, 850-859. http://dx.doi.org/10.2134/jeq1999.00472425002800030016x
[7] United States Environmental Protection Agency (2009) National Primary Drinking Water Regulations. USEPA. http://water.epa.gov/drink/contaminants/upload/mcl-2.pdf
[8] Sims, J.T., Simard, R.R. and Joern, B.C. (1998) Phosphorus Loss in Agricultural Drainage: Historical Perspective and Current Research. Journal of Environmental Quality, 27, 277-293.
http://dx.doi.org/10.2134/jeq1998.00472425002700020006x
[9] Adviento-Borbe, M.A., Kaye, J.P., Bruns, M.A., McDaniel, M.D., McCoy, M. and Harkcom S. (2010) Soil Green-house Gas and Ammonia Emissions in Long-Term Maize-Based Cropping Systems. Soil Science Society of America Journal, 74, 1623-1634. http://dx.doi.org/10.2136/sssaj2009.0446
[10] Gast, R.G., Nelson, W.W. and Randall, G.W. (1978) Nitrate Accumulation in Soils and Loss in Tile Drainage Follow-ing Nitrogen Applications to Continuous Corn. Journal of Environmental Quality, 7, 258-261.
http://dx.doi.org/10.2134/jeq1978.00472425000700020021x
[11] Baker, J.L. and Johnson, H.P. (1981) Nitrate-Nitrogen in Tile Drainage as Affected by Fertilization. Journal of Envi-ronmental Quality, 10, 519-522. http://dx.doi.org/10.2134/jeq1981.00472425001000040020x
[12] Randall, G.W. and Vetsch, J.A. (2005) Nitrate Losses in Subsurface Drainage from a Corn-Soybean Rotation as Af-fected by Fall and Spring Application of Nitrogen and Nitrapyrin. Journal of Environmental Quality, 34, 590-597. http://dx.doi.org/10.2134/jeq2005.0590
[13] Drury, C.F., McKenney, D.J., Findlay, W.I. and Gaynor, J.D. (1993) Influence of Tillage and Nitrate Loss in Surface Runoff and Tile Drainage. Soil Science Society of America Journal, 57, 797-802.
[15] Evans, R.O., Skaggs, R.W. and Gilliam, J.W. (1995) Controlled Versus Conventional Drainage Effects on Water Qual-ity. Journal of Irrigation and Drainage Engineering, 121, 271-276.
http://dx.doi.org/10.1061/(ASCE)0733-9437(1995)121:4(271)
[16] Gilliam, J.W., Skaggs, R.W. and Weed, S.B. (1979) Drainage Control to Diminish Nitrate Loss from Agricultural Fields. Journal of Environmental Quality, 8, 137-142. http://dx.doi.org/10.2134/jeq1979.00472425000800010030x [17] Evans, R.O., Skaggs, R.W. and Gilliam, J.W. (1990) Management Practice Effects on Water Quality. In: Harris, S.C.,
Ed., Proceedings of the 1990 National Conference, Irrigation and Drainage Division, ASCE, 182-191.
[18] Fogiel, A. and Belcher, H.W. (1991) Water Quality Impacts of Watertable Management Systems Annual Report. Dep. Agric. Eng., Michigan State University, Lansing.
[19] Fujinuma, R., Balster, N.J. and Norman, J.M. (2009) An Improved Model of Nitrogen Release for Surface-Applied Controlled-Release Fertilizer. Soil Science Society of America Journal, 73, 2043-2050.
http://dx.doi.org/10.2136/sssaj2009.0085
[20] Nash, P.R., Nelson, K.A., Motavalli, P.P. and Meinhardt, C.G. (2012) Effects of Polymer-Coated Urea Application Ra-tios and Dates on Wheat and Subsequent Double-Crop Soybean. Agronomy Journal, 104, 1074-1084.
http://dx.doi.org/10.2134/agronj2011.0235
[21] Nelson, K.A., Motavalli, P.P. and Dudenhoeffer, C.J. (2014) Cropping System Affects Polymer-Coated Urea Release and Corn Yield Response in Claypan Soils. Journal of Agronomy and Crop Science, 200, 54-65.
http://dx.doi.org/10.1111/jac.12040
[22] Noellsch, A.J., Motavalli, P.P., Nelson, K.A. and Kitchen, N.R. (2009) Corn Response to Conventional and Slow-Re- lease Nitrogen Fertilizers Across a Claypan Landscape. Agronomy Journal, 101, 607-614.
[23] Nelson, K.A. and Motavalli, P.P. (2013) Nitrogen Source, Drainage, and Irrigation Affects Corn Yield Response in a Claypan Soil. Applied Engineering in Agriculture, 29, 875-884. http://dx.doi.org/10.13031/aea.29.9809
[24] Nash, P.R. (2014) Utilization of Managed Subsurface Drainage Systems to Increase Corn and Forage Yields and Re-duce Nitrogen Loss in Poorly-Drained, Upland and Bottomland Soils. Dissertation, University of Missouri, Columbia.
[25] Nathan, M., Stecker, J. and Sun, Y. (2006) Soil Testing in Missouri: A Guide for Conducting Soil Tests in Missouri. University of Missouri. http://soilplantlab.missouri.edu/soil/ec923.pdf
[26] Chun, J.A. and Cooke, R.A. (2008) Technical Note: Calibrating Agridrain Water Level Control Structures Using Ge-neralized Weir and Orifice Equations. Applied Engineering in Agriculture, 24, 595-602.
http://dx.doi.org/10.13031/2013.25274
[27] SAS Institute (2013) SAS 9.3. SAS Inst., Cary.
[28] Hernandez-Ramirez, G., Brouder, S.M., Ruark, M.D. and Turco, R.F. (2011) Nitrate, Phosphate, and Ammonium Loads at Subsurface Drains: Agroecosystems and Nitrogen Management. Journal of Environmental Quality, 40, 1229- 1240. http://dx.doi.org/10.2134/jeq2010.0195
[29] Jaynes, D.B., Colvin, T.S., Karlen, D.L., Cambardella, C.A and Meek, D.W. (2001) Nitrate Loss in Subsurface Drai-nage as Affected by Nitrogen Fertilizer Rate. Journal of Environmental Quality, 30, 1305-1314.
[30] Qi, Z., Helmers, M.J., Christianson, R.D. and Pederson, C.H. (2011) Nitrate-Nitrogen Losses through Subsurface Drainage under Various Agricultural Land Covers. Journal of Environmental Quality, 40, 1578-1585.