2000
Value added service strategy for Jakarta
International Container Terminal : comparative
study of value added services in the ports of
Rotterdam, Malmo and Aarhus
Raja Oloan Saut Gurning
World Maritime University
Follow this and additional works at:http://commons.wmu.se/all_dissertations
Part of theEconomics Commons
This Dissertation is brought to you courtesy of Maritime Commons. Open Access items may be downloaded for non-commercial, fair use academic
Recommended Citation
Gurning, Raja Oloan Saut, "Value added service strategy for Jakarta International Container Terminal : comparative study of value added services in the ports of Rotterdam, Malmo and Aarhus" (2000).World Maritime University Dissertations. 101.
VALUE ADDED SERVICE
STRATEGY FOR JAKARTA INTERNATIONAL
CONTAINER TERMINAL
A comparison study of value added services in the ports of Rotterdam,
Malmö and Aarhus.
By
RAJA OLOAN SAUT GURNING
IndonesiaA dissertation submitted to the World Maritime University in partial fulfilment of the requirement for the award of the degree of
MASTER OF SCIENCE
In
PORT MANAGEMENT
2000
DECLARATION
I certify that all the material in this dissertation that is not my own work has been identified, and that no material is included for which a degree has previously been conferred on me.
The contents of this dissertation reflect my own personal views, and are not necessarily endorsed by the University.
...……… (Signature)
...……… (Date)
Supervised by:
Name: Professor Doctor Shuo Ma
Office: Course Professor, Port and Shipping Management World Maritime University
Assessor:
Name: Professor Doctor Bernard Francou Office: Associate Professor, Port Management
World Maritime University
Co-assessor:
Name: Dr.Hans Ludwig Beth
ACKNOWLEDGEMENTS
First of all, I would like to state my thanks and praise to my LORD, JESUS CHRIST who has given me strength and wisdom to complete my studies, this dissertation and duties at World Maritime University.
Regarding to my studies, I would like to express my deep gratitude to all the parties who in one way or another have facilitated and contributed my studies in Sweden .
My special thanks and appreciation to my sponsor, Japan Foundation especially Mr. Sasakawa, for granting me the privilege of this scholarship
I also wish to express my deep gratitude to Professor Shou Ma, Professor of Port and Shipping Management, Professor Bernard Francou, associate Professor of Port Management, Dr. H.L. Beth as co-assessor and visiting professor of WMU and all other professors and lecturers including ESSP teaching team at WMU as well as visiting professors for all their advice, directives and sharing their immense knowledge and experience.
I shall be thankful to the personnel of the Library, the Reception, Secretariat, the Canteen, all the administrative staff of WMU and all staff of Henrik Smith Hostel for their assistance, co-operation, kindness and politeness.
I would also like to express my special thanks to all friends my colleagues I both formally and informally shared with, which enriched the results of my studies at WMU.
I would like to express my sincere thanks to the beautiful City of Malmö and the Swedish Government for their kind hospitality and all facilities given to me during my stay in this wonderful country.
ABSTRACT
Title of Dissertation: Value added service strategy for Jakarta International Container Terminal; a comparison study of value added services in the ports of Rotterdam, Malmö and Aarhus.
Degree: MSc
The dissertation is a comparison study of value added service in ports presently, analysing the added value gained through various innovative activities and the possible services applied in Jakarta International Container Terminal (JICT).
A brief look on types of value added services offered in ports are identified. The services in terms of horizontal, vertical and global aspects are analysed in particular. Moreover, the percentage of additional value added contributed from this service is calculated and compared.
Due to the plan of the Indonesian government to build 10 agricultural terminals in Indonesia, there are new opportunities for JICT to extend their existing services in offering value-added services as a distribution centre based on agricultural products. The examples of value added services in comparing ports related to agricultural product are given. Moreover, the impacts of the strategy on terms of employment, value added and distribution of wealth are identified and analysed.
Finally, a summary of findings and recommendations for how JICT could implement the value added service strategy are given
CONTENTS
Declaration………ii
Acknowledgements ………..iii
Abstract……… v
Contents………vi
List of Tables……….. xi
List of Figures……….. xii
List of Abbreviations………...xiii
1. Introduction……….……1
2. What is a value added service ?. ………. 5
2.1. Definition of Value Added Service………... 5
2.2. Type of value added service in container terminal……….... 5
2.2.1. Horizontal terms………... 7
2.2.2. Vertical terms………8
2.2.3. Global terms………..9
2.3. Added value calculation……….9
3.1. Revenue and added value of JICT………...12
3.2. The need of value added service………..15
4. Comparison of ports….…………..……… 18
4.1. Port of Rotterdam……… 18
4.1.1. Type of VAS offered………18
4.1.2. Added Value of AS………..19
4.1.3. Cost Breakdown for VAS……… 22
4.2. Port of Malmö………..24
4.2.1. Added Value of VAS………...24
4.2.2. Cost Breakdown for VAS………26
4.3. Port of Aarhus………. 28
4.3.1. Type of VAS offered………28
4.3.2. Added Value of VAS………... 29
4.3.3. Cost Breakdown for VAS……….31
4.4. Comparated factors among ports……… 33
4.4.1. Value added gained among comparing port………..33
4.4.2. Value added of VAS among ports……… 34
4.4.3. Cost comparison between comparing ports………...37
5. Analysis of Possible value added services in JICT………. 41
5.1. Traffic Trend………41
5.2 Value added services based on agriculture product ………... 43
5.3. Core competency vis-à-vis rivals……….44
5.4. Type of VAS can be offered………46
5.4.1.1. Consolidation and distribution services………. 47
5.4.1.2. Packing and processing services……… 48
5.4.1.3. Information services………... 49
5.4.1.4. Container Services………. 51
5.4.2. Vertical services terms……… 52
5.4.2.1. Block train service………. 53
5.4.2.2. Road (refrigerated transport service)………..53
5.4.3. Global services terms………... 54
5.5. The impacts of value added services……….. 56
5.5.1. Value added……… 56
5.5.2. Employment……… 58
5.5.3. Distribution of wealth………. 60
5.5.4. Investment………... 61
5.5.4.1. Land………61
5.5.4.2. Packing facility………...61
5.5.4.3. Quality Control Facility………..62
5.5.4.4. Controlled Temperature Storage……… 62
5.5.4.5. Container yard……… 62
5.5.4.6. Transportation and lifting equipment……… 63
5.5.4.7. Dry stores………63
5.5.4.7. Information system……… 63
5.5.5. Possibility……… 64
6. Conclusion and Recommendations……….……… 66
6.1. Conclusion……….. 66
6.2. Recommendations……….………. 68
6.2.2. Legal Status……….. 69
References……….……… 70
Appendices
Appendix A The operational performance indicators of JICT……… 75
Appendix B JICT traffic (commodity) handled………...76
Appendix C Container and agri-product commodity handled in the Port
Of Rotterdam………...78
Appendix D Revenue report for VAS in the Port of Malmö….………. 79
Appendix E Cost report for VAS in the Port of Malmö…….………..…………. 80
Appendix F Existing and proposed agri-chain through JICT………..81
Appendix G The flow of packing activities……… 82
Appendix H Proposed ICD service location………82
Appendix I Transportation cost per metric ton of poultry commodity from
Kabanjahe to Jakarta………... 83
Appendix K Remote reefer monitoring benefits………. 84
Appendix L Percentage of Container condition in JICT ……… 85
Appendix M Value added services a la carte………86
Appendix N Total estimated added value of VAS……….. 87
Appendix O Estimated value of 10 agri-terminals ……… 88
Appendix P Crude investment appraisal ……… 89
Appendix Q Value added services among compared ports………. 90
LIST OF TABLES
Table 1 Revenue and value added of JICT per month in 1999……… 14 Table 2 Value added services offered in Port of Malmö ……….24 Table 3 Added value comparison among ports……… 34 Table 4 Estimated employment ratio for one ton of agriculture
LIST OF FIGURES
Figure 1 Costs breakdown of JICT………15
Figure 2 Organization hierarchy of JICT……….. 17
Figure 3 Added value from VAS (in percentage)………. 20
Figure 4 Information value in Port of Rotterdam……… 21
Figure 5 Cost breakdown for VAS in Rotterdam Port……….. 23
Figure 6 Added value from VAS in Malmö Port……….. 25
Figure 7 Information value in Malmö Port………25
Figure 8 Costs breakdown of VAS in Port of Malmö………... 27
Figure 9 Aarhus’s value added from VAS……… 30
Figure 10 Information part of VAS………. 30
Figure 11 Costs breakdown for VAS of Aarhus Port……….. 31
Figure 12 VAS comparison among ports……… 35
LIST OF ABBREVIATIONS
AVS Added value service
CCM Cold Chain Management
CFS Container Freight Station
CTS Controlled Temperature Storage
CY Container Yard
DMaS Distribution Management System
EDI Electronic Data Interchange
FCL Full Container Load
GDP Gross Domestic Product
GRDP Gross Regional Domestic Product
GTX Global Tele-Exchange
HPH Hutchison Port Holdings
HO Holding Order
ICD Inland Container Depots
JICT Jakarta International Container Terminal
LBD Logistic and business department
LCL Less than Container Load
LLA Local Liner Agents
MDT Monitor of Mobile Data Terminal
NLG Netherland Gulden
OOCL Orient Overseas Container Line
PIC Port Information Center System
POMaS Port operating Management System
PTI Port operating Management System
SCT Surabaya Container Terminal SIBOR Singapore Interbank offered Rate
TEU Twenty–foot Equivalent Unit
TIC Terminal Information Centre
TOMaS Terminal Operating Management System
UNCTAD United Nations Conference on Trade and Development
USD United States of America Dollar
US$ United States of America Dollar
Chapter 1
INTRODUCTION
The philosophy saying that the vessel follows the goods has been a pattern of the port’s role in the global transportation chain. Ports around the world are changing to become third and even fourth generation ports. This is mainly due to information, network, and innovative services beside the traditional service and facility used. These changes are mainly derived from competition between ports and the demands of port users on the basis of an integrated transport chain in terms of production and distribution activities.
Jakarta International Container Terminal (JICT) as the biggest container port in Indonesia is facing a serious competition with other domestic and regional ports. It has existing and potential strength in hinterland connections, distribution centers (distrikpark), transshipment operations, logistic services, information services, knowledge and capital. However, the development of the port does not reflect and support the changing of future industrial needs in using the port services and the competition in the area of Malacca Strait that greatly impacts the market share of the port.
creating new innovative services for cargoes in order to increase its competitive level.
One of the strategies is specific value added creation called added value service (AVS) for reaching customer satisfaction and enhancing the competitiveness of the port. [Verbeke, 1995]. Moreover, Policy Research Corporation NV (1997) argues about the benefits of applying a value-added policy on the strategy planning. Those benefits are as follows:
1). To get information about the evolution development of the value added and its structure; the changes of the value added produced by a port and its composition provides insights on the structure of the port and its efficiency.
2). To compare the value added gained by the port (and its composition) with the value added created in the sector as a whole.
This composition sets the port position itself with respect to its competitors and the sector as a whole, but also relates to a sub-sector of the ports with a similar structure, market coverage or strategy.
3).To have insights into the structure, operations, and relations within a consortium of ports or a link of related companies:
The elements in the structure can be identified where the value added and its components are gained. This information is significant for developing the future structure and/or new relationship with the consortium or chain of ports
4).To examine its importance on a macro-economic level; in negotiations with regional and national authorities, the importance of the port on a macro-economic level can be very important.
been putting in information services as an important tool to support its operation and services. Those ports are creating an innovative service called added value service
and gaining the benefit measured as value added for the port. Comparing those ports offering their value added service in terms of distribution centers, logistics and multimodal activities based information service would allow identifying the consequences of the ports improving its position in specific high value added service categories or service niches for overall added creation (see Haezendonck, Coeck, and Verbeke, 1996).
The comparison type used in this dissertation is an academic comparison to get a general strategy on commercial and managerial aspects of the port service. In order to fulfill the “like with like” pattern and uniform standard (Ma, 2000), single standard is used and compared in comparing the value added level gained in those port services.
In general, this dissertation aims at searching, comparing, and analyzing the value added services offered in the ports of Rotterdam, Malmö, and Aarhus compared to JICT Indonesia. Through six chapters this dissertation will discuss the detailed objectives:
1. To identify many forms of a value added service in a port.
2. To compare the value added services provided by the port of Rotterdam, the port of Aarhus and the port of Malmö which can be applied in Jakarta International Container Terminal (JICT).
3. To identify possibility to establish a new value added service in JICT. 4. To create a conceptual plan in establishing an added value port services.
In reaching these objectives, chapter two was dedicated to explore the various services called value-added services. This included the calculation of added value of these services in ports.
Concerning the competition among ports regionally in Southeast region and nationally in Indonesia coverage area, JICT should consider the need to expand its traditional services to services outbound the terminal area. The existing added value should be evaluated in order to justify the ability of terminal resources to get more value. Therefore, in chapter three an analysis of the value added gained and the cost breakdown of its existing service will be covered by analyzing both factors, as well as the need for the value added services in the terminal and the cost or incurred on this.
Moreover, a comparison of the ports such as the port of Rotterdam, the port of Malmo and the port of Aarhus have been taken as references in various specific strategies used. The detailed value, costs, and comparison of these values quantitatively will be devoted in chapter four.
Having taken into consideration these experiences, strategies, and values, and the need to provide new services, JICT should investigate which services are possible to be realized in short and long terms.
In addition, the possible added value in offering various activities could be estimated. These analyses are dedicated to chapter five. Furthermore, this chapter discusses the impact of these services on jobs, and distribution of wealth and investment.
Chapter 2
WHAT IS A VALUE ADDED SERVICE ?
2.1. DEFINITION OF VALUE ADDED SERVICE
In general value added service (VAS) is the activity or service giving more net value and level of quality of the service. The service or activity, which are based on how to put additional, value or increase the net level of it. Samuelson in 1998 defines the value added as the difference between a firm’s sales and its purchases of materials and services from other firms. In detail, Lipsey in 1983 mentioned that this activity aim at adding the net value of a firm’s output.
Another source, the dictionary of wisdom system (www.wizdomsystem.com) defines a value added service as a process that adds value to an output and product or service; that is, the activity merits the cost of the resources it consumes in production.
The Policy Research Corporation N.V. interprets value added service (VAS) as the service which contributes to the efficiency of the logistics process and thereby enhances the value of the goods; these services are a sources of value added, consisting of wages, depreciation and profit.
2.2. TYPE OF VALUE ADDED SERVICES IN CONTAINER TERMINALS
in terms of production characteristics, third generation port provides cargo and information distribution, multiple service package, and high value added services. Furthermore, Prof. Ma (2000) and Prof. Francou (1999) mentioned that third generation ports are characterized by their infrastructure, superstructure and infostructure.
Based on that, value added services are not only physically related to transport of goods, but enhance the efficiency of the logistics process as a whole through support of the entire logistics process. The type of value added services in container terminal and ports as general are:
- Assembling
- Value added logistic (VAL) storage
inventory management
distribution center
Warehousing
(Stuffing/unstuffing, crating, palletizing, shrink wrapping, labelling, weighing, repacking) - Inspection of cargo and quality
control
- PDI checking of containers
- Information center, providing real time information on the cargo related matters such cargo movements and cargo inventory.
-Maintenance and repair
For containers
For reefer units
Cleaning and washing of containers
Refurbishing of containers
The value-added activities in horizontal terms are those that operate in advanced processes in order to meet the customer’s need on the cargo handling and storing. Usually, in many references those activities are called value-added logistics.
They can be categorized in:
Physical activities
Logistic activities
Electronic documentation activities
The physical activities are those relating to storing activities in warehouses and repair workshops such as:
In warehouses
- Stuffing/Unstuffing containers - Crating
- Palletizing - Shrink wrapping - Painting, anti-parasite treatment,
lubrication, rust proof paint - Labeling - Printing - Weighing - Packing/repackaging - Sorting/re-sorting - Coding/bar-coding - Container checking
- Temperature checking (Controlled Temperature Store)
- Cargo inspection and quality control
In repair workshops
Generally is for maintenance and repair of container - For dry container
- For reefer container and installation
- Clearing and washing of containers
- Refurbishing of containers
The logistic activities relating to:
- Distribution center service - Buffer stock managing
on display transport or storage
Electronic documenting activities are those relating to:
- EDI system
- Electronic custom clearance and checking
- Terminal gate System - Invoicing
2.2.2. Vertical terms
The activities related to transportation (haulage) services from and to a port are: - Hinterland services
- Sea-based transport services (coastal and shipping)
Hinterland services are those relating to: - Trucking service
- Train (Block train) service
- Inland consolidation service like ICD (Inland Container Depot), External CFS
Transport chain services are activities relating to: - Inland waterway service
- Ship booking services
In practice, these kinds of services are aimed at securing market shares of a port through penetrating the hinterland. Furthermore, this service provider port is not longer be bound with its operations to the terminal location. Some parts of operations and services may spread far into the port’s hinterland. Dr. Beth informed that the practical decisions taken by a port (the port of Hamburg as an example) to secure their market share by penetrating the hinterland are:
By playing an active role in intermodal concepts
2.2.3. Global terms
Global terms are related to information services in the global communications system and trade. Clearly, the service is provided as an e-commerce port information service. This e-commerce service provides an electronic market exchanging information on "the digital market" among global shippers (exporters and importers), carriers and other parties as port community societies where the cargoes are transported and handled through the service port provider. As an example, a website GTX (portsnportals.com) is an e-commerce port information system that provides information linking shippers, carriers, ports, customs and other related parties.
Through these three service groups (horizontal, vertical and global), the area coverage of a port that provides these three categorized services consequently is changed. The horizontal services are activities mostly offered in the port area. Then the vertical service patterns use port hinterland as their coverage service. Furthermore, the global pattern service is done on a global scale where the service can be reached by a particular port community, but also by global port community partners through Internet.
2.3. ADDED VALUE CALCULATION
In analyzing the value added services the principle of added value in view of direct impact is used for the various activities offered among ports. Professor Francou (2000) defined two methods to calculate the port impact in added value measurement i.e. direct flow calculation and mass calculation.
value is calculated directly from the service provider in the area of considered ports by using the mass calculation. The information of value collected and calculated is not taken the port authority as an object but it only considers the direct service provider in the terminal such as the stevedoring company and terminal operators, and business and logistic department of Rotterdam, Malmö and Aarhus port.
In addition, the time basis of all data and information collected from these ports are subjected with the same year, in 1999 basis. In the port of Rotterdam, VAS data composed from the study of logistic and business department (LBD) of the port of Rotterdam in 1999 and reports and information from Seabrex Ltd., Ocean Warehousing Ltd. and Lehnkering stevedoring company as the service providers in the port of Rotterdam area. These companies are recommended by LBD as they are handles 30% container traffic in the port (Rotterdam logistic department, 2000) which also offers various activities in terms of VAS in the port of Rotterdam area.
In the port of Malmö, the way of collecting data is similar to in the port of Rotterdam which considered the logistic department of the port which directly offers the VAS to customers.
Meanwhile, for the port of Aarhus, the analysis of VAS focused on Aarhus stevedoring company, which is the operator of Aarhus container terminal in hadling and offering various value added services in the terminal.
In the JICT, the data and information are collected and calculated similar to other terminals which were compared. However, the activities considered in JICT are only from handling services without any value added services.
The other reference of measurement from the Policy Research Corporation NV, in 1997 explained the measurement in two methods i.e. additive and subtractive methods.
The additive method computes value added by adding together labor costs, capital cost and profit). Value added = (Labor + profit + depreciation) – capital expenditures.
The subtractive method computes the value added by describing more the profit and costs.
Value added = (Sales – (raw materials+energy)) + (Non operating receipts –
expenses) – Capital Expenditure
The unit used for calculating the added value is added value per container and ton handled. The usage of container unit is used for handling, information and documentation, some parts of transportation services, and repair activities. Meanwhile the ton unit is used to determine the value in the activities of distribution, advanced process, transportation, inspection and checking. However, in calculating the value added of JICT, it is an exceptional case as no VAS is offered currently in this port. At the end of the calculating process, the direct value added is based and calculated on container units handled by the terminals.
From the formula described above, the types of costs that can be analyzed are:
Labor costs
Material costs
Rental costs
Fuel / energy costs
Investment costs (for equipment ,
land , building including
mechanical and electrical
facilities)
Transportation costs
Administration costs (overhead
costs)
Chapter 3
JAKARTA INTERNATIONAL CONTAINER TERMINAL (JICT)
AND ITS ADDED VALUE
Jakarta International Container Terminal (JICT) is the largest container terminal in Indonesia and is one of the country’s most important economic gateways. The operations of this port started on 1st April 1999 handling and developing Container Terminal I, II and III of Tanjung Priok port for a period 20 years under a built operation and transfer (BOT) concession (Hutchison-Website, 2000
http://www.hph.com.hk/jct/index.asp).
Currently, the main business of the port is container handling and stacking services. However, no value added services (VAS) are provided to the port's customers. In order to offer the possible value added services in the future, the present value added and costs may be considered as a decision reference in planning the possible VAS.
3.1. REVENUE AND ADDED VALUE OF JICT
However, for the long term, it can be argued that this tariff will not still at the same level, due to the competition from other terminals such as direct regional competitors especially in the Malacca Strait area e.g. Penang Klang, Belawan, and Johor Port as far as feeder services are concerned. It other words, in the future if the port is going to have a leading position in the market, the terminal should find a solution in value added services.
For analyzing reasons, the profit value consisted of four items (royalty, public value, management value, and mother company value). Table 1 shows the biggest amount of value added per container gained by JICT 's mother company (Hutchinson group) about 50% followed by Government royalty (15%), Tax (15%), labor (9%), and public (5%) as the notable elements contributing added value per container moved. It means that actually with the existing activities JICT has made more impact for its mother company than to Indonesia side. If the 50% of value to Hutchison group are assumed no changes, then it can be predicted that JICT will be able to return its investment payment of about 247 million USD (as their winning bid in 1999) for 60 months or 6 years. However, due to the competition circumstances in the port business, this value will hardly be achieved if JICT does not extend their service pattern in order to attract cargo coming to the port.
On the royalty value, it can be stated this number to Pelindo II is a permanent quantity that JICT has to allocate as regulated on their agreement for 20 years. For the tax it can be assumed that as long as the government regulation on tax is not changed this level is going to be the same.
Like the tax, the public value relies on the government regulation. It can be assumed that this element will have the same percentage in the future.
As a conclusion, it can be stated that JICT should increase their added value by expanding the service pattern. Furthermore, the administration value can be considered as an important element. Therefore it should be taken into consideration in the future.
Table 1. Revenue and Value Added of JICT per month in 1999
No. TOTAL REVENUE (Rp) (USD) In Percentage
Handling services 60,291,975,056 8,038,930 PRODUCTION COSTS
1 Material cost 896,385,697 119,518 2.04%
2 Maintenance cost 3,935,820,414 524,776 8.94%
3 Insurance 162,026,640 21,604 0.37%
4 Rental cost 16,354,151,624 2,180,554 37.15%
5 Office cost 90,314,804 12,042 0.21%
Total 21,438,699,179 2,858,493
Profit deducted to costs 38,853,275,877 5,180,437
CONTRIBUTING VALUE
1 Public cost 2,992,323,143 398,976 6.80%
2 Management cost 997,999,997 133,067 2.27%
3 Cost out of handling 1,005,204,408 134,027 2.28%
4 Labor cost 5,501,214,386 733,495 12.50%
5 Royalty (to Pelindo II/Govt) 9,027,082,333 1,203,611 20.51%
6 Depreciation 3,053,552,219 407,140 6.94%
Total 22,577,376,486 3,010,317
Avg. Container handled/month 135,273
Added Value 61,430,652,363 8,190,754
Added Value/container 454,124 61
Added Value/man 48,870,845 5600
1 * Labor 40,667 5 8.96%
2 * Royalty (Govt) 66,732 9 14.69%
3 * Public 22,121 3 4.87%
4 * Management 7,378 1 1.62%
5 * Depreciation 22,573 3 4.97%
6 * Tax 68,119 9 15%
7 *JICT Group 226,534 30 50%
3.2. THE NEED OF VALUE ADDED SERVICES
As far as the value added services are concerned in the future, there are some elements from the existing operation costs which can be assumed as the future significant costs for offering value added services. These costs are labor, administration, energy, material, rental, transportation and information costs.
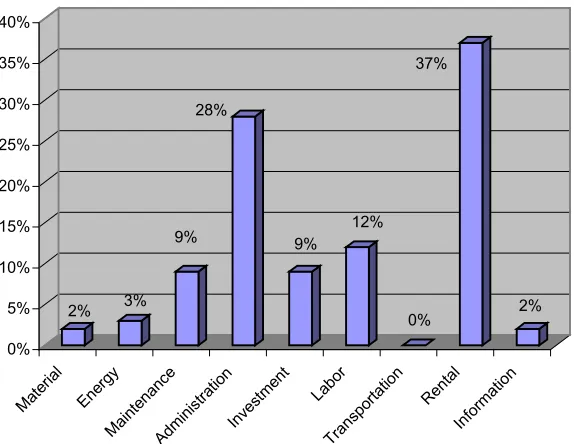
From Figure 1 below, it can be noted that in offering their handling operation, the port consumed a large part for rental costs (37%), administration cost (28%) as the significant costs in this terminal. The biggest production cost spent on the operation is the rental cost, which is about 37.15 % of the total costs. For the labor cost, it is calculated about 12%, which consisted of 8% for the non-management level, and 4% for the management level. This percentage is relatively low if compared to the ports of Rotterdam, Malmö and Aarhus.
Figure 1. Costs Breakdown of JICT Source: JICT Annual Report, 2000
This low level was caused by the low labor cost average in Indonesia. Moreover, it is an indication that about 65% of the labor costs are for management personnel, and 35% for non-management level.
The zero percentage on transportation cost is indicated clearly as there are no transportation costs separately allocated for the operation.
The administration cost about the 28% came from the office cost (0.21%), public cost (6.8%) and royalty costs to Pelindo II (20.51%). The biggest part for this can be stated as a permanent responsibility of the terminal during 20 years. Moreover, it can be argued as a risk that JICT should pay whatever the situation, either in loss or in pay off situations.
Material cost (2%), and energy cost (3%) are cost items, which are relatively low, compared to other elements. However, it does not mean that in giving the VAS in the future the cost for material and energy will still be same. The need of material and energy for the next service is fully dependent on what kind of VAS will be offered.
The information and communication costs (they can be categorized as management cost) about 2% can be stated as low level due to the fact that the information/communication cost actually is not expensive in Jakarta. This is because of a good infostructure system in Jakarta which creates an economical cost in operation.
Indonesia Port Corporation II (PT Pelabuhan II, 47%) and Pelabuhan II's employee cooperative, Koperasi Pegawai Maritim ("Kopegmar") about 2%. At container terminal III, the share of Hutchison is about 47% and the other 53% is owned by Port Corporation II.
Before Privatization After Privatization
Figure 2. Organization Hierarchy of JICT Source: JICT Annual Report, 1999
Under the shelter of the Pelindo II, for the short-term, JICT may get the benefit from the tariff regulation adjusted by Pelindo II, as a government agency. However, for the long term, this strategy will not work as the competition and the customers' needs and demands will drive the port to be focused on market oriented and innovations in giving services to the customers in the perspective of the transport chain. Therefore, JICT should not depend on this condition but should create new service patterns from the traditional handling operations.
Indonesia Port Corporation II Indonesia Port Corporation II
Container Terminal I
Container Terminal II
Container Terminal III
JICT
Container Terminal I
Chapter 4
COMPARISON OF PORTS
4.1. PORT OF ROTTERDAM
The port of Rotterdam is a value-added service port in Europe. It has been offering facilities and services for transportation chain needs in Europe as distribution center
providing integrated distribution services since 1986 in the form of multi users and dedicated terminals. The port has decided to concentrate their core competencies on transshipment services. Moreover, in commodity matters, since 1996 the port has noticed that there are two types of traffic on which the port has been concentrating. These are chemical based products and agriculture based products that have given a significant value added both to the port and the national GDP.
4.1.1. TYPE OF VAS OFFERED
As far as distribution and hinterland services are concerned Lehnkering B.V can be discussed as an example of a company that has offered various services on these two typical services. Lehnkering B.V is one of the terminal operators (a stevedoring company) in the Maasvlakte area (Mudde, 2000) that has been providing services in addition to the cargo handling such as:
Logistic services (transportation)
Warehousing and physical distribution
Inspection / survey , Sampling and weight determination
Chartering and ship's agency
Dangerous goods management
Forwarding Tank Cargo
4.1.2. THE ADDED VALUE OF VAS
From the information given by the logistic Department of the port Lehnkering and Seabrex BV, it could be estimated that the total added value per ton handled in the port of Rotterdam is about 23.85 US$ per ton. It comes from 293,333 containers handled by Lehnkering that gave about 73,735,485 US$ in that terminal. It is further predicted that about 42% of added value from VAS in 1998 until 1999 beside container handling services gave about 58%. Therefore, the total added value per ton from VAS is about 11.45 US$.
In detail, the added value gained per ton of containers handled from value added services provided is explained in Figure 3. In offering the VAS, transportation and distribution services become the core competence of the port in terms of VAS. It is reflected from the percentage of transportation (30%-35%) and distribution (15%-21%) services, which are the significant added values to the port. The services of storage, cargo control, draught surveys, documentation and information are the secondary services complementing the function of distribution center.
The percentage of transportation services sectors also indicates the hinterland penetration of the port throughout the chain of goods before transferred to port. It gives the port ability to control and manage the consolidation of cargo and container to and from the port through their CFS and container depots.
Externally, the infrastructure that is being used is really to support the service offered by the port, especially the block train service that has been applied to transport the goods instead of road service. Furthermore, in giving and servicing the customers (in terms of shipping lines and shippers) as a distribution center, the port has had the benefits in the transportation value added.
value added per ton handled. It means also the service offered has attracted the customers to let the port or terminal operator for some advanced activities such as packages, labeling, coding, sorting/re-sorting, weighting, and assembling for the cargoes and to distribute them to destination. In this case the port is involved in the door to door service for their customers.
In software packaged services given by the port such as information, documentation, draught surveys, and cargo control, it shows that the port has an active position to the customers' needs relating to the distribution and transportation services. It can be said that these activities contribute to port a moderate percentage of value added.
Figure 3. Added Value from VAS (in percentage). Source; Lehnkering BV, 2000, Logistic Business Dept., 2000
The portions of information as a kind of separated service can not be calculated directly, as information is not independently offered. This element is involved in many service forms. Generally, it is reported that the information service in the port has had a portion of about 12% for added value. These are divided in many parts of services. The biggest part is in transportation service where information has 4% from a total of 39% of the transportation service. This service is tracking services for
A d de d V alue F rom V A S
39% 13%
23% 14%
5% 6%
cargoes and containers, which are executed electronically through internet and satellite services linking with the same system operated by customers in Rotterdam or outside or by passing on the service provider's website on internet.
Figure 4. Information value in Port of Rotterdam. Source: Logistics Business Dept, 2000.
The same mode of operation is also used for distribution and draught survey services, which are performed in the port's warehouse or at certain distribution centers outside the port. The checking results are then sent to the customs office through the EDI line. Similar to the documentation service, the port gives their customers information services in transportation and distribution services. In these services, the information is used for booking, invoicing and tracking services. However, for services for cargo control and container repair, it is understandable that technical information service is not needed. It is found that in the port of Rotterdam (the port authority) is as a coordinator and facilitator in this service. The port coordinated the information system through a port community system to which all parties can get access to other players in the area of the port through the port community system gate (a website). Consequently, this port community system makes all the systems used in the port
Information Service in VAS
1% 0%
4% 3%
2% 0%
2%
area relatively inexpensive. Furthermore, it also ensures the security of the information due to the information management via the port community system.
4.1.3. COSTS BREAKDOWN FOR VAS
From Figure 5, it can be argued in offering their VAS the port operationally used up important portions for rental costs (21%), labor costs (15%) and investment costs (15%). And as a distribution center, then consequently, the service providers have consumed much on rental costs for space or land. Therefore, the goods handled spending time in the warehouse area for value added activities before being distributed and because of this process, and logically the material cost (8%) and energy cost (12%) contribute a moderate percentage in the VAS activities as activities need those elements.
Moreover, the space utilized for advanced processed contributes the investment costs
with about 15% as the fixed assets lie in the product process. The investment cost moreover is contributed from equipment purchasing for advanced activities in warehouses and the investment for transportation equipment.
Therefore, it can be stated that the VAS given by the port is fully dependent on investment decisions in terms of purchasing new equipment.
The relatively high percentage on transportation cost is due to an operational cost for railway and trucking services to and from the port of Rotterdam and destinations.
The labor cost is relatively high due to high labor costs (including overtime) in the Netherlands with about NLG 120 with additional social security and tax paid as one package of the worker's salaries.
Material costs (8%) and energy costs (12%) are costs items, which are needed in the advanced process of the goods to a particular stage (semi to finished product).
Figure 5. Costs breakdown for VAS in Rotterdam Port. Source; Lehnkering BV, 2000.
It means that in giving the VAS provided in the port of Rotterdam, the costs for material, and energy are the crucial factors in their operations. This is due to the fact that the port is dealing with some parts of production processes that need material and energy.
The information and communication costs about 10% are meaningful due to the fact that in concentrating on service-based orientation, the information system is totally needed to facilitate the service. This relative high percentage shows that the information/communication cost actually is not expensive in the port of Rotterdam. This is because of a good infostructure system in Netherlands and the port community system that facilitates and coordinates the flow of information, and as a result creates an economical cost in operation.
8% 12% 5% 2% 15% 15% 12% 21% 10% 0% 5% 10% 15% 20% 25% Mate rial Ener gy Mainte nance Adm inistr ation Inve stmen t Labo r Tran spor
tation Rental Infor
4.2. PORT OF MALMÖ
According to business volume (Port of Malmö Website, 2000,
http://www.mst.se/english/homepage/ehindex.html), the Port of Malmö is the fourth largest port in Sweden, after Gothenburg, Stockholm and Helsingborg.
Table 2. Value added services offered in Port of Malmö.
Source: Compiled from Financial Report Port of Malmo (1999) report and Port of Malmö Website,
http://www.mst.se/english/eindex.html
In terms of value added service (table 2), the port has found it as a diversification field to extend the business in the port industry. Through a field survey to the port, discussions with the managers, and searching from the Port's websites, it was found that the port is offering mainly two classified services. These are forwarding and container repair services.
4.2.1. Added Value of VAS
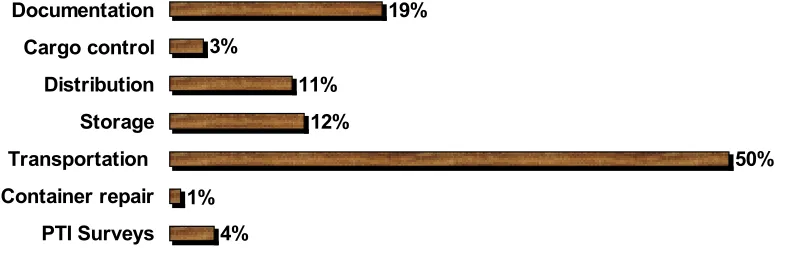
The traditional port operations have been expanded into comprehensive forwarding services such as logistics and agency services. These make the port of Malmö unique in offering VAS compared to the ports of Rotterdam and Aarhus. Through these services, the management was able to get 5,4 million SEK in 1999 that is about 30 % of the port's revenue (see appendix D). There was a 13% increase in revenues compared to 1998 when the port got 17 % from the revenues from these services. From the two main services offered, the forwarding services are the primary services, which give 73% added value from VAS, as explained in Figure 6. Moreover, the figure indicates that this forwarding service has three significant services; transportation, storage and distribution as typical logistic operation which takes 50%, 12% and 11% added value of VAS. A part about 3% value from the storage
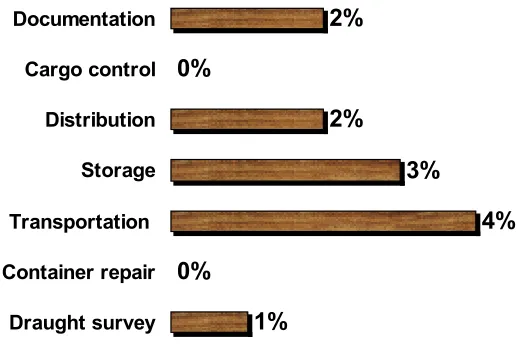
services, was gained for renting space outside the port for distribution purposes. Agency services give a moderate percentage for the port of about 26% (PTI 4%, Cargo control 3% and Documentation 19%). This percentage is not as high as logistics and agency services due to the function of this service to facilitate both services. Unlike forwarding service, the container service is a complement service to forwarding activities, providing 1% of added value.
Figure 6. Added value from VAS in Malmö Port. Source; Logistic Department Port of Malmö, 2000.
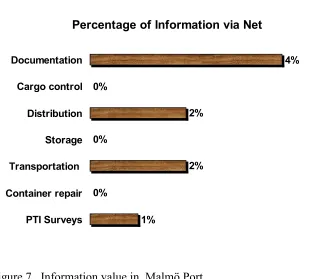
The portions of information as a kind of service can not be calculated directly. This element is involved in many service forms. Generally, it is reported that the information service in the port has had a portion about 9% for added value. Those are divided in many parts of services. The biggest part is in documentation service where the information has 4% from the total 19% documentation service. This comes from the factor that all clearing documentation is done electronically linked with the same system operated by the customs authority in Malmö. The same mode of operation is also used for PTI Survey that is performed in the port's warehouse. The checking results then sent to the customs office through the EDI line. Similar to the
Added Value From VAS
4% 1%
50% 12%
11% 3%
19%
documentation service, the port gives their customers information services in transportation and distribution services.
Figure 7. Information value in Malmö Port. Source; Logistic Department of Malmö Port, 2000.
In these services, the information is used for booking, invoicing and tracking services. While for services for cargo control, storage, and container repair, it is understandable that technical information service is not needed.
4.2.2. Cost breakdown for VAS
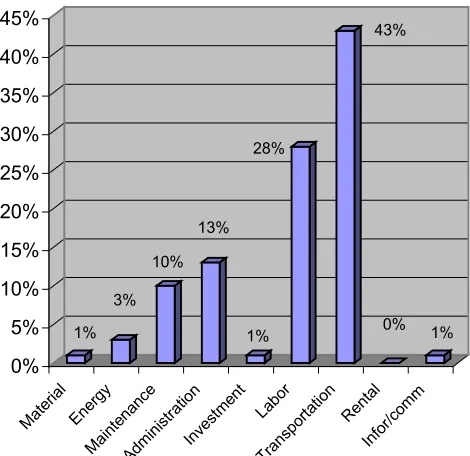
In offering their VAS, the costs spent at a big portion for transportation 43%, labor cost 28% and administration cost 15%, especially for documentation purposes followed by maintenance cost 10% (Figure 8). In matters of rental cost for space, it can be stated that the port pays the rental fee for land to the city of Malmo (as an owner of the land) as a main expense for this item. Relating to VAS, it seems that the port does not include the payment of land for warehouse mainly as a unit cost
Percentage of Information via Net
1% 0%
2% 0%
2% 0%
4%
calculated in these services (VAS). The relatively high percentage on transportation cost is due to payment for shipment or transferring the cargo and container by truck, rail or ship to the port of Malmö and destinations. The labor costs is relatively high due to high labor costs (including overtime) in Sweden about SEK 120 with additional social security and tax paid as one package of the worker's salaries. The administration cost about the 10% came up as payment for documentation process, storage, and PTI surveys and custom clearance. Material costs (1%), energy costs (3%) and investment costs (1%) are cost items, which are relatively low, compared to other elements. It means that in giving the VAS provided in Malmö port, the costs for material, energy and investment are not a crucial factor due to the fact that the port is not releasing massive products, which need material and energy. Additionally, the VAS given by the port is not fully depending on investment decisions in terms of purchasing new equipment. It can be reflected from the low investment cost for operations (about 1%).
Figure 8. Costs breakdown of VAS in Port of Malmö. Source: Annual Port Report, 2000
1% 3% 10% 13% 1% 28% 43% 0% 1% 0% 5% 10% 15% 20% 25% 30% 35% 40% 45% Mate rial Ener gy Maint enanc e Adm inistr ation Inve stm ent Lab or Tran spor
tation Renta l
Info r/com
m
The information and communication costs about 1% are at a low level due to the fact that in offering information services, the port has cooperated with the Swedish Customs office in documentation. Consequently, the value gained was shared with the customs office. This low percentage shows further that the information/communication cost actually is not expensive in the port of Malmö. It is because a good infostructure system in Sweden, which creates an economical cost in operation.
4.3. PORT OF AARHUS AND ITS VALUE ADDED SERVICES
The port of Aarhus, one of largest harbor in Denmark, has decided to focus on feeder services as their core competence. In terms of container traffic, the port’s website (http://www.aarhushavn.dk/index_uk.htm) reported that in 1999 the port handled about 450,000 containers and 80 percent of those containers are reefers with the perishable goods, especially poultry products exported from the hinterland area around Denmark.
4.3.1. Type of VAS
In the aspect of value added service, the port is providing three kinds of services as their competitive advantage; information system, container services, and cargo controlling. For the information system of the port of Aarhus, the areas of services are:
Electronic Data Interchange (PIC-EDI)
Terminal Operating Management System (TOMaS) Port operating Management System (POMaS)
For the container services, the port is providing:
PTI (Pre Terminal Inspection) checking of containers Maintenance and repair of containers
Maintenance and repair of reefer units
Cleaning and washing of containers
Refurbishing of containers
4.3.2. Added Value of VAS
From the various services offered, it can be stated that the port of Aarhus has been benefited from concentrating on perishable goods as the object of VAS. It is informed (Van Nielsen, 2000) that from various VAS offered they could create 20% of its total value added. In 1999, the stevedoring company handled about 450,000 containers or 4,871,250 tons could create added value about 25.34 US$/ton from which 5.07 US$/ton is resulted from VAS.
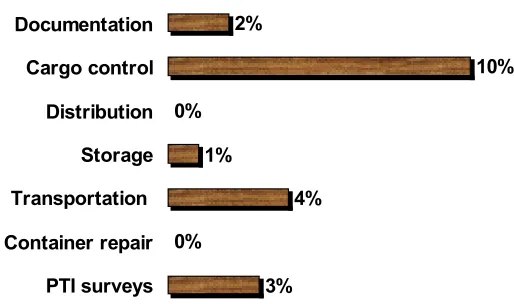
In Aarhus, these profitable services can be grouped into PTI surveys (23%), cargo control (22%) and storage (17%) and transportation (12%) as core services for perishable goods handled (figure 9). It can be estimated that those activities are really the customers' necessity as the services of the PTI survey and cargo control are required as a vetenerary related service to the customers in maintaining the quality of the cargo before being exported.
managed and supervised directly through IT system linking to the port information system. The same mode of operation also for PTI Survey that is performed in the port's warehouse and the checking results then sent to customs office through EDI line.
Figure 9. Aarhus's added value from VAS. Source; Aarhus Stevedoring Company, 2000.
Figure 10. Information part in VAS. Source: Aarhus Stevedoring Company, 2000.
Information service of VAS
3% 0%
4% 1%
0%
10% 2%
PTI surveys Container repair Transportation Storage Distribution Cargo control Documentation
Added Value From VAS
23% 18%
12%
17% 0%
22% 8%
Similar to the documentation service, the port gives their customers information services in transportation and distribution services. In these services, the information is used for booking, invoicing and tracking services. In the storage services, especially for the CFS service (container freight station), the stevedoring company gained about 1 percent of total value related the information services (Figure 10) they give regarding cargo and container tracking services that can be accessed by customers and sent to customers’ agents or transportation service providers to transport the goods further. Compared to other services, it can be stated that this service may be categorized as a complement services employing the information system.
4.3.3. Cost breakdown
In offering the VAS as explained in Figure 11, the port spent an extensive segment for labor (25%), investment (20%) and rental costs (17%), especially for space around the port area followed by information costs (8%).
Figure 11. Cost breakdown for VAS of Aarhus Port
Source; Annual Port Account (2000), Aarhus Stevedoring Company (2000). 5% 8% 6% 4% 20% 25% 7% 17% 8% 0% 5% 10% 15% 20% 25% Mate rial Ener gy Maint enanc e Adm inistr ation Inve stm ent Lab or Tran spor
tation Renta l
Info rmat
In terms of investment costs, the VAS given by the port partly depends on investment decisions in terms of purchasing new equipment, especially for the IT related equipment, either for handling operations and cargo controlling operations for reefer containers
In matters of rental cost for space, it can be stated that this stevedoring company pays the rental fee for land to the port authority (as an owner of the land) as a basic of leased area. Regarding to VAS, it seems that the port included the utilization of land for warehouses mainly as a unit cost calculated in these services (VAS) as some spaces were rented under the management of the stevedoring company.
The 7 % on transportation cost are due to a payment of slots shared for transferring the cargo and containers by block train to or from the port of Aarhus and destinations. The labor cost is relatively high due to high labor costs (including overtime) in Aarhus about DKK 130 with additional social security and tax paid as one package of the worker's salaries.
The administration cost about 4% came up as payment for the documentation process, storage, and PTI surveys and customs clearance. This low percentage resulted from the cooperation of the port and customs authority to facilitate the trade through the port. Material cost (5%), and energy cost (8%) are cost items, which are relatively low, compared to other elements. It means that in giving the VAS provided in Aarhus port, the costs for material and energy are not a crucial factor. Moreover, material and energy is relatively not a considerable operation cost in giving services mainly for reefer containers.
4.4. COMPARED FACTORS AMONG PORTS 4.4.1. Value Added Gained among Comparing Ports
Table 3 shows that all ports have specific profit centers on which they are focusing on as the core service competencies of their ports.
VAS being offered by Lehnkering stevedoring company in the port of Rotterdam, make he terminal get the biggest added value from VAS per ton (11.45 USD) compared to others terminals. It means that in concentrating on a distribution center strategy, the terminal inclusively and the port on large scale has benefited from advanced and various services given to its users, shippers and shipowners. Moreover, it can be stated that the terminal and port have created more activities outside the port traditional areas.
However, Aarhus terminal got the biggest added value per TEU handled (82.29 USD) in providing VAS eventhough the terminal has the lowest percentage of VAS over the total added value gained. It means that, Aarhus terminal is more concentrated on container services rather than physical activities in the CFS or warehousing areas. In addition, those services are mainly offered inside the terminal site.
Table 3. Added value comparison among ports.
Source: Compiled from JICT (2000), Malmö (2000), Lehkenring BV (2000), Aarhus website, www.aarhushvn.dk (2000), Van Nielsen (2000)
In this matter, JICT has gained no value on these VAS services as no value-added services were offered. Although JICT may handle the biggest container quantity compared other ports.
4.4.2. Value added of VAS among ports
In the container repair service it can be noted that the port of Aarhus has got more benefits in this service than other ports. The strategy to concentrate on reefer containers handling and services has resulted a profitable percentage in value on the service of reefer container, if compared to the port of Malmö that also offers the container repair services for all types of container. The Port of Rotterdam has no value on this business. Moreover, the service of this repair supports and gives the port of Aarhus expertise and knowledge in handling and treating the reefer containers.
In the information service, more or less all the ports have gained a similar value in percentage relating to all their service businesses. The stevedoring company in the port of Aarhus has benefited from the sale and the service of the used for handling, repair and survey the container included commodities in it.
The Port of Malmö got value from the services of ships, trucks, rail booking, handling of goods in warehouses and electronic clearing and checking.
Figure 12. VAS Comparison among Ports
The service providers in the port of Rotterdam have used the informal service for customs clearance and truck or container tracking in the transport chain. The port of Malmö is the most benefited port, which got the documentation fee per ton, handled it compared with the other two. This is due to the customs clearing service offered by the port compared to the other ports that can not provide it.
The port of Aarhus in the PTI Survey has taken much advantage of providing this service and followed by the port of Malmö. Even this service gives the biggest value for the port of Aarhus, however, generally it can be noted that the port of Rotterdam got no value on it. For the Port of Aarhus this value resulted from the inspection service of perishable goods especially exported pork.
0% 10% 20% 30% 40% 50%
Transportation Storage Distribution Cargo control Draught Surveys PTI Surveys Documentation Information Container repair
VAS Between Comparing Ports
Aarhus
Malmö
In the Draught Survey service, the Port of Rotterdam is the only port that gets as much value on it. This service reflects that the port of Rotterdam handles a lot of chemical commodities transferred by special containers. This is a typical service that can be offered for the chemical commodities.
In the Cargo control, the Figure 12 shows that the Port of Rotterdam is the most benefited port as it gains more value in percentage than the port of Malmö and Aarhus. It means that the port has a big part involved in storing products, in the warehouse. It relates much to the distribution service that the port of Rotterdam offered. It can be noted that the distribution service has given a big percentage to the port of Rotterdam compared to the port of Malmö, while the port of Aarhus has no value gained on it, due to any service given for it. For the Port of Malmö, the distribution service is also a significant service for them as a part of the door to door service the port gains the distribution activities as their profit source. However, from the storage service, it shows that in percentage the Port of Malmö is the most benefited port compared to the other two. This is due to the direct control management of storing services. For the ports of Malmö and Aarhus, the storage for inside and outside the port (while the port of Aarhus only provides the inside the port) is under full control of Management of stevedoring Company. But for the Port of Rotterdam, the storage value is shared with other subsidiary companies correlated with the service providers.
with the other haulage service companies. But in practical terms, they shared slots and frequencies of services with their partners.
4.4.3. Cost Comparison between Comparing Ports
In this comparison from Figure 13, it can be confirmed that all ports indicated the particular cost centers as a result of their typical services competence.
On information and communication, the port of Rotterdam has used a bigger portion of costs on this, due to more controlling and tracking services on cargo. The budgeting on this argues that all ports have spent in some percentages to offer their value-added services.
On the rental cost, the port of Rotterdam have spent the biggest amount on this item, due to the space rental fee that the service providers use for storing and distributing the goods more in the Port of Rotterdam than other ports.
On the transportation cost, it can be stated that the port of Malmö has spent the biggest cost in percentage compared to the other ports. This is due to fact the port role as customer agent of customer that arranges the customer’s needs. The port does not invest neither involve in a share business with other companies in giving these services.
The service providers in the ports of Rotterdam and Aarhus spend less percentage compared to Malmö due to facility or slot sharing they have had with rail or truck service companies.
security and pension guarantee and labor union fee for the workers in those two ports are higher than in Rotterdam. The high labor cost in those three ports resulted from labor regulations and the strong labor union bargaining position in Europe.
On investment side, it is reported that the Port of Aarhus has spent bigger costs compared to the ports of Malmö and Rotterdam. This is due to computer system and container repair facilities. Moreover, it was found that the port of Malmö had used less percentage relativity compared to the others. It means that the port did not invest much on equipment and facilities in their services.
On the Administration side, JICT has spent these items in comparison to the others, due to the fact that the customs activities are more concerned with items related to their service. This is the opposite in Rotterdam Port, which has the lowest administration cost among the ports. It can be stated that the container procedures in Rotterdam port are the simplest one compared to others.
On the maintenance side, all ports have similar percentage on maintenance activities. Even it is shown that the port of Malmö has spent slightly larger amounts than the others.
Figure 13. Comparison of Costs breakdown among ports
In conclusion, in respect of expanding the service pattern regarding horizontal, vertical and global terms, the service providers in the ports of Rotterdam, Malmö and Aarhus have their competence service on which they indicate a specific percentage on value added and operation costs.
The port of Rotterdam has decided to be a distribution center in Europe with chemical and agricultural based products as their competency traffics. Moreover, they provided various value added services in terms of horizontal, vertical and global forms. In these various services, the port got the biggest value on transportation services followed by distribution, storage, cargo control and information services. In doing their strategy, the port had to allocate the operation cost on rental cost followed by labor, investment, transportation, energy, info/communication and material costs.
The port of Malmö has determined to concentrate on a logistic service center for paper products in the Baltic and Scandinavian regions. Services they provide can be
Cost Breakdown
0% 10% 20% 30% 40% 50%
Material Maintenance Investment Transportation Infor/Comm
Aarhus
categorized in horizontal and vertical forms. In this competence service the port has benefited from the biggest value from transportation service followed by documentation, storage, information, distribution, PTI surveys and container repairs. In doing their strategy, the port had to allocate the operation costs much on transportation cost followed by labor, administration, maintenance, energy, material, investment and information/communication costs.
The port of Aarhus has concentrated their service on reefer containers through the information service due to the large percentage of perishable goods handled in the port. For this objective, the various services they provide can be categorized generally in horizontal terms. With this competence service, the port has benefited from information services given the biggest added value followed by PTI surveys, reefer container repair, storage, cargo control, and transportation. In doing their strategy, the port had to allocate the operation costs on labor costs followed by investment, rental, information/communication, transportation, maintenance, energy, and administration costs.
JICT is a specific case as it needs to develop new services instead of existing handling services. Although, the terminal could handle containers more compared to other ports, the value gained per ton handled resulted a low level.
Chapter 5
ANALYSIS OF POSSIBLE VALUE ADDED SERVICES IN JICT
In offering the value-added services, JITC can probably get profit by setting its core competencies in the port circumstances. This starting point has to be considered, as JITC will never be able to be competitive in all the different traffic categories and services vis-à-vis rivals. Then a question arises on which traffic and services categorizing the set of core competencies should be focused on. After that, the next step is to determine the detailed services in term of horizontal, vertical and global patterns and impacts of these services in terms of value added, labor, investment, and the possibility to establish these services.
5.1. TRAFFIC TREND
The traffic commodity report in 1995 (see appendix B) both for export and import traffic informing a substantial market share of the terminal in agricultural products. These agricultural products in the period 1995 to 1998, when Pelindo II managed the terminal, showed a considerable growth.
In 1999, when JICT started, the agricultural products were the most significant commodity handled. On the import side, the agricultural products handled were cotton, frozen fruit, frozen meat and rubber which made up about 12% of the total commodity. On the export side, agricultural products were profitable commodities handled by the terminal compared to manufactured products and chemical products. Agricultural products consisted of perishable goods and agribusiness products dominated the export traffic which about 52%. From those trends, it can be stated that agricultural products are less affected by the economic crisis. Even for the export part, it showed increasing trends. Externally, the trend of the increasing trade of JITC’s agricultural market can be supported by a similar trend in the national agricultural product growth that was reported about 10%-15% per year since 1998 (Dillon, 1999). This sector has contributed about 6,7% of GDP in 1999 (Indonesia Central Statistic Bureau, 2000) and with the growth of 10%-15%; therefore agricultural products are predicted to be Indonesia’s second primary commodity after oil and gas in terms of GDP in 2005 [Saragih, 1999].
Furthermore, as its contribution to the total containers moved trough JITC, agricultural products have given some substantial value added to the JITC compared to other groups of commodities. In the future, it can be predicted that the JITC market share on the agricultural commodities will increase due to the factors below: 10–15% agricultural trade growth in the future. It will raise the seaborne trade
partially on this commodity.
The increasing of direct call of transshipment ships to Jakarta, which is estimated about 5% of total containers handled since 1999 (JITC, 2000).
The planning of the government and Indonesian Farmer Association to set up 10 agricultural commodity based terminals in Indonesia (Department of Agriculture, March 21, 2000)
5.2. VALUE ADDED SERVICES BASED ON AGRICULTURAL PRODUCT
In order to service the customers on the agricultural based products, JICT should understand and give another opportunity on which this field could be more attractive and efficient by giving services which can simplify the chain on the cost and benefit effectiveness. Through information collected from TNT’s study in 1998, National Export Development Agency’s report (BPEN) in 2000, and an OOCL-Indonesia market study in 1999, the process of agri chain can be mapped generally as explained in appendix F. From those sources can be summarized that the agribusiness industry in Indonesia is not utilizing its resources in technology, commerce, research and best practices to its best advantage. There are three main problems that need to be solved in this chain, i.e. lack of time management, quality, and information.
Time management is a typical problem in the logistics issue of this trade especially for Indonesian exporters. It is informed that a lot of deliveries were not made on time, due to lack of facilities, information, documentation and inspections. On the other hand, the importers consequently may miss sales opportunities on extra costs, lose sales and damage their market relationships. Costs increase for importers and exporters when timing problems are not resolved. The quality of the product exported or imported was found inconsistent through failures to exercise control between the farmers and the buyers and not knowing where and how inconsistencies are occurring. The key areas, in these problems created are as follows:
Poor or absent of Cold Chain Management (CCM) Packing and stowing inefficiencies