Content based Image Retrieval using Clustering
Swapna Borde
Vidyavardhini’s College of Engineering and Technology, Vasai (W)
Udhav Bhosle
, PhD. Rajiv Gandhi Institute of Technology,Andheri (W), Mumbai
ABSTRACT
This paper presents novel techniques for image retrieval using the clustering features extracted from images based on Row Mean Clustering, Column Mean clustering, Row Mean DCT Clustering ,Column Mean DCT Clustering, Row Mean Wavelet Clustering and Column Mean Wavelet Clustering. The proposed techniques are compared with well known traditional technique such as Hierarchical Clustering. Hierarchical clustering starts by calculating the Euclidean distance measure for all patterns in data set, which is not required to calculate in proposed techniques. Hence number of clusters used for comparison of proposed techniques is less as compared to existing technique (Hierarchical Clustering). All the CBIR techniques are implemented on a database having 665 images spread across 31 classes. The results of proposed techniques have shown performance improvement (higher precision and Recall) as compared to existing technique at reduced computations.
Keywords
Content Based Image Retrieval (CBIR), Row Mean Clustering (RMC), Column Mean Clustering (CMC), Row Mean DCT Clustering (RMDC), Column Mean DCT Clustering (CMDC), Row Mean Wavelet Clustering (RMWC) and Column Mean Wavelet Clustering (CMWC) and Hierarchical Clustering (HC).
1. INTRODUCTION
Image Retrieval retrieves relevant images from the image database. Image Retrieval can be divided into two types, text based image retrieval and Content Based Image Retrieval. Text based image retrieval required large amount of labor and it is very difficult to extract the content (color, texture and shape) of the images using the small number of key words. It has been observed that image retrieval based on content such as color, texture and shape is an efficient way of retrieving images form the large image database. This led to the emergence of Content Based Image Retrieval.
The typical CBIR system includes two major tasks. The first task is feature extraction, where a set of features, called feature vector is extracted to represent the content of each image in the database. Set of features is called as image signature and size of the image signature is very small as compared to the original image. The second task is similarity measurement, where a distance between the query image and each image in the database is computed so that top relevant images can be retrieved from the database [1],[2],[3],[4],[5],[11],[12].
The Content Based Image Retrieval has been widely used in computer vision, image processing, information science, database management systems, etc. A wide range of possible applications for CBIR technology has been identified and these are Crime Prevention, Medical Diagnosis and Security check. Recent CBIR systems are used to retrieve images from the large image database based on visual properties such as color, shape and shape.
One of the most important features that make possible the recognition of images by humans is color. Commonly methods for color are color histogram [7], [8], [9], [10], color coherence vector, color correlogram, color moments and color clustering. Cluster analysis divides data into groups such that similar data objects belong to the same cluster and dissimilar data objects to different clusters. From a practical perspective, clustering plays an outstanding role in data mining applications such as information retrieval and text mining. Two statistical operations commonly applied to data are classification and clustering. Clustering is a form of learning by observation and don’t rely on predefined classes whereas classification is a learning by example which means they rely on class labeled training examples.
One of the commonly used techniques of clustering is Hierarchical Clustering. Hierarchical clustering starts by calculating the Euclidean distance measure for all patterns in data set. The two closest patterns are merged to form the new cluster. The result of Hierarchical clustering is usually shown by a dendrogram. This is a bottom up approach in the sense that the clustering starts at the bottom of the dendrogram and works its way until all objects belong to one cluster [6],[13],[14],[15]. The five different approaches which can be used to calculate the distances between two clusters are as follows
1. Single linkage clustering:- distance between two clusters is calculated as the minimum distance between all possible pairs of object. This method is also known as nearest neighbor linkage.
2. Complete linkage clustering:- distance between two clusters is calculated as the maximum distance between all possible pairs of object.
3. Average linkage clustering:- distance between two clusters is calculated as the average of distances between all possible pairs of objects.
cluster pair whose merger minimizes the increase in the total within group error sum of squares.
2. Hierarchical Clustering
Given N vectors, a hierarchical clustering algorithm generates a special tree according to the minimum distance criteria between the set of clusters. This approach is expressed in the following algorithm.
1. Read an Image
2. Obtain Euclidean distance measure (E). Euclidean distance measure is considered as distance matrix.
3. Each element of distance matrix is considered as cluster 4. Repeat step number 5 & 6 until only a single cluster remains.
5. Identify the two similar clusters Ci and Cj and then merge
Ci and Cj into one cluster using ward linkage.
6. Update the Euclidean Distance Matrix E.
3 Row Mean Clustering
Given N vectors, a Row Mean clustering algorithm generates a special tree according to the minimum distance criteria between the set of clusters. This approach is expressed in the following algorithm.
1. Read an Image
[image:2.612.121.260.440.528.2]2. Obtain Row Mean. Row Mean is considered as distance matrix. Figure 1 shows Row Mean of Sample Image
Figure 1: Row Mean of Sample Image
3. Each element of distance matrix is considered as cluster 4. Repeat step number 5 & 6 until only a single cluster remains.
5. Identify the two similar clusters Ci and Cj and then merge
Ci and Cj into one cluster using ward linkage.
6. Update the distance matrix.
4 Column Mean Clustering
Given N vectors, a Column Mean clustering algorithm generates a special tree according to the minimum distance criteria between the set of clusters. This approach is expressed in the following algorithm.
1. Read an Image
2. Obtain Column Mean. Column Mean is considered as distance matrix. Figure 2 shows Column Mean of Sample Image.
Figure 2: Column Mean of Sample Image
3. Each element of distance matrix is considered as cluster 4. Repeat step number 5 & 6 until only a single cluster remains.
5. Identify the two similar clusters Ci and Cj and then merge
Ci and Cj into one cluster using ward linkage
6. Update the distance matrix.
5. Row Mean DCT Clustering
Given N vectors, a Row Mean DCT clustering algorithm generates a special tree according to the minimum distance criteria between the set of clusters. This approach is expressed in the following algorithm.
1. Read an Image 2. Obtain Row Mean.
3. Apply 1-D DCT on each component(R,G and B) of Row Mean.
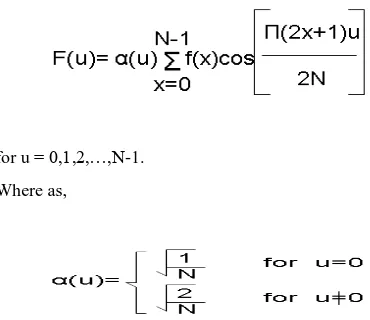
The 1-D DCT is defined as
for u = 0,1,2,…,N-1. Where as,
[image:2.612.328.513.520.680.2]5. Repeat step number 6 & 7 until only a single cluster remains.
6. Identify the two similar clusters Ci and Cj and then merge
Ci and Cj into one cluster using ward linkage
7. Update the distance matrix.
6. Column Mean DCT Clustering
Given N vectors, a Column Mean DCT clustering algorithm generates a special tree according to the minimum distance criteria between the set of clusters. This approach is expressed in the following algorithm.
1. Read an Image 2. Obtain column mean.
3. Apply 1D-DCT on each component of column mean 4. 1D-DCT is considered as distance matrix. Each element
of distance matrix is considered as cluster 5. Repeat step number 6 & 7 until only a single cluster remains.
6. Identify the two similar clusters Ci and Cj and then merge
Ci and Cj into one cluster using ward linkage
7. Update the distance matrix.
7. Row Mean Wavelet Clustering
Given N vectors, a Row Mean Wavelet clustering algorithm generates a special tree according to the minimum distance criteria between the set of clusters. This approach is expressed in the following algorithm.
1. Read an Image 2. Obtain Row Mean
3. Apply 1D wavelet transform on each component of row mean
4. Find Approximation coefficients of R, G and B Component.
5. 1-D Approximation signal is considered as distance matrix. Each element of distance matrix is considered as cluster 6. Repeat step number 7 & 8 until only a single cluster remains.
7. Identify the two similar clusters Ci and Cj and then merge
Ci and Cj into one cluster using ward linkage
8. Update the distance matrix.
8. Column Mean Wavelet Clustering
Given N vectors, a Column Mean wavelet clustering algorithm generates a special tree according to the minimum distance criteria between the set of clusters. This approach is expressed in the following algorithm.
1. Read an Image 2. Obtain column mean
3. Apply 1D wavelet transform on each component of column mean
4. Find Approximation coefficients of R, G and B Component.
5. 1-D Approximation signal is considered as distance matrix. Each element of distance matrix is considered as cluster 6. Repeat step number 7 & 8 until only a single cluster remains.
7. Identify the two similar clusters Ci and Cj and then merge
Ci and Cj into one cluster using ward linkage
8. Update the distance matrix.
9. EXPERIMENTAL RESULTS
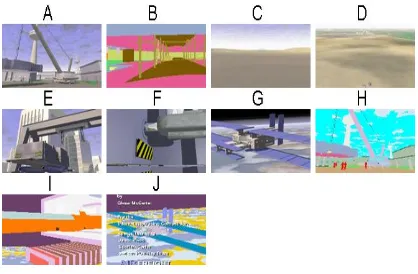
[image:3.612.326.535.312.449.2]For evaluating the performance of the algorithms, Air Freight Image database is used. The image database contains 665 images with 31 different classes. In this paper, results of CBIR techniques are shown only for 10 classes. Some of the sample images which are used as query images are shown in Figure 3.
Figure 3: Samples of Image Database
Similarity Measure(SM) is used to compare the cluster distance of query image with cluster distance of images in the database. The query image was selected from the database and it would be the first image in the result list. Other images in the result list were retrieved based on the similarity to the query image.
Figure 5 (a) to Figure 5 (g) shows the results of Hierarchical Clustering(HC) , Row Mean Clustering (RMC ) , Column Mean Clustering(CMC), Row Mean DCT Clustering (RMDC), Column Mean DCT Clustering (CMDC), Row Mean Wavelet Clustering (RMWC) and Column Mean Wavelet Clustering (CMWC) for the query image shown in Figure 4.
Figure 4: Query Image
Figure 5 (a): Results of Hierarchical Clustering (HC) (Total No. of relevant images retrieved=41, Non- relevant
images retrieved=02)
Figure 5 (b) shows the results of Row Mean Clustering (RMC) (Total No. of relevant images retrieved=42, Non-
relevant images retrieved=01)
Figure 5 (c) shows the results of Column Mean Clustering (CMC) (Total No. of relevant images retrieved=39, Non-
relevant images retrieved=04)
Figure 5 (d) shows the results of Row Mean DCT Clustering (RMDC) (Total No. of relevant images retrieved=39, Non- relevant images retrieved=04)
[image:4.612.80.303.286.449.2] [image:4.612.327.552.513.653.2]Figure 5 (f) shows the results of Row Mean Wavelet Clustering (RMWC) (Total No. of relevant images
retrieved=43, Non- relevant images retrieved=00)
Figure 5 (g) shows the results of Column Mean Wavelet Clustering (CMWC) (Total No. of relevant images
retrieved=39, Non- relevant images retrieved=04)
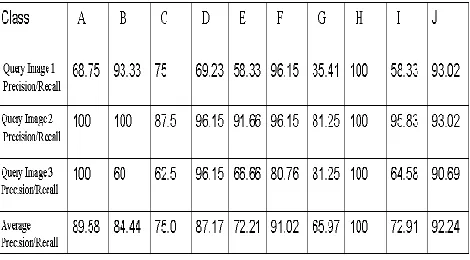
[image:5.612.81.303.72.226.2]Table 1 to Table 7 gives Precision/Recall for 10 classes using Hierarchical Clustering (HC), Row Mean Clustering (RMC), Column Mean Clustering (CMC), Row Mean DCT Clustering (RMDC), Column Mean DCT Clustering (CMDC), Row Mean Wavelet Clustering (RMWC) and Column Mean Wavelet Clustering (CMWC).From each category randomly three images are chosen as query image and for every query image precision and recall values are computed.
Table 1: Average Precision/Recall for 10 classes (A to J) and 3 queries each using Hierarchical Clustering (HC)
From Table 1, it is clear that average Precision and Recall of Hierarchical Clustering varies from 56.41 to 100%
Table 2: Average Precision/Recall for 10 classes (A to J) and 3 queries each using Row Mean Clustering (RMC)
From Table 2 it is clear that, Average Precision and Recall of Row Mean Clustering varies from 84.72 % to 100%.
Table 3: Average Precision/Recall for 10 classes (A to J) and 3 queries each using Column Mean Clustering (CMC)
[image:5.612.81.302.284.448.2] [image:5.612.329.564.543.673.2]Table 4: Average Precision/Recall for 10 classes (A to J) and 3 queries each using Row Mean DCT Clustering
(RMDC)
From Table 4 it is clear that Average Precision and Recall of Row Mean DCT Clustering Varies from 60.41% to 100%.
Table 5: Average Precision/Recall for 10 classes (A to J) and 3 queries each using Column Mean DCT Clustering
(CMDC)
From Table 5 it is clear that Average Precision and Recall of Column Mean DCT Clustering varies from 47.22% to 100%
Table 6: Average Precision/Recall for 10 classes (A to J) and 3 queries each using Row Mean Wavelet Clustering
(RMWC)
From Table 6 it is clear that Average Precision and Recall of Row Mean Wavelet Clustering varies from 83.33% to 100%.
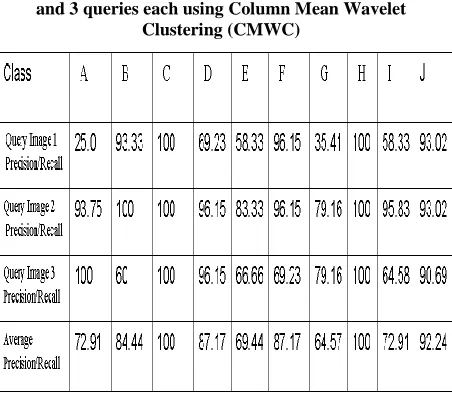
Table 7: Average Precision/Recall for 10 classes (A to J) and 3 queries each using Column Mean Wavelet
Clustering (CMWC)
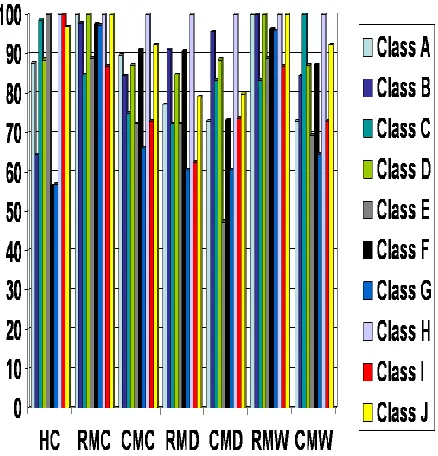
Figure 6: Average Precision/Recall Comparison of various CBIR techniques (x-axis represents Technique and y-axis
represents Average Precision/Recall.)
Table 8 and Table 9 gives Clusters Comparison and Complexity Comparison of CBIR Techniques based on Hierarchical Clustering, Row Mean Clustering, Column Mean Clustering, Row Mean DCT Clustering, Column Mean DCT Clustering, Row Mean Wavelet Clustering and Column Mean Wavelet Clustering.
[image:7.612.326.547.86.273.2]
Table 8: Clusters Comparison of CBIR Techniques
Table 9: Complexity Comparison of CBIR Techniques
10. Conclusion
Hierarchical Clustering is a novel clustering technique which produces a hierarchy of clusters. The result of Hierarchical Clustering is usually shown by a Dendrogram. Hierarchical Clustering starts by calculating the Euclidean distance measure for all patterns in data set. The two closest patterns are merged to form the new cluster. This process is continued until the complete dendrogram is built. There are five different approaches which can be used to calculate the distances between two clusters. In this paper Hierarchical clustering using ward’s distance approach is used for Content Based Image Retrieval. But disadvantage of this method is that number of clusters used for retrieval purpose is very large. Number of clusters is reduced by using Row Mean Clustering, Column Mean Clustering, Row Mean DCT Clustering, Column Mean DCT Clustering, Row Mean Wavelet Clustering and Column Mean Wavelet Clustering. From experimental results, it is clear that Performance of CBIR is improved using Row Mean Clustering and Row Mean Wavelet Clustering considering 80% average precision and Recall as acceptable norms. And complexity of Row Mean Clustering and Row Mean Wavelet Clustering is far less as compared to existing technique (Hierarchical Clustering).
11. References
[1] Guoping Qiu,” Color Image Indexing Using BTC,”IEEE Transactions on Image Processing, VOL.12, NO.1, pp.93-101, January 2003.
[2] B.G.Prasad, K.K. Biswas, and S. K.Gupta,” Region – based image retrieval using integrated color, shape, and location index,” computer vision and image understanding, October 2003.
[3] Minh N. Do, Member, IEEE, and Martin Vetterli, Fellow, IEEE,” Wavelet-Based Texture Retrieva Using Generalized Gaussian Density and Kullback- Leibler Distance,” IEEE Transactions On Image Processing, VOL.11, NO.2, February 2002
[image:7.612.79.296.482.690.2]information “,Master Thesis Report in Media Signal Processing , Department of Applied Physics and Electronics, Umea University, Umea Sweden
[5] Rajashekhara,” Novel Image Retrieval Techniques domain specific approaches,” Ph.D. Thesis Department of Electrical Engineering Indian Institute of Technology – Bombay, 2006.
[6] Mrs Monika Jain, Dr. S.K.Singh ,”A Survey On: Content Based Image Retrieval Systems Using Clustering Techniques For Large Data sets”,International Journal of Managing Information Technology (IJMIT) Vol.3, No.4, November 2011
[7] K. Velmurugan, Lt. Dr. S. Santosh Baboo ,” Image Retrieval Using Harris Corners and Histogram of Oriented Gradients,” International Journal of Computer Applications (0975- 8887)Volume 24, No. 7, June 2011 [8] Junqiu Wang and Hongbin Zha , Roberto Cipolla,”
Combining Interest Points and Edges for Content-based Image Retrieval,” IEEE Journal, June 8,2010.
[9] Neetu Sharma., Paresh Rawat and jaikaran Singh.,” Efficient CBIR Using Color Histogram Processing, ” Signal & Image Processing : An International Journal(SIPIJ) Vol.2, No.1, March 2011.
[10] Minakshi Banerjeea, MalayK.Kundua,b, Pradipta Majia,b ,” Content-based image retrieval Using visually significant point features,”Elsevier , Fuzzy Sets and Systems 160 (2009) 3323–3341
[11] Swapna Borde , Dr. Udhav Bhosle ,” Image Retrieval Using Contourlet Transform,” International Journal of Computer Applications (0975-8887),Volume 34-No.5, November 2011.
[12] Swapna Borde , Dr. Udhav Bhosle ,” Image Retrieval Using Steerable Pyramid,” International Journal of Computer Applications (0975-8887),Volume 38-No.7, January 2012.
[13] Yixin Chen, James Z. Wang, Robert Krovetz,”Content-Based Image Retrieval by Clustering
[14] P. Valarmathie, T. Ravichandran and K. Dinakaran ,” Survey on Clustering Algorithms for Microarray Gene Expression Data”, European Journal of Scientific Research ISSN 1450-216X Vol.69 No.1 (2012), pp.5-20 [15] K. Mumtaz and Dr. K. Duraiswamy , A Novel Density
based improved k-means Clustering Algorithm – Dbkmeans”, International Journal on Computer Science and Engineering ISSN : 0975-3397 213 Vol. 02, No. 02, 2010, 213-218