http://dx.doi.org/10.4236/ce.2014.516174
Usage of Mobile Technologies in Social
Skills Development
Yunus Günindi
Faculty of Education, Aksaray University, Campus-Aksaray, Aksaray, Turkey Email: [email protected]
Received 2 August 2014; revised 18 August 2014; accepted 24 August 2014
Copyright © 2014 by author and Scientific Research Publishing Inc.
This work is licensed under the Creative Commons Attribution International License (CC BY). http://creativecommons.org/licenses/by/4.0/
Abstract
In this study, it has been aimed to reveal that pre-school children’s social adaptation skills can be supported by the application of frame code. The other aim of this study is to create awareness about the possible application areas of mobile learning technologies within the frame code in pre- school education. For this purpose, the study that consists of four experimental and four control group classes coming from similar socio-economic families children in five age groups that con-tinued in kindergarten was carried out. 162 children participated in this study including 81 ap-plications and 81 control groups. “Social Skills Training Program” supported by Frame Code Ap-plication (consisting of 12 acquisitions and 41 indicators) was prepared and during seven weeks, it was administered under the guidance of teachers. In order to evaluate the data before and after implementation, “Social Adaptation and Skills Scale” was used. According to the results of the study, in terms of sub-factors and social adaptation of the scale of “Social Adaptation and Skills Scale”, it was found that there was a significant difference in favor of the experimental group be-tween experimental and control groups after application; however, after the application, social inadaptability sub-factor scores of the children in the experimental group were lower than the scores of control group children.
Keywords
Frame Code, Social Skills, Preschool, Mobile Learning
1. Introduction
In the current century, the rapid development of the technology makes itself felt in every field and this rapid de-velopment affects teaching-learning processes also (Alkan, 1997; Çilenti, 1994; Rıza, 2000; Oktay, 1999; İşman,
access to these products. Technological product was able to enter homes, schools, handbags, pockets and even to public transport.
Although educators and parents consider that in parallel to technological development, children orient to indi-vidual life, the transfer of the technology to the education provides children positive experiences and it also pro-vides improved quality of education. As well as being appropriate for the purposes of the programs that are be-ing executed and applied within the teachbe-ing-learnbe-ing process of the specific programs, it is important to imple-ment the programmes efficiently. After this program faced by individuals, along with the highest level of skills, having the desired behavior change and internalizing them reveal the efficiency of the teaching-learning process. Costing less and spending less time, to support their development by reaching more individuals are within the scope of the definition of being productive. Until a very short period of time from today, computer aided educa-tion was seen as the only technology assisted learning tool whose effect was examined for teaching-learning process especially of the early childhood children. Because of especially tablets and smart phones catering very young age groups, it seems inevitable that alternative technological tools can be entered into education. Among the major advantages of these tools, there are some points like being accessed anytime and anywhere, being up-gradeable in a very short time, being enjoyable and thus being used effectively. Frame code is one of the tech-nologies that provide convenience and that is available in terms of education. Frame codes that take place among the educational technologies (QR Kode-Quick Response Code) applications offer advantages such as saving time and accessibility and efficiency. With the emergence of frame code technology, the usage of it has spread in different disciplines such as automotive industry, health industry. In education, this technology that serves as a bridge between printed materials and interactive online applications, gives the opportunity to access interactive online resources quickly. Integration of multimedia content such as video, audio, animations through the frame code to the printed materials supports the creation of more effective and enjoyable learning resources
(Özdemir, 2010). In the writing of a field, in a limited number of studies, frame code technologies usage studies
were included. The studies are mainly in the nature of thought and consideration and application studies are re-markably lacking. Frame code technology was revealed by a Japanese company in 1994 whose name was Denso
Wave (Aktaş, 2013; Özdemir, 2010). Based on the initials of “Quick Response Code” word, QR code
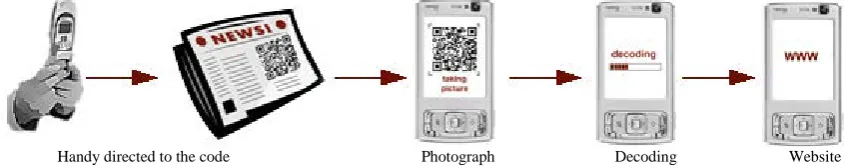
applica-tion was translated into Turkish as “Quick Response Code”. QR code provides access to the encoded content that is presented on a white background and on a number of black dots within seconds. Mobile phones, tablets and other computers’ cameras are scanned via these codes and routed to the content (As showed in Figure 1).
One-dimensional bar codes (Figure 2) from 20 to 40 inter-character data encoding, Square (QR) codes (Figure 3), 7089 characters numerical data (0, 1, 2, 3, 4, 5, 6, 7, 8, 9), 4296 Alpha numeric data (0 - 9, A - Z (uppercase), space, $, %, *, +, -, ., /, :), 2953 bytes of data (ISO 8859-1) and 1817 Kanji/Kana symbols can be encoded and stored.
Contents can easily be converted to frame code. There are so many free online and desktop software applica-tions. Frame code technology that can be easily used at many levels starting from elementary school and educa-
[image:2.595.102.526.521.605.2]Handy directed to the code Photograph Decoding Website
Figure 1. QR Code Scanning and Reading (Hegen 2007).
Figure 3. Two-dimensional code (Frame code).
tion has also effective specialities for the students who are illiterate. InFigure 4, there is a frame code provision of a text.
A written code’s taking place in a frame code does not make any sense for pre-school children. Instead, the content to be given animation, video etc. are converted to multimedia material and moved to a web environment. Then, web links are added through frame code and an opportunity to access this content is provided. This kind of applications develops social skills of students and provides important contributions (As showed inFigure 5).
Social skills, interpersonal relationships and social situations, positive social consequences, are identified and learned (Sorias, 1986: p. 24-29; Rutherford, 2001: p. 7). According to Mathur and Rutherford (1996), social skill is to avoid improper behavior in social situations and in the community to be able to exhibit acceptable behavior (as cited in Johns, Crowlev, & Guetzloe, 2005: p. 2). Social skills of individuals to fulfill their roles given by so-ciety to be demonstrated include behaviors (McFall 1982: p. 3, Gresham & Reschly, 1987: p. 108-117; Staub &
Hunt, 1993: p. 103-115). At the same time, encountering problems in their social environment, initiating and
maintaining positive interactions with others, which are necessary for them to exhibit specific behaviors are also included (Ladd & Mize, 1983: p. 90; Walker ve diğerleri, 1988: p. 79; Westwood, 1993: p. 89; Önder, 2003: p. 113).
Purpose of this study: it has been aimed to reveal that pre-school children’s social adaptation skills can be supported by the application of frame code. The other aim of this study is to create awareness about the possible application areas of mobile learning technologies within the frame code in pre-school education.
2. Methodology
Research skills for social adaptation in the application code supported by the frame of social adaptation skills training program applied to five age group children, the training program impacts on children’s social adjust-ment skills were examined. For this purpose, experiadjust-mental and control groups before and after training which requires the measurement and pretest-posttest control group model was used (Karasar, 2000: p. 34). The depen-dent variable in the pattern five years of age who attend kindergarten children’s “Social Skills Development”; effect on the development of children’s social adaptation skills examined argument is “Social Skills Training Program supported by Frame Code Application”.
The study that consists of four experimental and four control group class coming from similar socio-economic families children in five age groups that continue in kindergarten was carried out. 162 children participated in this study including 81 applications and 81 control groups. “Social Skills Training Program supported by Frame Code Application” (consisting of 12 acquisitions and 41 indicators) was prepared and during seven weeks, it was administered under the guidance of teachers. During the study, students carried out the frame code applica-tion with their tablets. Any experimental method was applied to the kids in the control group.
In the research, in order to evaluate the social adaptation and skills of the children, “social adaptation and skills scale” which was developed by Kandır (2004) and Işık (2007) and later given final shape after Işık’s relia-bility and validity study under the supervision of Kandır was utilized. “Social adaptation and skills scale” was created by dividing into to factor as social adaptation and social inadaptability. “Social adaptation and skills scale” consists of 17 statements related to social adaptation in sub-factor 1 and eight statements related to social inadaptability in sub-factor 2.
It is seen inTable 1 that “Social adaptation and skills scale” for KMO (Kaiser-Mayer-Olkin) value is 0.88 and Bartlett value is 2930.99, p = 0.000 < 0.05. The fact that MKO value is almost perfect with the value of 0.88 and that Bartlett value is high show that the factor analysis is applicable to the scale and there is correlation be-tween the statements. “Social adaptation and skills scale” basic component analysis is given inTable 2.
The data matrix form of the written text is included in the right side. In this section, web address, contact numbers and text can be included.
Figure 4. A model of text content.
[image:4.595.129.478.360.405.2]Figure 5. Animation content model (access from Youtube).
Table 1. Social adaptation and skills scale results for KMO sample measurement and Bartlett’s test.
KMO sample Value SD p
Measurement value sufficiency 0.88 - -
Approximate chi-square value of Bartlett’s test 2930.993 210 0.000
adaptation and skills of children is cantered of two sub-factors.
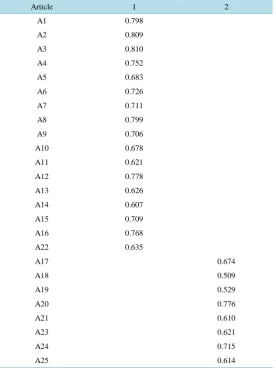
Seventeen of the scale statements are loaded on factor 1. The statements in sub-factor 1 with the highest load values are “success of communication with friends”, “willingness to help the people around when necessary” and “attempt to understand the other by empathy”. The said statements were analysed and the depicted beha-viours were found to state the presence of “Social Adaptation and Skill”. Therefore, Factor 1 was attributed to social adaptation.
Eight (17, 18, 19, 20, 21, 23, 24, and 25) of the statements in the scale were put under factor 2. Among these, “complaining about his life” and “fighting with friends” are the statements with the highest load value. The de-fined behaviours were takes as criteria for social inadaptability and factor 2 was agreed to evaluate social in-adaptability. The scale was applied to children between the ages of 4 and 11, by gathering information from their parents and teachers. The directions in the scale are selected according to the suitability of the answers, such as “Always”, “Sometimes”, and “Never”. In the grading of the scale, the value of 1 was given to the an-swer “Never”; 2 for the anan-swer “Sometimes”, and 3 for the anan-swer “Always”. As the statements of sub-factor 2 were signs of inadaptability, reverse coding was applied for these statements.
In relation to the reliability and validity of the scale, Cronbach Alpha coefficient, one of the calculated single- use reliability coefficients for social adaptation sub-factor, is 0.93 and Spearman Brown two halves test coeffi-cient is 0.84. It is seen that the reliability coefficoeffi-cients for the social adaptation skills of the “social adaptation and skills scale” are close to each other. Therefore, it can be stated that the inner reliability of the scale for social adaptation skills is quite high.
Cronbach Alpha coefficient, one of the calculated single-use reliability coefficients for social inadaptability sub-factor, is 0.83 and Spearman Brown two halves test coefficient is 0.85. It is seen that the reliability coeffi-cients for the social inadaptability skills of the “social adaptation and skills scale” are close to each other. There- fore, it can be stated that the inner reliability of the scale for social inadaptability skills is quite high.
Table 2. Social adaptation and skills scale basic component analysis result.
Article 1 2
A1 0.798
A2 0.809
A3 0.810
A4 0.752
A5 0.683
A6 0.726
A7 0.711
A8 0.799
A9 0.706
A10 0.678
A11 0.621
A12 0.778
A13 0.626
A14 0.607
A15 0.709
A16 0.768
A22 0.635
A17 0.674
A18 0.509
A19 0.529
A20 0.776
A21 0.610
A23 0.621
A24 0.715
A25 0.614
scale. For this purpose, the scale was applied to mothers of 547 children total, who were attending the kinder-gartens of 10 central primary schools. In order to apply the scale, mothers were informed about how to fill the scale and they were asked to answer the scale in relation to their children. After the conduction of the reliability study, the reliability coefficient of the scale was calculated as (α) 0.79.
Statistical analysis of the data obtained in the study was performed using SPSS 15.0 software. In this study, pretest-posttest for related samples T-test for comparison; pretest and posttest for the comparison of the experi-mental and control groups for the independent samples T-test were used. The significance level for all statistics was chosen as “0.05”.
3. Results
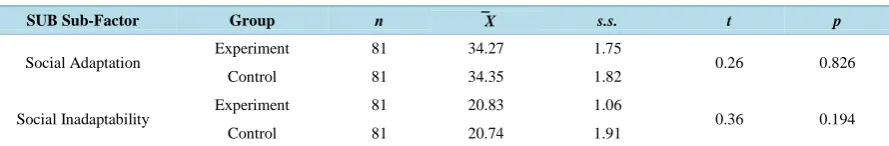
Attending pre-school institutions for children in five age groups “Social Adaptation and Skills Scale”, social adaptation and social inadaptability sub-factors that are taken from the findings related to pre-test scores are given inTable 3.
According toTable 3, when analysed the pre-test results of social adaptation and skills scale of social adapta-tion sub-factor; the average scores in the experimental group of children as X = 34.27 and the mean score was 80.73, the mean scores of the children in the control group are observed and the result is that X = 34.35.
Table 3.T-test results according to sub-factor scores of SUBÖ of the children participated in experimental and control group.
SUB Sub-Factor Group n X s.s. t p
Social Adaptation Experiment 81 34.27 1.75 0.26 0.826
Control 81 34.35 1.82
Social Inadaptability Experiment 81 20.83 1.06 0.36 0.194
Control 81 20.74 1.91
*p < 0.05.
nificant difference between the experimental and control groups (p > 0.05). In the same way in terms of social inadaptability pre-test scores of the experimental and control groups are not considered as a significant differ-ence (p > 0.05).
As seen inTable 4, the post-test average results of children in experimental group for social adaptation and skills scale of social adaptation sub factor is X = 48.59, and the average test results of the control group is X
= 37.42.
According to the post-test scores of children in the experimental group for social adaptation and skills scale of social inadaptability, the average result is calculated as X = 10.00, and the average result of children in the control group is calculated as X = 17.53.
As seen inTable 4, according to sub-factors, in terms of social adaptation between the experimental and con-trol groups in favor of the experimental group after the application is seen that a significant difference (p < 0.05). However, children in the experimental group after the application of social inadaptability sub-factor scores, scores of children from the control group were found to be significantly lower (p < 0.05).
As seen inTable 5, the pre-test average results of children in experimental group for social adaptation and skills scale of social adaptation sub factor is X = 34.27, and the average post-test results is X = 48.59
The average pre-test result is calculated for social adaptation sub-factor as X = 20.83, and the average post-test result is calculated as X= 10.00.
As seen in Table 5, social adaptation of children in the experimental group after the application sub-factor scores significantly increased (p < 0.05), social inadaptability sub-factor scores are significantly decreased p < 0.05).
As seen inTable 6, the average pre-test result of children in the control group for social adaptation and skills scale of social adaptation sub-factor is X = 34.35, and the average post-test result is X = 37.42.
The average pre-test result for social adaptation and skills scale of social inadaptability is calculated as X = 20.74 and the average pos-test result is calculated X = 17.53.
As seen inTable 6, after practise, the score of children in the control group for social adaptability sub-factor significantly increased (p < 0.05), the average score for social inadaptability is significantly decreased (p < 0.05).
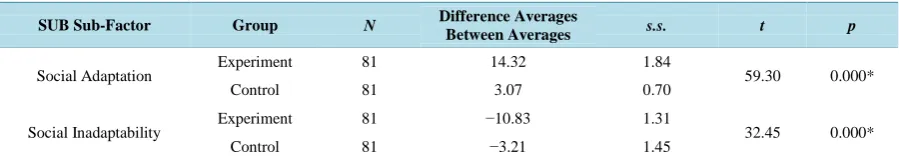
WhenTable 7 is analysed, it is seen that the increase for average result of children in the experimental group for social adaptation is X2−X1 14.32= , and the increase for children in the control group is X2−X1=3.07. It’s seen that the test results of children in the experimental group for social adaptation sub-factor are better, ac-cording to the difference between in pre-test and post-test, results of children are higher when it’s compared to the results of children in the control group.
Similarly in the experimental group children’s social inadaptability skills scale the average result is decreased in the amount of X2−X1= −10.83, the control group of children in the average result is decreased in the amount of the X2−X1= −3.21 and experimental groups of children in the social inadaptability lower factor, the difference between pre-test and post-test mean score of the control group children according to their scores were found to show a greater reduction. Social adaptation as a result of the implementation of skills training programs; social adaptation and ability to scale social adaptation of the sub-factors in the pre-test and post-test mean score differences of the increase in (p < 0.05) and social inadaptability subscales in the pre-test and post- test mean score differences for the decline (p < 0.05) of the experimental group found in favor were found.
4. Discussion
Table 4. T-test results according to sub-factor scores of SUBÖ of the children participated in experimental and control group according to the recent tests.
SUB Sub-Factor Group N X s.s. t p
Social Adaptation Experiment 81 48.59 0.77 65.37 0.000*
Control 81 37.42 1.33
Social Inadaptability Experiment 81 10.00 0.59 45.16 0.000*
Control 81 17.53 1.38
*
[image:7.595.88.538.233.320.2]p < 0.05.
Table 5. T-test results according to sub-factor scores of SUBÖ of the children participated in experimental and control group according to the pre and recent tests.
SUB Sub-Factor Experiment Group
Application N X s.s. t p
Social Adaptation Pre-test 81 34.27 1.75 69.94 0.000*
Final test 81 48.59 0.77
Social Inadaptability Pre test 81 20.83 1.06 74.31 0.000*
Final test 81 10.00 0.59
*
p < 0.05.
Table 6. T-test results according to sub-factor scores of SUBÖ of the children participated in experimental and control group according to the pre and recent tests.
SUB Sub-Factor Control Group
Application N X s.s. t p
Social Adaptation Pre-test 81 34.35 1.82 39.35 0.000*
Final test 81 37.42 1.33
Social Inadaptability Pre test 81 20.74 1.91 16.97 0.000*
Final test 81 17.53 1.38
*
p < 0.05.
Table 7. The average T-test results according to sub-factor scores of SUBÖ of the children participated in experimental and control group according to the pre and recent tests.
SUB Sub-Factor Group N Difference Averages
Between Averages s.s. t p
Social Adaptation Experiment 81 14.32 1.84 59.30 0.000*
Control 81 3.07 0.70
Social Inadaptability Experiment 81 −10.83 1.31 32.45 0.000*
Control 81 −3.21 1.45
*
p < 0.05.
[image:7.595.92.536.369.456.2] [image:7.595.89.539.505.585.2]experi-mental and control groups after application, however, after the application, social inadaptability sub-factor scores of the children in the experimental group were lower than the scores of control group children. In order to evaluate the data before and after implementation, “SASS” was used. In the results of the study, in terms of sub- factors in terms of “SASS” of “SAS”, it was found that there was a significant difference in favor of the experi-mental group between experiexperi-mental and control groups after application, however, after the application, social inadaptability sub-factor scores of the children in the experimental group were lower than the scores of control group children. For this purpose, experimental and control groups before and after training which requires the measurement and pretest-posttest control group model was used (Karasar, 2000: p. 34). The dependent variable in the pattern five years of age who attend kindergarten children’s “Social Skills Development”; effect on the development of children’s social adaptation skills examined argument is “Social Skills Training Program sup-ported by Frame Code Application”.
According to the results of the study, in terms of sub-factors in terms of social adaptation of the scale of “SAS”, it was found that there was a significant difference in favor of the experimental group between experi-mental and control groups after application, however, after the application, social inadaptability sub-factor scores of the children in the experimental group were lower than the scores of control group children. In terms of sub-factors of SASS, when the cases are evaluated before and after the application, it was found that social inadaptability sub-factor scores of the children in the experimental group and control group were higher. Simi-larly, it was identified that social inadaptability scores also had significantly lower scores. In order to determine the effectiveness of social skills training supported by frame codes, the relation between the increase in the so-cial adaptation of children in the experimental group received an average score of factor and the increase in the average scores of the children in the control group were examined. As a result of the analysis, in social adapta-tion sub-factor of the children in the experimental group, the scores were higher than the scores of the children in control group according to the average difference between pre-test and post-test scores. Similarly, children in the experimental group received social inadaptability factor of the amount of the reduction in the average score in the control group when compared to the amount of the reduction in the average scores of children and there were a great reduction in scores.
In this context, frame code-aided social adaptation as a result of the implementation of skills training pro-grams; skills scale factor of social adaptation in the lower increase in pre-test and post-test mean score differ-ences and social inadaptability in sub-factors decrease in pre-and post-test mean score differdiffer-ences in favor of the experimental group and they were found to be significant.
5. Conclusion
e-Transformation, that is supported by the Ministry of Transport and executed under the Ministry of Education in Turkey (MEB), information and communication technologies is intended to be one of the main tools of the educational process with “Opportunities Auction and Technology Improvement Act Project (FATIH)”.
FATİH Project aims to provide LCD Panel Interactive Whiteboard and internet network infrastructure to the classrooms in every school that are in the preschool, elementary and secondary level for effective use in lessons that will be more appealing to the senses in the teaching-learning process of Information Technology (IT) in or-der to ensure the equality of opportunity in education and training and to improve technology at schools. At the same time, it plans to give tablet computers to every teacher and student/child. IT equipment to be installed in classrooms will provide effective usage during learning-teaching process and in-service trainings will be pro-vided to teachers.
In order to complete these processes, provision of hardware and software infrastructure, and the provision of educational e-content management, effective use of IT in the curriculum, teachers’ in-service training, self- conscious, secure, manageable and measurable use of IT constitute the main components of the project. The project is currently in the pilot implementation phase and the studies at the level of pre-school education have not been completed yet, so this study shows that “Opportunities Auction and Technology Improvement Act (FATIH) Project” can be applied to pre-school children and it has a positive direction also which is supported by the Ministry of Transport and executed by the Ministry of National Education which is in a planner position of Turkish Education System.
attention of teachers, researchers and education planners to frame code supported education programs.
References
Aktaş, C. (2013). Eksel Gazetenin, Çevrimiçi Gazete İle Artan Rekabet Potansiyeli Üzerine Bir Tartışma. Selçuk Üniversitesi İletişim Fakültesi Akademik Dergisi, 7.
Alkan, C. (1997). Eğitim Teknolojisi. Ani Yayincilik, Ankara.
Çilenti, K. (1994). Eğitim Teknolojisi ve Öğretim. Kadioğlu Matbaasi, Ankara.
Gresham, F. M., & Reschly, D. J. (1987). Dimensions Of Social Competence: Method Factors in the Assessment of Adaptive Behavior, Social Skills and Peer Acceptance. Journal of School Psycholog, 25, 108-117.
http://dx.doi.org/10.1016/0022-4405(87)90038-0
Hegen, M. (2007). Prozess des Taggens. http://mobile-tagging.blogspot.com
İşman, A. (2001). Teknolojinin Felsefi Temelleri. Sakarya Üniversitesi Eğitim Fakültesi Dergisi, S.1 (Nisan-Mayıs-Haziran), Sakarya.
Johns, B. H., Crowley, E. P., & Guetzloe, E. (2005). The Central Role of Teaching Social Skills. Focus on Exceptional Children, 37, 1-8.
Karasar, N. (2000). Bilimsel Araştırma Yöntemi-Kavramlar, İlkeler, Teknikler. 10. Baski. Nobel Yayınevi, Ankara. Ladd, G. W., & Mize, J. (1983). A Cognitive-Social Learning Model of Social Skill Training. Psychological Review, 90,
127-157. http://dx.doi.org/10.1037/0033-295X.90.2.127
McFall, M. R. (1982). A Review and Reformulation of the Concept of Social Skills. Behavioral Assesment, 4, 1-33.
Oktay, A. (1999). Yaşamın Sihirli Yılları: Okulöncesi Dönem. İstanbul: Epsilon Yayınları.
Önder, A. (2003). Okul Öncesi Çocukları İçin Eğitici Drama Uygulamaları.İstanbul: Morpa Yayınları.
Özdemir, S. (2010). Supporting Printed Books with Multimedia: A New Way to Use Mobile Technology for Learning. Bri- tish Journal of Educational Technology, 41, E135-E138.http://dx.doi.org/10.1111/j.1467-8535.2010.01071.x
Rıza, E. T. (2000). Eğitim Teknolojisi Uygulamaları ve Materyal Geliştirme, Anadolu Matbaası, İzmir.
Rutherford, R. B. (2001) Teaching Social Skills to At-Risk and Special Needss Students: A Positive Instructional Aprroach. Antalya: International Conferance on Special Education and Collaboration.
Staub, D., & Hunt, P. (1993). The Effects of Social Interaction Training on High School Peer Tutors of Schoolmates with Severe Disabilities. Cambridge: Exceptional Children.
Sorias, O. (1986). Sosyal Beceriler ve Değerlendirme Yöntemleri. Psikoloji Dergisi, 5, 24-29.
Walker, H. M., Mcconel, S., Holmes, D., Todis, B., Walker, J., & Golden, N. (1988). The Walker Social Skills Curriculum. The Accept Program. Austin, TX: Pro-Ed.