Extended Income Inequality and Poverty
Dynamics of Labour Market and
Household Activities A Ten Years
Microanalysis with the German
Socio-Economic Panel
Merz, Joachim and Kirsten, Dagmar
Forschungsinstitut Freie Berufe (FFB)
August 1998
Online at
https://mpra.ub.uni-muenchen.de/7012/
FFB
Forschungsinstitut
Freie Berufe
Fakultät II - Wirtschaft und Gesellschaft
Postanschrift:
Forschungsinstitut Freie Berufe Postfach 2440
21314 Lüneburg
[email protected] http://ffb.uni-lueneburg.de Tel: +49 4131 677-2051 Fax: +49 4131 677-2059
Universität
L Ü N E B U R G
Extended Income Inequality and Poverty
Dynamics of Labour Market and Household
Activities A Ten Years Microanalysis with the
German Socio-Economic Panel
Joachim Merz and Dagmar Kirsten
Extended Income Inequality and Poverty
Dynamics of Labour Market and Household
Activities – A Ten Years Microanalysis with the
German Socio-Economic Panel
Joachim Merz and Dagmar Kirsten
Discussion Paper No. 25
August 1998
ISSN 0942-2595
Prof. Dr. Joachim Merz, University of Lüneburg, Department of Economic and Social
Sciences, Research Institute on Professions (FFB), Chair 'Statistics and Professions', Campus
Scharnhorststr. 1, 21335 Lüneburg, Germany, T: 04131/78-2051, F: 04131/78-2059, e-mail:
[email protected],
http://www.uni-lueneburg.de/fb2/ffb
Market and Household Activities – A Ten Years Microanalysis with
the German Socio-Economic Panel
Joachim Merz and Dagmar Kirsten
FFB-Discussion Paper No. 25, August 1998, ISSN 0942-2595
Summary
Labour market dynamics according the individual working hour tension (preferred working
hours minus actual working hours) of active people with focus on the self-employed, as
professions and entrepreneurs, and employees are investigated in our study. The individual
longitudinal analysis based on panel data allows us to follow the individual process of working
time preferences and actual outcomes in its individual convergence/divergence balancing
process in the course of time. Our microanalytic and paneleconometric results (with pooled,
one and two factor fixed and random effects models) quantify the working hour tension
developments and its determinants in a decade from the mid 80s to the mid 90s. Microdata
base is the German Socio-Economic Panel with ten waves from 1985 to 1994. Finally, we
discuss impacts of our results for labour market strategies and a targeted economic and social
policy.
Keywords:
Labour market dynamics, working hour tension, desired and actual working
hours, paneleconometric analyses, professions, entrepreneurs and employees
Zusammenfassung
Die Arbeitsmarktdynamik hinsichtlich der individuellen Arbeitszeit-(An)Spannung
(Arbeitszeitwunsch minus Arbeitszeitwirklichkeit) der Erwerbstätigen mit Fokus auf die
Selbständigen, als Freie Berufe und Unternehmer, sowie die abhängig Beschäftigten ist das
Thema unserer Studie. Die individuelle Längsschnittanalyse auf der Basis von Paneldaten
erlaubt es uns, die individuelle Entwicklung zwischen gewünschter und tatsächlicher Arbeitszeit
in ihrem Konvergenz/Divergenzprozeß im Wandel der Zeit zu verfolgen. Unsere
mikroanalytischen und panelökonometrischen Resultate (mit pooled, ein und zwei Faktor fixed
und random Effektmodellen) quantifizieren die Entwicklung und ihre Determinanten in der
Dekade von Mitte der 80er bis Mitte der 90er Jahre. Mikrodatenbasis ist das
Sozio-ökonomische Panel mit zehn Wellen von 1985 bis 1994. Abschließend diskutieren wir
Folgerungen unserer Ergebnisse für Arbeitsmarktstrategien und eine zielgerichtete Wirtschafts-
und Sozialpolitik.
Schlagwörter:
Arbeitsmarktdynamik, Arbeitsmarkt(an)spannung, gewünschte und
tatsächliche Arbeitszeit, panelökonometrische Analysen, Freie Berufe, Unternehmer und
abhängig Beschäftigte
Extended Income Inequality and Poverty Dynamics of Labour
Market and Household Activities – A Ten Years Microanalysis with
the German Socio-Economic Panel
Joachim Merz and Dagmar Kirsten
1
Introduction: Individual welfare dynamics of paid
and
unpaid work
1
2
Incorporating household/family structures – The equivalence scales
approach
2
2.1
Household sociodemographics and equivalence scales
2
2.2
In search for a proper empirical range of equivalence scales
3
3
Valueing concepts of unpaid work
4
3.1
Replacement cost measures: Generalist and expert costs
4
3.2
Self-evaluation
6
4
Extended income concept – Personal equivalent household extended
net income
6
5
Microdata base: The German Socio-Economic Panel
7
5.1
General characteristics
7
5.2
Market and non-market work questionnaire: Household income and time
use questions
8
6
Results I: Valueing unpaid work – Replacement cost measures and
self-evaluation 1985 and 1994
10
6.1
Replacement costs measures 1985 and 1994
10
6.2
Self-evaluation results 1985 and 1994
10
7
Results II: Extended income dynamics - Cross sectional
distributional evidence after a decade (1985-1994)
13
7.1
Unpaid work – Time use and income results results 1985 and 1994
13
7.2
Changing distributions of extended incomes: Inequality and poverty 1985
and 1994
16
8
Results III: Individual longitudinal changes in market and
non-market inequality and poverty: A panelanalysis with ten GSOEP
waves 1985 to 1994
21
8.1
The longitudinal microdata set
21
8.2
Individual welfare dynamics in inequality and poverty of market and
entrepreneurs and employees
28
10
Concluding remarks
30
References
32
Appendix
34
FFB-Publications
40
Extended Income Inequality and Poverty Dynamics of Labour Market
and Household Activities – A Ten Years Microanalysis with the
German Socio-Economic Panel
Joachim Merz and Dagmar Kirsten
1
Introduction: Individual income dynamics of market and
non-market work
The ancient wisdom about the world as phrased by Heraklit’s ‚panta rhei‘ (‚everything
is changing‘) has become an evident actuality concerning economic patterns within the
80s and 90s at the end of our century. In particular, traditional labour market patterns
are rapidly changing; an increased labour market flexibility and a growing number of
unemployed have shed their light on the entire household ressource situation even in so
called modern societies. Thus, it is a demanding question if those changing market
conditions could be balanced to a certain extent by further household ressources of
unpaid work. Or even more far reaching, have these market developments such an
important impact on the individual income distribution without being able to be
balanced by further household ressources? In addition, the shadow or unrecorded
economy – and household production as an essential part of it - itself naturally is of
importance in particular as an indicator of the performance of a society measuring a
society’s welfare and economic output (Gronau 1986, Statistics Canada 1994,
Goldschmidt-Clermont and Pagnossin-Aligisakis 1995, Goldschmidt-Clermont 1993;
for Germany: Seel 1988, Merz 1996). In addition, extending market income to some full
income is important for international, cross country comparisons and perspectives of
differently organized market and non-market human ressource and production
possibilities.
Though there is a sound and evident need for microanalyses of individual extended
income dynamics of inequality and poverty including unpaid work, empirical analyses
of extended income and welfare are rare within the cross section frame, and the more
and almost invisible within a dynamic framework, not only in Germany. The rare
foreign enhanced cross sectional studies e.g. by Jenkins and O’Leary 1996, Gershuny
and Halpin 1993, Bonke 1992 or Bryant and Zick 1985, and Merz 1989 for Germany,
underline the situation and urgently ask for an empirically based enhanced income
analysis for Germany as a cross section and the more as a longitudinal dynamic
analysis.
components of our approach: incorporating the household and family structure (within
the individual analysis) by the equivale nce scale approach as well as valueing unpaid
work as an important part of the non-market household ressources. Within the
equivalence scales part we search for proper empirically based equivalence scales.
Within the valuation part of unpaid work we discuss a variety of measurement
approaches of shadow pricing to evaluate the time spent for unpaid work. In this paper
we concentrate on market replacement costs with a global and specialized substitute and
– as a specific feature - on an individual self-evaluation of household production. A
forthcoming paper will deal with the microeconomic based opportunity wage and the
reservation wage concept. Our microdata base is the German Socio-Economic Panel
with ten waves from 1985 to 1994.
The empirical attempt will be in two steps: in the first step, cross sectional patterns from
the mid 80s and the mid 90s shall describe the overall extended income distributional
changes where the household structure is covered by a broad spectrum of equivalence
scales. There the German overall situation is described including the ‚Neue Länder‘ for
1994 after our reunification 1990/91. Extended income, in particular, will be calculated
with regard to several shadow pricing procedures for unpaid work. With those different
scenarios and the two cross sectional snapshots the microsimulation approach shall
disentangle the overall changing household structure and shadow pricing influences on
the extended income distribuitions within a decade.
With the second empirical step, individual dynamics and economic well-being mobility
are regarded by a panelanalysis. The panelanalysis will show and quantify the
individual dynamics as movements from extended income positions regarding the
respective household and working load structure. With regards to socioeconomic
impacts we present our results for the following different occupational groups:
professions and entrepreneurs as self-employed as well as employees with their
different souvereignity in spending their time to paid and unpaid work. In the
concluding remarks we express some economic and social policy impacts of the
approach in general and our results in particular.
2
Incorporating household/family structures – The equivalence
scales approach
2.1
Household and family sociodemographics and equivalence scales
When analyzing individual socioeconomic behaviour it is desirable to take into account
a person’s family and household situation. Because of possible economies of scale in
larger households and different individual needs of adults and children, a simple scale,
given by an equal weight to each person (head counting) providing a per capita
household income, is not flexible enough to study the distribution of well-being.
Therefore, more adequate household type specific weights are important for further
income comparisons concerning inequality and the measurement of poverty. One
proven important way to take this into account is the well-known equivalence approach.
and constant prices
p
, an equivalence scale e of a household with composition
s
relative
to that of some reference household with composition
s
0then is defined as
(1)
e = c(u,
p
,
s
)/c(u,
p,s
0) = y/y
0, y = y
0 *e
where c(.) is the cost function of reaching utility level u and y is the money income of
the respective household. A family of two, say, requires e-times as much disposable
income as a family of one to reach the same level of equivalent income y.
Equivalence scales might be divided into three general categories: expert, subjective and
consumption based scales.
1)Expert based equivalence scales are defined by
physiological and socio-cultural basic needs stated by some experts. Subjective
equivalence scales are based on individual surveys asking on the one hand for an
overall, general necessary income of anybody and on the other hand for a respondent's
own necessary income. Consumption based equivalence scales rely on revealed
preferences measuring actual consumption expenditures of different household types.
Single consumption equation methods regard either absolute expenditures with specific
adults' and children's goods where the income relation y/y0 is given by identical relative
expenditures. Multiple consumption equation methods encompass several goods to
capture different economies of scale in different goods. Finally, the complete demand
system approach relies on the theory of consumer behaviour. The cost functions are
defined by microeconomic theory and its duality incorporating the household allocatio n
problem of full market basket expenditures. Recent attempts additionally regard
intra-household allocation of ressources via a intra-household production approach.
2.2
In search for a proper empirical range of equivalence scales
Because of this variety of equivalence approaches there is the question which one – or
to be more sensitive: which range - is adequate for our purpose. In a recent joint US and
German research project we compared equivalence scales with consistent methods and
similar microdata bases as recent income and consumption sur veys of both countries.
2)We concentrate there (Merz and Faik 1995, Burkhauser, Smeeding and Merz 1996) on a
single equation expenditure method with different Engel approaches as well as on a
complete demand system approach (Merz and Faik 1995). The complete demand
system approach provides true, constant utility based equivalence scales and is specified
by an extended linear expenditure system (ELES). While the Engel methods
traditionally focus on food expenditures, the multiple equation expenditure complete
1) In a recent survey on equivalence scales and their uses in inequality and poverty measurement,
Coulter, Cowell and Jenkins 1992a divide the topic in 5 categories: econometric, subjective, budget standard, social assistance, and pragmatic equivalence scales. Pollak and Wales 1979 in general discuss welfare comparisons and equivalence scales. For further equivalence scales overviews e.g. see Klein 1990, Bradbury 1992b and Nelson 1992. Coulter, Cowell and Jenkins 1992b discuss equivalence scale relativities and the extent of inequality and poverty.
2) National Institute on Aging Program Project No. PO1-AG09743 on 'The Well-Being of the Elderly
demand system takes into account a full market basket with all its interdependencies
and relative prices.
The results of our empirical work yield the following overview of alternative
equivalence scale values for Germany: consumption expenditure scales (based on a
sample with more than 42.000 households), subjective scales and three expert scales:
the implicit German official social assistance, the OECD and an international expert
scale (see Table 1).
The inspection of Table 1 shows quite a range of equivalence scale. To cover, at least to
some extent, this broad range we shall take the two ‚extreme‘ scales further into
account: the revealed preference consumption based ELES-scale
3and the implicit
German official social assistance expert scale. As shown in Table 1, the German official
social assistance (further GOSA) scale is steeper ascending and weight a 6 persons
household with 435; this is more than twice the German ELES scale weight with 193.
All other scales are lying in between this range so that our further analyses will capture
the other scales and its reasonings.
3
Valueing concepts of unpaid work
There is a broad literature concerning the evaluation of unpaid work e.g.
Goldschmidt-Clermont 1982, 1993, Fitzgerald, J. und Wicks, J. 1990 or, in particular, Statistics
Canada 1994 with its Proceedings of their International Conference on the Measurement
and Valuation of Unpaid Work. Rather neglecting here outcome measures we shall
concentrate on the so-called input oriented evaluation, i.e. we are looking for
appropriate shadow prices which then will value the time spent for unpaid work at
home. In particular, we incorporate in our microanalyses: first, different market
replacement costs, and second, a self-evaluation by the interviewed persons which is
actually regarding input and output oriented measuring. As stated in the introduction,
opportunity cost measures, like foregone alternative wages and reservation wages, will
be considered in a following paper.
3.1
Replacement cost measures: Generalist and expert costs
Most of the work on valueing time spent in household production has been done by
using market alternative cost approaches. The market alternative or replacement cost
approach value the time spent for certain home activities by that value which has to be
paid for similar services in the market. The third-person-criteria here gives some hints
which household production activities are near market and could be substituted by
market alternatives.
The market replacement costs may be divided by a generalist (with a global substitute)
approach and specific to the kind of work by adequate specialized market substitutes.
The replacement cost by a generalist, in particular, takes into account managing
components where the cost by experts counts for their specific skills.
It is being discussed controversially whether to better take before-tax income or net
earnings for the evaluation of household production by the replacement cost approach.
For sure the decision on pro or con (like the choice of the evaluation method) is pending
the exact target of investigations. We are here following the line of argumentation of the
German Federal Statistical Office, according to which institutional basic conditions of
household production do not comply with those of usual paid work
2. There are neither
taxes to be paid in household nor national insurance, nor does a claim exist for paid
days of illness, or vacation leave. Therefore, a net hourly wage is being based upon in
our study.
3.2
Self-evaluation
In general, methods of self-evaluation are rarely discussed in the literature, probably for
reasons of unavailable data. A self-evaluation of household production activities is the
individual evaluation of savings induced by household productions which gives
information on the subjective value and productivity of unpaid household work. The
assignment to an input or output oriented measure is depending on how a questionnaire
is asking for the input a person is valueing by him/herself (which then allows an
adequate comparison to the above input-oriented measures) or whether the question is
about buying the final output.
4
Extended income concept – Personal equivalent household
extended net income
Now let us put together the theoretical components for our microanalysis of extended
income with consideration of a broad spectrum of equivalence scales. For market work
we shall incorporate not only the personal traditional paid work as a self-employed or
employee but shall include the overall income situation from the market including
non-labour income like personal transfers and possible income parts from let and lease, from
savings etc. The rationale is: the enhanced full household income is the more adequate
measure of the household overall ressources offered at the market. In that sense we shall
use paid overall market work as household income.
The extended income part by unpaid work is a part of the overall household production
and shall incorporate evaluated time use for different near market activities still to be
defined.
Thus,
market income then is household net income (monthly) and if personalized,
personal equivalent household net income (monthly)
(16)
ym = yh /e
where yh is household net income and e is the respective equivalence scale.
Unpaid work income consists of all persons r=1,...,k activities, where the time input in
activity r is evaluated by a certain evaluation method. As we shall see non-market
activities (r) in our empirical analysis are: H= Housework, C = Childcaring, D = Do-it
yourself.
Market replacement costs with a global substitute (GL)
Market replacement costs with specialized substitutes (SL)
Self-evaluation (SE)
Thus, personal unpaid ‚income‘ for person i is
(17)
y
nij=
Σ
r=H,C,Dh
nriv
j.
Where h
nri= non-market monthly time in activity r of person i, v
j= shadow price due to
method j (j=1,2,3).
Extended income: After summing up all personal (i) monthly unpaid income
components the entire market and non-market (full) income then will be defined as a
personal equivalent household full net income (extended income)
(18)
y
j= (y
h+
Σ
iy
n j)/e
with regard to one of the unpaid work evaluation methods j. If there is a household of
three persons, say, then we have three personal equivalent household extended net
incomes of the same size to consider in the distributional computations.
5
Microdata base: The German Socio-Economic Panel
5.1
General Characteristics
Investigating individual dynamics a panel data base of repeated information of a
person’s situation over time is necessary. The German Socio-Economic Panel (GSOEP)
- founded by the Sonderforschungsbereich 3 (Sfb 3) ‚Microanalytic Foundations of
Social Policy‘ of the Universities Frankfurt and Mannheim and now a project within the
German Institute for Economic Research (DIW, Berlin) with the field work done by
Infratest Burke Sozialforschung, München - is our microdata base. Since 1984
socioeconomic information about more than 12,000 persons over 16 years in 4,500
households is collected per year with some additional monthly information. Moreover,
following the reunion of both parts of Germany, since 1990 there have been
incorporated further 2,200 East German households with approximately 4,450 persons.
Our ten years microanalyses start with the second wave, 1985, because of comparable
time budget questionsf starting that year.
5.2
Market and non-market work questionnaire: Household income and time
use questions
The questions concerning household net income and time use in unpaid work in the
Socio-Economic Panel are presented in Table 2. Household income as our enhanced
paid work concept is asked as an alltogehter household net income question.
The time use information exists of an activity specific set of questions of a normal day.
Thus, there is the possibility for some activity specific individual time use information
of a normal day within a time budget frame which then have to be valued as above.
Due to the fact that the time budget question had different activities in 1984 and from
1985 on, we start our analysis from 1985 to regard similar activity patterns. It would be
beyond the scope of the GSOEP with its multiple targets to have time use data in form
of a diary. Thus, time use measured in hours as regards the different kinds of activities
of a
usual
work day and a Saturday are to be indicated. Summing up over all daily
hours, because of some simultaneity it has not to be assured that the sum always have to
be 24 hours. The pros and cons of stylized vs. diary time use questions are discussed
e.g. by Niemi 1993 or Juster and Stafford 1985.
As mentioned before the Third-Person-Criterion define the set of unpaid work activities.
Thus, we regard housework and shopping (H), childcare (C) and handcraft/maintenance
work in respect of house, flat and car, garden work, briefly “Do-it-yourself (DIY)” (D).
As for all empirical work the final sample with sound and available information for all
units of investigation is reduced to the original sample size. The time use data had to be
edited further insofar as the individual time spent on a single activity had to remain
below 16 hours per day. Thus, it has been taken into account that each person needs
time for personal regeneration, even in case of looking after children around the clock.
Another problem arose from the changes regarding the formulation of questions in the
course of years. In the year 1994 (wave K) time use on sundays has no longer been
asked. These missing data have been generated based on wave J (1993) in order to meet
the differing course of working days and sundays. To this aim time use data for working
days and Sundays have been put into relation for all persons questioned, this quotient
being proportionally applied to indications in wave K.
6
Results I: Valueing unpaid work – Replacement cost measures
and self-evaluation 1985 and 1994
Before investigating the distributional impacts of extended income measures over a
decade we briefly describe the measures of the replacement costs and the self-evaluation
for Germany 1985 and 1994.
6.1
Replacement costs measures 1985 and 1994
The two methods basing on the replacement costs differ in the choice of substitutes. The
underlying wage of the first method is those of a general domestic staff. The BAT
(Bundesangestelltentarif) is an official tariff and valid all over Germany. The second
method to introduce replacement costs is the specialist variant: the different activities
housework, childcaring and DIY are evaluated by the wages of specialists.
The standard wage grade for housekeepers in our study is based on the wage agreement
for private households and for children’s nurses/nursery school teachers according to
the Federal Tariff for Employees (BAT)
3. Here, tariff grades VIII up to Vb are being
considered; in order to obtain average values the arithmetic mean has been taken, based
on the two bordering tariff grades.
There is no standard tariff agreement existing for the aggregate Do-it-yourself sector as
we shall need for our empirical ana lysis. The Statistical Annual Report, however,
publishes wages for various handcraft professions. In order to cover wages resulting
from maintenance and handcraft work in the household, an average was formed on the
basis of earnings of master painters, varnishers, metalworkers, motor mechanics,
plumbers, electricians, gas-fitters, heating engineers, carpenters and agricultural
workers.
The above steps are overall generating before-tax wages. In order to achieve the desired
net wage, an estimation of legal social insurance and taxes had to be made. This was
done by means of data from the Socio-Economic Panel, in referring to the difference
between net and before-tax wages in respect of the relevant wage grades.
Table 3 summarizes all evaluation methods in valueing time spent in household
production we use in our investigation.
6.2
Self-evaluation results 1985 and 1994
One of the innovations within the Socio-Economic Panel is the question about
self-evaluation of unpaid work. Unfortunately, there are no self-self-evaluations at disposal for
all
activities in our data base. However, two main questions of the German
Socio-Economic Panel may be referred to, from 1987 (wave C) dating back to 1986 as
regarding the Do-it-yourself sector:
Table 3:
Methods for valueing household production
1.
Market replacement costs with a global substitute (GL):
Time use
Substitute
H+C+D
housekeepers net wage (wage agreement)
2.
Market replacement costs with specialized substitutes (SP):
Time use
Substitute
H
housekeepers net wage (wage agreement)
C
nursery-school teachers net wage (BAT)
D
manual workers net wage (Statistical Office)
3.
Net opportunity costs (NOC):
Time use
Substitute
H+C+D
individual reservation wage
(individual opportunity wage)
4.
Self evaluation (SE)
Time use
Substitute
H
housekeepers net wage (wage agreement)
C
nursery-school teachers net wage (BAT)
D
Individual self evaluation;
Source: GSOEP 1986
Question No. 8:
Did you spend money on material or else when manufacturing or
pro-ducing these? If so, please estimate the total cost incurred during the last year. Please do
not include costs for the acquisition of tools and machines.
In order to achieve a net value, expenditures for handcraft work has been deducted from
the estimate savings. Calculation of the hourly wage in 1985 was effected based on
individual DIY-time use in Wave B, i.e. each person being given his/her own wage
opposite to the usual market evaluation method. Since there has not been a new
self-evaluation for 1994, individual hourly wages of 1985 have been inflated by the index of
handcraft capacity.
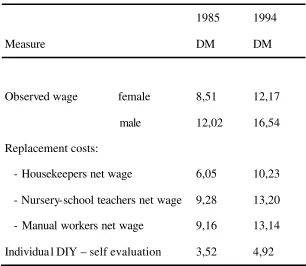
[image:18.596.116.422.390.656.2]The results of all the replacement cost evaluations as mean values are summarized in
Table 4. From the above discussion it is obvious that the observed wage measure as
well as the DIY-self-evaluation are individually different whereas the replacement costs
are overall mean wages. As it could be seen in Table 4 the lowest wage measure is the
the individual DIY-self-evaluation. Such a relatively low valuation of own input is
remarkable, the more since the self-evaluation question is output oriented and therefore
theoretically should incorporate all inputs and the production value itself.
Table 4:
Valueing unpaid work: Mean hourly wages as
components of various evaluation methods
Measure
1985
DM
1994
DM
Observed wage female
male
8,51
12,02
12,17
16,54
Replacement costs:
- Housekeepers net wage
6,05
10,23
- Nursery-school teachers net wage 9,28
13,20
- Manual workers net wage
9,16
13,14
Individua l DIY – self evaluation
3,52
4,92
This may be considered an evident sign of high productivity rates in households being
definitely overestimated. To substantiate this assumption it would be useful to dispose
of an evaluation (into the future) of classical male and female household activities,
shopping and raising up children. Due to a lack of such information these activities had
to be included into the method of self-evaluation at an expert wage level.
7
Results II: Extended income dynamics - Cross sectional
distri-butional evidence after a decade (1985-1994)
This section concentrates on two cross-sectional snapshots: the extended income
situation in the mid of the 80s (1985), and ten years later, in the mid of the 90s (1994).
They describe the distributional situation in overall Germany. Note that 1994 includes
the ‚Neue Länder‘.
7.1
Unpaid work – Time use and income results 1985 and 1994
Let us start with the presentation of our res
ults according to the time use pattern to be valued by the different methods.
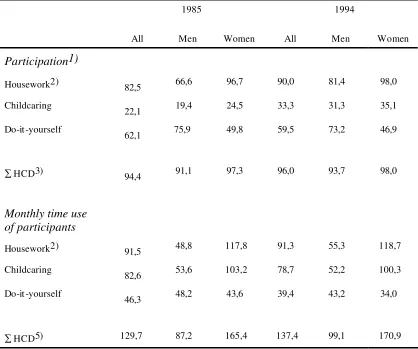
The monthly time use of those who participate out of Table 5 shows the expected
divergence between men and women. While women spent in 1985 in the average 165
hours with unpaid work activities, men only invested 87 hours. The overall average
unpaid work time use increased in the following decade by 5,9%. As it is shown in
some other studies, too, this overall increase is mainly due to the increase of men’s time
spent in unpaid work by 13,6% (ca. 12 h/monts) compared to a women’s increase by
3,3% (ca. 5,5 h/months). Evidently, however, is the almost double time burden in both
years for women.
When valueing the individual time use pattern in unpaid work as averaged in the last
Table we yield the personal monthly unpaid work income results out of Table 6.
According to the larger amount time women spent in unpaid working activities, their
monthly value of household production is higher than those for men. This holds both for
1985 and 1994. Is there any difference accoring the valuation method? Within the
replacement cost approaches unpaid work income is highest – for men and women –
when valued by a specialist wage. The ordering, however, is in both years gender
dependent when compared self-evaluation and a generalist‘s housekeeper evaluation:
lowest men unpaid income is given by self-evaluation, lowest women unpaid income is
given by a generalist’s approach. Due to the mixed DIY-valuation between specialist
and self-evaluation these differences are not distinct.
Table 5:
Valueing household production: Participation and time use in
non-market activities by gender 1985 and 1994
1985 1994
All Men Women All Men Women
Participation1)
Housework2) 82,5 66,6 96,7 90,0 81,4 98,0
Childcaring
22,1 19,4 24,5 33,3 31,3 35,1
Do-it -yourself
62,1 75,9 49,8 59,5 73,2 46,9
∑ HCD3) 94,4 91,1 97,3 96,0 93,7 98,0
Monthly time use
of participants
Housework2) 91,5 48,8 117,8 91,3 55,3 118,7
Childcaring
82,6 53,6 103,2 78,7 52,2 100,3
Do-it -yourself
46,3 48,2 43,6 39,4 43,2 34,0
∑ HCD5) 129,7 87,2 165,4 137,4 99,1 170,9
1) Regarding positive time use values for a normal work – or sunday (in % of N).
2) Housework including shopping and services is ascertained in one question op to 1990 (wave 7) 3) Individual average participation of either housework (H), childcaring © or do-it-yourself (D). 4) Average hours of participations; including specific information of work – and sundays. An average
month of 30,42 days (26,08 weekdays, 4,34 sundays) is assumed. To receive an approximation for not available time use data on sundays 1994 (wave 11), we used the individual sunday time use information of 1993 (wave 10) and a mean time use for those people who are panelmembers in 1994 but not in 1993.
5) Individual average sum of time use in H, C and D.
7.2
Changing distributions of extended incomes: Inequality and poverty 1985
and 1994
Now we are able to investigate distributional impacts of household income and
extended income according different unpaid work valuation methods and different
equivalent scales for the entire extended income concept.
Graphical inspection of changing distributional patterns
First let us have a look to the graphical situation to get an illustration of what is
happening. The distribution of individual equalized household income in the broader
definition of paid respective market income compared to the personal equalized
extended income where unpaid work is measured by the generalist and specialist wages
for 1985 and 1994 based on the German Official Social Assistance equivalence scale
(GOSA–scale) is presented in Figure 1a, and based on the other extreme Extended
Linear Expenditure complete demand system equivalence scale (ELES–scale) in Figure
1b.
We use an Epanechnikov-Kernel (non-parametric) estimation of the density with an
optimal width of the density window calculated with the STATA program package. To
normalize inflationary influences all graphs are a multiple of the respected mean market
income value.
GOSA-scale: In 1985 the well known negatively skewed household income distribution
naturally is centered more to the right with no big differences according the two
replacement cost measures. Extended income density is flatter and has its peak in
between 1,5 and 2 times the mean.
In 1994 the picture is quite different: extended income is flatter compared to 1985 with
its peaks around almost 2 times the 1994 market income mean.
ELES-scale:
When compared to the GOSA figures all distributions are flatter. The
1994 extended income picture seems like a normal distribution, a tendency, which can
be seen by all extended income densities.
To summarize the first glance with the two snapshots: the distributional pattern
concerning equivalent household income, and the more, concerning the extended
income situation changed in particular where ten years later the extended income
density looks almost like a normal density distribution; the extended income distribution
is flatter than 1985 and has its peak on higher income. Note, that with the two cross
sections overall Germany is regarded where 1994 the ‚Neue Länder‘ are incorporated
and might be of special influence. Thus, the question about the individual changing
pattern is left to the following longitudinal results.
Numeric inspection of changing distributional patterns
The economic well-being in inequality and poverty for household and extended income
1985 and 1994 for both extreme scales (GOSA and ELES) in Table 7 is measured by
the Gini-coefficient and the poverty rate at 50% of mean respective equivalent income.
In addition some aggregated development indices describe the changing patterns.
Overall picture: In both years, 1985 and 1994, household income inequality and
poverty is remarkably reduced when unpaid work is taken into account. The
Gini-coefficient is reduced by ca. 30% with the GOSA-scale and more than 20% with the
ELES-scale. Extended income considerations reduces the poverty rate even stronger by
ca. 65% (GOSA-scale) and by ca. 50% (ELES-scale). This gap is reduced in 1994 but
sill remarkable. The replacement methods of evaluation do not show a significant
different pattern.
Equivalence scale influences: Thus, the German official social assistance (GOSA)
scale strengths this equalizing tendency when compared to the ELES-scale where the
poverty situation is more scale dependent than the overall inequality situation. A
stronger consideration of economies of scales for larger households with the
GOSA-scale shows more equalizing effects: different GOSA-scales with different consideration of
household sociodemographics do remarkably count in measuring extended income in
particular.
Changing patterns 1985 to 1994: Household income inequality
is raised in Germany
from the 80s to the 90s by ca. 4% (GOSA-scale: +4,1%; ELES-scale: +3,8%). In
contrast,
extended income inequality
even changed the sign of development and shows
a slightly more equalized situation ten years after (GOSA-scale: -1,3% resp. –1,5%;
ELES-scale: -1,9% resp. –2,5% according to the generalist resp. specialist replacement
cost approach).
Thus, engagements in unpaid work first significantly reduces market inequalities, and
second within a decade this engagement with its inequality reducing effects is going to
be or has to be more important.
With regard to
poverty dynamics and the lower part of the income distribution,
independent of both extreme equivalence scales, extended income poverty is raised
within a decade. The values are between 5,7% and 2,6% (GOSA, GL and SP) respective
between 6,8% and 4,1% (ELES, GL and SP) within a decade. Pure household income
seems to be more sensitive with regard to equivalence scales: household income poverty
is reduced by –8,6% (GOSA-scale) but slightly increaseed by +1,1% (ELES-scale). For
more detailled information of household income inequality and poverty developments
in Germany see Hauser and Becker 1998 und Berntsen 1992,
Whilst overall extended income inequality within a decade is decreased, poverty, the
lower part of the income distribution, is increased. This holds for both extreme scales.
Pure household income poverty is scale dependent in particular with even changing the
sign of the poverty development.
8
Results II: Individual longitudinal changes in market and
non-market inequality and poverty: A panleanalysis with ten
GSOEP waves 1985 to 1994
Analyzing longitudinal income and income changes is still at its infancy. Though there
are approaches on income mobility or duration analyses being in one of the income
classes etc., further approaches with respect to longitudinal profiles have to be
deepened. From the substantive point of view changing patterns need a social political
discussion about what is desirable or not. Escaping from (income) poverty is probably a
desire under many views and ideas about the world, but what is about the rest of the
income distribution and its dynamics? Which consequences should politicians draw if
they include a concept of extended income? We shall briefly stress this point in our
concluding remarks.
To answer these questions an empirical based picture is naturally needed: not only as
two snapshots as above, but on the individual longitudinal level to follow the individual
development. Since in any aggregated picture individual different developments might
be balanced, the panel view allows to follow up adequately the individual development.
8.1
The longitudinal microdata set
Our approach discussed here will investigate income and extended income mobility
from certain relative income classes in 1985 to 1994. The panel data will serve the
information for the identical persons form the mid 80s (1985) and then ten years later
(1994). Thus, when concentrating on theses two years of a person’s development we do
not investigate in this paper the process in between.
8.2
Individual welfare dynamics in inequality and poverty of market and
non-market work 1985 to 1994
What are the income mobility impacts of different paid and unpaid work income
concepts with its different valuation methods of unpaid work? Does scaling matter? Our
microsimulation analyses with the comparison of the different scenarios will
disentangle the single effects.
Income mobility
Table 8 shows the individual longitudinal changes according to welfare positions 1985
to 1994 with respect to the two scales: the German Official Social Assistance-scale in
8a and the ELES-scale in 8b. A welfare position is defined as a multiple of the
respective mean income. There are 6 welfare position classes ranging from
≤
0.50 until
≥
1.50 times that mean. Each cell a
ijcounts the number of weighted persons who in 1985
Thus, for instance a
11=28.4% of first row in Table 8a has to be interpreted as: 28.4% of
all the persons who in 1985 were in the lowest welfare class are still in that class 10
years later when only paid income is regarded under the GOSA-scale. By the way, the
choosen 0.50% of the mean income is near the poverty line under investigation.
Because Tables 8a and 8b consist of a large number of income mobility figures for paid
income and three extended income versions some condensation is necessary. Based on
the detailled figures of Table 8a and 8b the following Table 9 includes mover indices as
the percentage of those peaope who have changed their welfare position after ten years
compared to all people from the starting welfare position 1985. We divide the results
according to paid income and three replacement cost approaches defining a respective
extended income under the two extreme scales GOSA and ELES.
First and overall: there is a lot of dynamics from all six welfare positions with much
more than 50% of respective people moving from each welfare position.
When regarding market income only (the first package in Table 9 and Tables 8a, b) the
most movements are by the poor (more than 70% are able to escape from poverty) and
for the two classes just above mean personal equivalent household income. Despite the
lowest and highest welfare position it will become evident that richer persons show
more income mobility. These findings hold both for the GOSA- and ELES-scale.
Now, let us look to extended income. Extended income mobility is remarkable great
with the most movements from the lowest and highest welfare positions. This holds for
all three valuation methods: Generalist and specialist substitutes and self-evaluation.
Thus, there is almost no general effect concerning the valuation method within the
replacement approaches. These findings hold both for the GOSA- and ELES-scale.
Market income vs. Extended income: Main differences can be disentangled just above
poverty and with regard to the richest welfare position. Within a decade all extended
income measures (replacement costs) show a tendency to a middle welfare position over
the ten years period with diminishing extreme positions
.
In a longitudinal view household production as an additional income ressource is in
particular able to circumvence poverty and is equalizing with a tendency to the middle
of the extended income distribution. This dynamic effect is additional to the discussed
tendency to the middle by accounting for additional income ressources.
Equivalence scale effects: Accounting for larger economies of scales within the
ELES-scale compared to GOSA results in the following: when considered paid income only
welfare mobility of the poorer is diminished and of the richer is growing. When
considered the extended income welfare mobility both welfare tails (of the poorer as
well as of the richer) are growing.
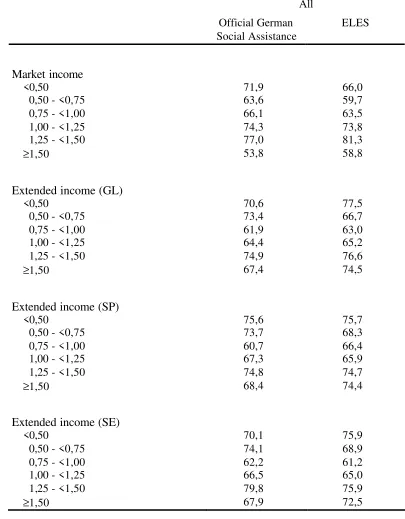
Table 9:
Individual longitudinal changes of the relative welfare positions
1985 to 1994: Mover Index1
)
All
Official German
Social Assistance
ELES
Market income
<0,50
71,9
66,0
0,50 - <0,75
63,6
59,7
0,75 - <1,00
66,1
63,5
1,00 - <1,25
74,3
73,8
1,25 - <1,50
77,0
81,3
≥
1,50
53,8
58,8
Extended income (GL)
<0,50
70,6
77,5
0,50 - <0,75
73,4
66,7
0,75 - <1,00
61,9
63,0
1,00 - <1,25
64,4
65,2
1,25 - <1,50
74,9
76,6
≥
1,50
67,4
74,5
Extended income (SP)
<0,50
75,6
75,7
0,50 - <0,75
73,7
68,3
0,75 - <1,00
60,7
66,4
1,00 - <1,25
67,3
65,9
1,25 - <1,50
74,8
74,7
≥
1,50
68,4
74,4
Extended income (SE)
<0,50
70,1
75,9
0,50 - <0,75
74,1
68,9
0,75 - <1,00
62,2
61,2
1,00 - <1,25
66,5
65,0
1,25 - <1,50
79,8
75,9
≥
1,50
67,9
72,5
1)
Mov
er Index = (People who have changed their welfare position) / ni..
Source: German Socio-Economic Panel (GSOEP), weighted longitudinal section data;
Figures 2a and 2b support these findings when measuring the mobility intensity by
differences of paid to extended income regardless the replacement cost approach. In
particular, the ELES-scale shows different results for the poorer people within the
lowest welfare position.
With a tendency to smaller households in Germany in the last decades (and in modern
societies in general) and a growing number of single households an ELES-type scale
will show more longituidinal impacts on income mobility.
There are many further single results. The interested reader is referred to the above
Tables.
9
Further Socioeconomics: Changing patterns for professions,
entrepreneurs and employees
In this last section we focus on further socioeconomic breakdowns and influences. The
question is: has time use souvereignity connected with paid work any influence to the
the patterns? We briefly look to inequality dynamics for self-employed, as professionals
(Freie Berufe) and entrepreneurs as well as employees. Thus, we concentrate our
following analysis only to paid working people divided according to the occupational
status.
To answer the question there is an intrinsic difficulty when analyzing the household
sociodemographics by equivalence scales: what is the occupation of the household, not
of the person itself? There are (at least) two ways for a solution: take the household
head’s occupation or take the bred winners‘ occupation, i.e. of that person with the
maximum paid work contribution.
Our result: there is not much difference between these two approaches in Germany for
1985 and 1994. In the overwhelming cases both attributes characterizes the same
person.
Table 10 just measures the inequality dynamics by Gini-coefficients for paid market
income and the extended income as valued by the generalist approach. Personal
equivalent respective income is scaled by the German Official Social Assistance scale
(GOSA).
In 1985 as well ten years later there is a clear ordering concerning market income: most
inequality is given by employees, followed by entrepreneurs and finally by professions.
The picture is different according to extended income: while 1985 this ordering holds
too for the extended income, for 1994 we see a reversed picture: inequality is highest
within entrepreneurs followed by professions and then employees.
In other words: It is the dependent employment situation, may be despite of all time use
souvereignity but dependent on needs not covered by market activities, which could or
has to balance the income situation.
The picture again is different when extended income dynamics are regarded: relative
inequality is unchanged for employees. Entrepreneurs‘ and professions‘ incomes are
more disparate ten years after (49 resp. 54%).
To conclude these further socioeconomic findings: As it might be expected, there is a
lot of variance according to socioeconomic groupings. Time use souvereignity with
regard to the paid market job in particular does matter not only in market income
inequality but differently according to extended income. There are distinct differences
between professions, entrepreneurs and employees with respect to their inequality
profiles and extended income influences.
10
Concluding remarks
Our investigation of welfare dynamics of market and non-market (unpaid) income was
based on the consideration of household sociodemographics and a set of different
replacement cost and self-evaluation measures when valued unpaid work in housework,
child caring and DIY. Though some further opportunity results still have to be
computed some general conclusions are possible:
Valueing household production: Different replacement evaluation methods show
similar cross sectional as well longitudinal inequality and poverty incidences.
Equivalence scales: The two extreme equivalence scales (German Official Social
Assistance (GOSA) scale and the full market basket complete demand equation
extended linear expenditure ELES scale, which include a broad range of further expert,
subjective and microeconometric scales, show remarkable effects:
Cross sectional
: ELES compared to GOSA: paid (household) income inequality and
poverty diminish the 80s and 90s figures; extended income inequality and poverty raises
the 80s and 90s figures remarkably.
Longitudinal
: ELES compared to GOSA: welfare mobility of paid (household) income:
to be poor is measured more lasting from the 80s to the 90s; extended income: to be
poor and to be rich is measured more short termed from the 80s to the 90s.
Equivalence scales are sensitive in particular in the lower and upper tails of the
distributions, regardless of pure market or extended income concepts.
Market income vs. extended income: extended income as an enhanced concept of
economic ressources of households show remarkable impacts on relative inequality and
poverty when compared to more traditionally regarded household income figures:
Cross sectional
: when compared to paid (household) income extended income
inequality and poverty is reduced within the mid 80s as well as within the mid 90s.
Summarizing the effects: even if not all parts of our considered unpaid work
(housework, child caring and Do-it-yourself) is entirely work in the sense of a
replacable market work (via the third-person criteria), the magnitude of the effects and
our results will be still striking.
To give some answer to the stated question on the beginning: the rapidly changing
market conditions at the end of our century could be balanced only by further unpaid
household ressources with respect to a more equal income distribution. In other words,
it is only due to unpaid work at home which circumvence income rigidities not any
further available at the market.
References
Atkinson, A.B., Rainwater, L. and T.M. Smeeding (1995), Income Distribution in OECD Countries: Evidence from the Luxembourg Income Study (LIS), OECD, Paris
Becker, G.S. (1965), A Theory of the Allocation of Time, in: Economic Journal 75, 493-517
Berntsen, Roland (1992), Dynamik in der Einkommensverteilung privater Haushalte: eine empirische Analyse für die Bundesrepublik Deutschland. Camp us Verlag, Frankfurt/New York.
Bradbury, B. 1992, The Theory of Family Size Equivalence Scales: An Overview, Paper prepared for the Luxembourg Income Study (LIS) Summer School, Walferdange, Luxembourg, July 20-31
Burkhauser, Richard V., Smeeding, Timothy M. and Joachim Merz (1996), Relative Inequality and Poverty in Germany and the United States Using Alternative Equivalence Scales, in: The Review of Income and Wealth, Vol. 42, No. 4, S. 381-400, 1996
Chandler, W. (1994), The Value of Household Work in Canada, 1992, in: Canadian Economic Observer, Statistics Canada, Cat. No. 11-010, April 1994, Canada
Coulter, F.A.E., Cowell, F.A. and S.P. Jenkins 1992a, Differences in Needs and Assessment of Income Distributions, in: Bulletin of Eco-nomic Research 44:2, 77-124
Coulter, F.A.E., Cowell, F.A. and S.P. Jenkins 1992b, Equivalence Scale Relativities and the Extent of Inequality and Poverty, in: The Economic Journal 102, 1067-1082
Deaton, A. and J. Muellbauer (1980), The Economics of Consumer Behaviour, Cambridge
Fitzgerald, J. und Wicks, J. (1990), Measuring the Value of Household Output: A Comparison of Direct and Indirect Approaches; in: Review of Income and Wealth, Vol. 36, No. 2.
Förster, M. (1990), Measure of Low Incomes and Poverty in a Perspective of International Comparisons, Labor Market and Social Policy Occasional Paper No. 14, OECD, Paris
Goldschmidt-Clermont, L. (1982), Unpaid Work in the Household - A Review of Economic Evaluation Methods, International Labour Organization , Genf.
Goldschmidt-Clermo nt, L. (1993), Monetary Valuation of Non-Market Productive Time – Methodological Considerations, in: The Review of Income and Wealth, 39, 419-433
Goldschmidt-Clermont, L. (1994), Accounting in monetary terms for unpaid household work; in Kalfs, Nelly und Andrew S. Harvey (Hrsg.), Fifteen Reunion of the International Association of Time Use Research: Amsterdam, June 15-18 1993, NIMMO, Amsterdam, S. 47 - 54.
Haagenars, A.J.M., de Vos, K. and M.A. Zaidi (1994), Patterns of Poverty in Europe, Paper presented at the 23rd General Conference of the IARIW, St. Andrews, Canada
Hauser, R. and I. Becker (1998), Die langfristige Entwicklung der personellen Einkommensverteilung in der Bundesrepublik Deutschland, in: Galler, H.P. und G. Wagner (Hg.), Empirische Forschung und wirtschaftspolitische Beratung, Campus, Frankfurtt/New York, 119-134
Hawrylyshyn, Oli (1976), The Value of Household Services: A Survey of Empirical Estimates; in: Review of Income and Wealth, Vol. 22.
Hilzenbecher, M. (1986), Die (schattenwirtschaftliche) Wertschöpfung der Hausarbeit; in: Jahrbücher für Nationalökonomie und Statistik, Bd. 201/2, S. 107 - 130.
Juster, Th.F. and F.P. Stafford (Eds., 1985), Time, Goods, and Well-Being, Ann Arbor, USA
Klein, Th. 1990, Zur wohlfahrtsgerechten Bemessung von Sozialeinkommen, in: Hauswirtschaft und Wissenschaft, 5, 224-36
Lützel, H. (1990), Ergänzung der Volkswirtschaftlichen Gesamtrechnungen um die Haushaltsproduktion; in: Schweitzer R. v. et al. (1990), Zeitbudgeterhebungen. Ziele, Methoden und neue Konzepte, Stuttgart.
sozialpolitischer Maßnahmen für die Bundesrepublik Deutschland (Habilitationsschrift), Frankfurt 1989
Merz, J. (1996), Schattenwirtschaft und Arbeitsplatzschaffung, in: Sadowski, D. und K. Pull (Hg.), Vorschläge jenseits der Lohnpolitik - Optionen für mehr Beschäftigung II, Frankfurt/New York: Campus Verlag, 267-296
Merz, J. and Jürgen Faik (1995), Equivalence Scales Based on Revealed Preference Consumption Expenditures- The Case of Germany, in: Jahrbücher für Nationalökonomie und Statistik, 425-447
Merz, J., Garner, Th., Smeeding, T.M., Faik, J. and D. Johnson (1994), Two Scales, One Methodo-logy - Expenditure Based Equivalence Scales for the United States and Germany, FFB-Discussion Paper No. 8, Department of Economics & and Social Sciences, Reserach Institute on Professions (FFB), University of Lüneburg, Lüneburg
Murphy, M. (1982), Comparative Estimates of the Value of Household Work in the United States for 1976; in: The Review of Income and Wealth, Vol. 28.
Nelson, Julie A. (1992), Methods of Estimating Household Equivalence Scales: An empirical Investigation; in: The Review of Income and Wealth, Series 38, Number 3, 295 – 310
Niemi, Iris (1993), Systematic Error in Behavioural Measurement: Comparing Results from Interview and Time Budget Studies, in: Social Indicators Research, 30, 229-44
OECD (1995), Organization for Economic Co-Operation and Development: Household production in OECD countries. Data sources and measurement methods, Paris.
Pollak, R. and T. Wales 1979, Welfare Comparisons and Equivalence Scales, in: American Economic Review, (Papers and Proceedings), 69, 216-21
Pyatt, Graham (1990), Accounting for Time Use; in: The Review of Income and Wealth, Vol. 36, No. 1, 33 - 52.
Ruggles, P. (1990), Drawing the Line: Alternative Poverty Measures and Their Implications for Public Policy, The Urban Institute Press, Washington, D.C.
Seel, B. (1988), Estimating Value Added by Household Production, in: Jahrbücher für Nationalökonomie und Statistik, 205/2, 97-115
Statistics Canada 1994, Proceedings of the International Conference on the Measurement and Valuation of Unpaid Work, Ottawa, Canada
Statistisches Bundesamt (1984 and various other years), Fachserie 15, Wirtschaftsrechnungen, Einkommens- und Verbrauchsstichproben, Heft 7, Aufgaben, Methode und Durchführung, Stuttgart und Mainz
Statistisches Bundesamt, Ergebnisse der laufenden Lohnstatistik für 1994; in: Wirtschaft und Statistik 4/95, 312 - 320
Appendix
Table 7a:
Economic well-being in inequality and poverty of market and
non-market work 1985 – All
Economic Well-Being Measure Market income
Market and non-market
income
GL SP NOC SE
Equivalence scale:
Official German social Assistance
Mean 1318,0 2032,8 2168,3 2550,0 1999,1
Median 1215,5 1976,6 2114,8 2468,9 1936,1
Inequality
Gini 0,2461 0,1742 0,1740 0,1907 0,1756
Theil (I=1) 0,1016 0,0507 0,0503 0,0592 0,0515
Atkinson 0,5 0,0499 0,0254 0,0253 0,0300 0,0258
Coefficient of Variation 0,476 0,324 0,321 0,347 0,327
90/10 Ratio 5,0 3,2 3,2 3,6 3,2
Quintiles
0 - ≤20 % 9,6 12,0 12,0 11,3 12,0
20 - ≤40 % 14,4 16,4 16,4 16,1 16,4
40 - ≤60 % 18,4 19,5 19,5 19,4 19,4
60 - ≤80 % 23,1 22,7 22,8 23,0 22,7
80 - ≤100 % 34,3 29,4 29,3 30,3 29,5
Poverty Rate of Persons (in percentage)
at 40 % of mean income 3,9 1,2 1,3 2,1 1,3
at 50 % of mean income 10,1 3,5 3,8 5,3 3,3
at 60 % of mean income 17,5 8,0 8,1 10,7 8,4
Elasticity of Scale 0,8196 0,8196 0,8196 0,8196 0,8196 Equivalence scale:
Consumption based ELES
Mean 1762,9 2751,5 2946,4 3454,1 2712,2
Median 1648,0 2697,6 2896,7 3340,3 2642,4
Inequality
Gini 0,2344 0,1792 0,1853 0,1967 0,1853
Theil (I=1) 0,0900 0,0523 0,0556 0,0619 0,0555
Atkinson 0,5 0,0451 0,0267 0,0284 0,0317 0,0282
Coefficient of Variation 0,436 0,323 0,331 0,350 0,333
90/10 Ratio 4,8 3,3 3,4 3,7 3,4
Quintiles
0 - ≤20 % 9,8 11,6 11,2 10,9 11,4
20 - ≤40 % 14,8 16,3 16,2 15,9 16,1
40 - ≤60 % 18,7 19,6 19,6 19,4 19,4
60 - ≤80 % 23,4 23,0 23,3 23,4 23,1
80 - ≤100 % 33,2 29,4 29,6 30,4 29,8
Poverty Rate of Persons (in percentage)
at 40 % of mean income 4,5 1,9 2,1 2,9 1,9
at 50 % of mean income 8,9 4,4 4,9 5,7 4,4
at 60 % of mean income 17,0 9,6 10,8 11,7 9,9
Elasticity of Scale 0,4692 0,4692 0,4692 0,4692 0,4692
GL: Market replacement costs with a global substitute; NOC: Net opportunity costs; SP: Market replacement costs with specialized substitutes;SE: Self evaluation.
Table 7b:
Economic well-being in inequality and poverty of market and
non-market work 1985 – Men
Economic Well-Being Measure Market income
Market and non-market
income
GL SP NOC SE
Equivalence scale:
Official German social Assistance
Mean 1341,2 2039,2 2181,3 2562,4 2001,2
Median 1229,5 1991,1 2136,0 2482,6 1942,4
Inequality
Gini 0,2489 0,1780 0,1766 0,1951 0,1796
Theil (I=1) 0,1063 0,0542 0,0530 0,0625 0,0552
Atkinson 0,5 0,0515 0,0270 0,0266 0,0316 0,0275
Coefficient of Variation 0,494 0,337 0,331 0,358 0,341
90/10 Ratio 5,0 3,3 3,3 3,8 3,3
Quintiles
0 - ≤20 % 9,7 11,8 11,8 11,1 11,7
20 - ≤40 % 14,2 16,3 16,3 16,0 16,3
40 - ≤60 % 18,2 19,5 19,6 19,3 19,4
60 - ≤80 % 23,2 22,7 22,8 22,9 22,7
80 - ≤100 % 34,6 29,6 29,4 30,6 29,7
Poverty Rate of Persons (in percentage)
at 40 % of mean income 3,9 1,5 1,5 2,5 1,5
at 50 % of mean income 10,2 4,0 4,2 6,0 3,5
at 60 % of mean income 18,4 8,8 8,8 11,3 9,3
Elasticity of Scale 0,8192 0,8192 0,8192 0,8192 0,8192 Equivalence scale:
Consumption based ELES
Mean 1820,8 2809,2 3015,6 3532,6 2763,2
Median 1700,0 2752,3 2955,8 3427,7 2686,7
Inequality
Gini 0,2255 0,1722 0,1768 0,1913 0,1784
Theil (I=1) 0,0848 0,0493 0,0515 0,0590 0,0525
Atkinson 0,5 0,0422 0,0251 0,0263 0,0302 0,0266
Coefficient of Variation 0,425 0,314 0,319 0,342 0,324
90/10 Ratio 4,5 3,2 3,3 3,6 3,3
Quintiles
0 - ≤20 % 10,1 11,8 11,6 11,1 11,6
20 - ≤40 % 15,0 16,6 16,5 16,0 16,4
40 - ≤60 % 18,8 19,6 19,7 19,5 19,5
60 - ≤80 % 23,2 22,9 23,1 23,4 23,0
80 - ≤100 % 32,8 29,0 29,2 30,0 29,4
Poverty Rate of Persons (in percentage)
At 40 % of mean income 3,3 1,6 1,7 2,8 1,8
At 50 % of mean income 7,6 4,3 4,7 5,6 4,5
At 60 % of mean income 15,8 9,2 9,7 11,1 9,6
Elasticity of Scale 0,4683 0,4683 0,4683 0,4683 0,4683
GL: Market replacement costs with a global substitute; NOC: Net opportunity costs; SP: Market replacement costs with specialized substitutes;SE: Self evaluation.