ISSN: 1992-8645 www.jatit.org E-ISSN: 1817-3195
ATTENUATION CORRECTION OF PET IMAGE
RECONSTRUCTED BASED ON DIRECT FILTERING OF THE
RAW DATA ACQUIRED USING MCNPX CODE
1M. SAEED, 2T. EL KHOUKHI, 3Y. BOULAICH, 4E. CHAKIR, 1H. BOUKHAL, 1T. EL
BARDOUNI
1
Radiations and Nuclear Systems Laboratory, University Abdelmalek Essaadi, Faculty of Sciences, Tetouan, Morocco
2
USE, CEN-Maamora, CNESTEN, Rabat, Morocco
3
UCR, CEN-Maamora, CNESTEN, Rabat, Morocco
4
LHESIR, Faculty of sciences, Ibn Tofail University, Kenitra, Morocco
E-mail: [email protected]
ABSTRACT
This paper presents the Monte Carlo simulation of the Positron Emission Tomography (PET) scanning technique using MCNPX code. The raw data generated by general MCNPX code contain a lot of unnecessary information for the image reconstruction process. This requires a large memory to store all this information. In order to reduce the needed memory, we introduce some modifications on the MCNPX code source in order to be able to write directly the important data representing the coincidence events detected by the detector pairs along the lines of response (LORs). These data are acquired as a result of launching two simulations on a uniform cylindrical positron emitter source in water-filled environment. Thereafter, from the object’s geometry, knowledge of the materials in this object and the acquired simulation data, the attenuation correction map has been calculated and applied to the acquired data during PET image reconstruction process.
Keywords: PET, MCNPX, Image reconstruction, Attenuation correction.
1. INTRODUCTION
Positron emission tomography (PET) aims to estimate the distribution of radiotracer in the patient by detecting the gamma photons which are produced following the positrons-electrons annihilations. Each annihilation gives two 511 keV gamma photons emitted on opposite directions. A lot of annihilations photons are lost due to the attenuation effect in the patient. The attenuation is summarized by the absorption of a number of emitted photons during their passage through an attenuated medium. Attenuation effect can be easily modeled along a line knowing the linear attenuation coefficient μ at each point in the medium and for the energy of 511keV. When these parameters are known, we only need to calculate the integral of μ along each LOR. Attenuation is one of the factors which affect to the PET acquired data, such as, scattered coincidences, random coincidences, dead time, variations in detector efficiencies between
ISSN: 1992-8645 www.jatit.org E-ISSN: 1817-3195 geometry object such as the phantom studied in this
work and for brain imaging. Transmission-based method relies on estimated the attenuation correction map by transmission scanning using external radionuclide sources. This method is used for heterogeneous and complex objects, for instance the chest imaging [7],[8].
Studying the characteristics of the medical imaging devices using the simulation codes provides an important reference to amelioration the performance of these devices. So this work focused to modeling PET scanner using a general Monte Carlo code in order to know how we can reach the data needed to reconstruction medical images and how this data can be corrected from the impact of attenuation with a view to get an accurate distribution of radiotracer in the object.
2. MATERIAL AND METHOD
2.1 Monte Carlo Simulation:
The Monte Carlo technique is one of numerical methods that allow solving complex problems by using pseudo-random numbers generated by computers. The MCNPX code is one of general codes which based on the Monte Carlo method to simulate the particle transport in matter. It is developed by LANL (Los Alamos National Laboratory). Between 1994 and 2011 its extended release, MCNPX, was developed [9],[10].
This study was conducted through several stages using MCNPX code. These stages are summarized as follow: 1) Including the material compositions, densities and different parameters detailed in the simulation input file. 2) Developing the MCNPX code source in order to obtain a new MCNPX executable file which will be used to run the simulation calculation.
2.2 Simulation Geometry And Materials:
In this study, MCNPX code version (2.7) has been used to simulate PET scan system. Our simulation is based on specific parameters of GEMINI TF scanner. The detection system is a ring shape with 644 detectors (28 block detectors, each block contains 23 LYSO crystals). The ring has a diameter of 90cm. Each detector is a parallelepiped of LYSO crystal, with dimensions of 4x4x22 mm3.
The studied phantom which is a cylindrical volume of water of 24 cm in diameter is placed in a supine position on the central axis of the detection
system. The phantom was simulated to be uniformly filled with positrons emitter source into the water-filled cylinder. This source emits positrons with energy equal to the energy emitted by 18F source (Figure 1).
Figure 1: The MCNPX Model Of PET System And The Cylindrical Phantom. (A) A Ring Contains 644 Crystals
Of LYSO,(B) Illustrates The Size Of Two Crystals Relatively To The Whole Geometry
2.3 PET Data Acquisition
There are two methods which allow arranging the coincidence events in PET before their reconstruction. The first method consists of storing the acquired data in a matrix called sinogram. Each matrix element represents the count of coincidence events that have been recorded for a specific LOR. The second method resides in the recording of the necessary information of each event such as the position, the energy and the detection time of each coincidence event. This information is then stored event-by-event in a list; this method is called list-mode. In this work all the information presented in the lines of responses has been registered using MCNPX code in a list-mode file called PTRAC file. This file is one of the output files of the MCNPX code. It contains the track of each particle and gives all the information on its behavior from the moment of its leaving the source until the last interaction. The raw format of the PTRAC file is complicated and very hard to analyze; however, it contains complete information on the primary and all the secondary particles.
ISSN: 1992-8645 www.jatit.org E-ISSN: 1817-3195 We consider reducing the needed memory by
[image:3.612.102.280.197.448.2]making our own modification in the MCNPX code source to be able to write only the required data directly without needing to store all information and then filtering it using an in-house program in order to obtain the image reconstruction data. Our modifications in the MCNPX code source are summarized on figure 2.
Figure 2: Flowchart Of Our Modifications In The MCNPX Code Source
2.4 Attenuation Correction
The function of the PET scanner is determining the distribution of radionuclide concentration by detecting the gamma photons emitted as a result of positron-electron annihilation in the body. Each annihilation gives two γ photons emitted in two opposite directions with energy of 511keV each. When γ photons pass through the material a certain number of them is absorbed by photoelectric effect after having or not undergone one or more Compton scattering (or Rayleigh scattering). The probability P of detecting two annihilation photons simultaneously is given in a simple form by:
[image:3.612.325.509.325.476.2]Where, μis the linear attenuation coefficient of the photons in the object.
Figure 3: Two Photons Detected By Two Different Detectors After Traversing a And b Thicknesses
Along The LOR.
Equation 1 shows that, the attenuation does not depend on the annihilation point, but it depends on the total dimension of the crossed object. All LORs are organized by regrouping them into sets of parallel projections. The set of all line integrals cutting the tracer distribution in a same given angle, but at different spatial positions, are called a parallel projection.
Figure 4: Translate The Activity Distribution f (x, y) To The Projection Data P (u, θ)
From the geometry shown in figure 4, the emission data collected for each projection can be represented by:
Where f (x, y) represents the radiotracer distribution in the object and the exponential term represents the attenuation along the LOR at the detector position u and projection angle θ. The inverse of this term is expressed as an attenuation correction factor:
ISSN: 1992-8645 www.jatit.org E-ISSN: 1817-3195 homogeneous phantom, we can calculate the
attenuation correction map by prior knowledge of its geometry and material composition, were µ(x,y)
=µwater = 0.096 cm-1 for 511 keV photons . The
multiplication of the attenuation correction map with the raw emission data gives corrected emission data. The corrected projections are then given by equation 4.
The distribution of radionuclide concentration represented by the function f (x, y) can be estimated from the corrected projection values PAC (u, θ) by using FBP algorithm [11].
3. RESULTS AND DISCUSSION
In this work, two simulations were performed using modified MCNPX code in order to write directly the necessary data for PET image reconstruction. These simulations are run through a cylindrical phantom filled with uniform positron-emitting source, which emits positrons with energy equal to the energy emitted by 18F source. The phantom is located at the center of the ring detector. The numbers of source particles treated in our simulations are 0.84x10⁹ and 1.68x10⁹ positrons. The objective of treating two numbers of positrons is to illustrating the difference in image quality when using a large and small number of positrons. All the information of annihilation photons is directly filtered by the modified MCNPX code and recorded as raw data in PTRAC files. The sizes of these files are reduced to about 10 MB instead of hundreds GB generally produced by the original MCNPX code and the simulation time is reduced by roughly 40%.
The image reconstruction process starts by organizing all LORs into a matrix of 322x321 elements. Each element in this matrix represents the counts of detected photons in a specific LOR. The attenuation correction map and the emission corrected sinogram are built following equations 3 and 4 respectively. These sinograms are plotted in figure 5.
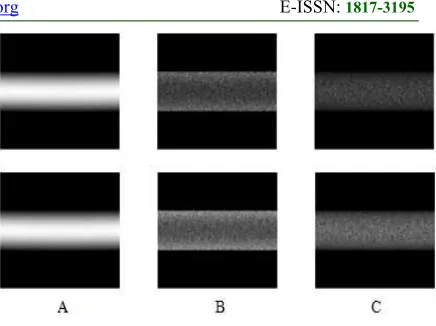
Figure 5: (A) Attenuation Correction Sinograms, (B) Emission Data Sinograms, (C) Corrected Data
Sinograms (Up NPS=0. 84x109 And Below NPS=1.68x10⁹)
Each sinogram can be efficiently reconstructed with the simple back-projection (SBP) and filtered back-projection (FBP) methods, where each sinogram data can be transformed via the inverse radon transform to obtain the final PET image. The image reconstruction steps are illustrated in the figure 6.
Figure 6: PET Image Reconstruction Flowchart
[image:4.612.314.532.78.241.2]ISSN: 1992-8645 www.jatit.org E-ISSN: 1817-3195
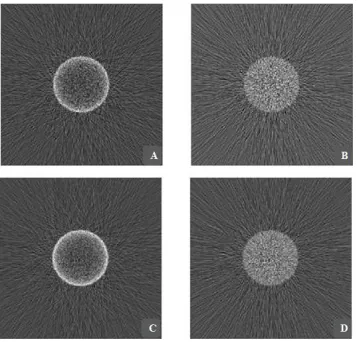
Figure 7: Simple Back-Projection Images. (A And C) Uncorrected Images, (B And D) Corrected
Images.
Figure 8: Filtered Back-Projection Images. (A And C) Uncorrected Images, (B And D) Corrected
Images.
visually, we can note clearly the improvement in the quality of images after attenuation correction, where the edges of uncorrected images look more intense than the centers of these images(A and C images); but the corrected images intensities seem uniformly distributed at all points of these images (B and D images).
Quantitatively, the results can be evaluated by plotting the line profile through the center of SBP images (The noise on SBP images is less than that on FBP images). The lines profiles illustrate the distribution of the activity in the phantom before and after attenuation correction; where, the central
regions appear less activity than other regions before attenuation correction (figure 9).
These profiles show the same trends as those known in the standard line profile of reconstructed PET images before and after attenuation correction [12].
Figure 9: (A) Profiles Of Simulation Data Showing Depression In Activity At The Uncorrected Images Center. (B) The Profiles Of Corrected Images. (Up
NPS=0.84x10⁹ And Below NPS=1.68x10⁹)
Also, the distribution of the image intensity which reflects the distribution of radiotracer concentration in the phantom can be evaluated quantitatively by calculating the variation of the intensity through several annular regions of interest ROIs along the radius of the FBP images before and after attenuation correction (FBP images are selected because it give a more accurate distribution of the radiotracer than SBP images due to the filtration which is applied to the projections data) . Each ROI has a radius of 5 pixels and it is completely adjacent to the neighboring ROI from the center to the edge (an example is shown in figure 10).
[image:5.612.320.509.175.341.2] [image:5.612.106.285.337.508.2] [image:5.612.366.483.588.705.2]ISSN: 1992-8645 www.jatit.org E-ISSN: 1817-3195 The average intensity of each ROI is shown in
figure 11 for NPS=0.84x10⁹ positron and in figure 12 for NPS=1.68x10⁹ positron.
Figure 11: Variation Of Intensity Value / Pixel In Annular ROIs Which Are Spread From The Center To The Edge Of the Uncorrected FBP Images (8A)
[image:6.612.91.299.343.478.2]And Corrected FBP Image (8B).
Figure 12: Variation Of Intensity Value / Pixel In Annular ROIs Which Are Spread From The Center To The Edge Of The Uncorrected FBP Images (8C)
And Corrected FBP Images (8D).
These figures illustrate the large deviation of the intensity from the edge to the center of each image before attenuation correction (●) but the intensity is almost uniformly distributed after attenuation correction (♦) especially in the image which is reconstructed for a largest number of positrons. The results of the two simulations (NPS=0.84x10⁹ and NPS=1.68x10⁹) show an improvement of images quality when a large number of positrons is used.
The validity of our development to MCNPX code source can be assessed by comparing the results which we reached using the direct filtering of the raw data acquired using MCNPX code with the results presented by Musarudin’s study [13]. There is a good agreement between these results.
4. CONCLUSION
The modification in the MCNPX code source provides an advantage to reducing the storage memory size which needed to store the raw data generated via this code. With this modification, the code becomes capable to write directly only the raw data related to the coincidence events and exclude the unnecessary data which related to escaped and attenuated photons. Due to the direct filtering of acquired data, the simulations can be performed whatever the number of source particles (positrons).
The reconstructed images show that the improvement in images quality after attenuation correction than that before attenuation correction. This improvement produced as a result of correcting the simulation data by using the attenuation map which is generated based on the phantom properties and the uncorrected images. This result shows the effectiveness of this method to improving the distribution of the radiotracer element in the phantom. But this method is only suitable for the object with a simple geometric form, as well as containing the homogeneous material. So we look forward in the coming study to correct the effect of the attenuation based on the transmission methods which are valid also for complex and heterogeneous objects.
5. ACKNOWLEDGEMENTS
The authors acknowledge all members of the Radiation and Nuclear Systems (RNS) laboratory specially the head of laboratory Prof. Dr. Tarek El Bardouni due to their contribution to the success of this work.
REFERENCES
[1] S. D. Wollenweber, “Parameterization of a model-based 3-D PET scatter correction,”
Nucl. Sci. IEEE Trans. On, vol. 49, No. 3, pp.
722–727, 2002.
[2] D. Brasse, P. E. Kinahan, C. Lartizien, C. Comtat, M. Casey, and C. Michel, “Correction methods for random coincidences in fully 3D whole-body PET: impact on data and image quality,” J. Nucl. Med., vol. 46, No. 5, pp. 859–867, 2005.
[3] M. E. Daube-Witherspoon and R. E. Carson, “Unified deadtime correction model for PET,”
Med. Imaging IEEE Trans. On, vol. 10, No. 3,
pp. 267–275, 1991.
ISSN: 1992-8645 www.jatit.org E-ISSN: 1817-3195
IEEE Trans. On, vol. 42, No. 4, pp. 1168–
1173, 1995.
[5] H. Zaidi and B. Hasegawa, “Determination of the attenuation map in emission tomography,”
J. Nucl. Med., vol. 44, No. 2, pp. 291–315,
2003.
[6] M. R. Ay and S. Sarkar, “Computed tomography based attenuation correction in PET/CT: Principles, instrumentation, protocols, artifacts and future trends,” Iran. J.
Nucl. Med., vol. 15, No. 2, pp. 1–29, 2007.
[7] T. Beyer, P. E. Kinahan, D. W. Townsend, and D. Sashin, “The use of X-ray CT for attenuation correction of PET data,” in Nuclear Science Symposium and Medical Imaging Conference, 1994., 1994 IEEE Conference
Record, 1994, vol. 4, pp. 1573–1577.
[8] G. Wagenknecht, H.-J. Kaiser, F. M. Mottaghy, and H. Herzog, “MRI for attenuation correction in PET: methods and challenges,”
Magn. Reson. Mater. Phys. Biol. Med., vol.
26,No. 1, pp. 99–113, Feb. 2013.
[9] “Los Alamos National Laboratory: MCNP
Home Page.” [Online]. Available:
https://mcnp.lanl.gov/. [Accessed: 10-Jan-2015].
[10] Denise B. Pelowitz, “MCNPXTM USER’S MANUAL Version 2.7.0.” Apr-2011.
[11] P. E. Kinahan, B. H. Hasegawa, and T. Beyer, “X-ray-based attenuation correction for positron emission tomography/computed tomography scanners,” Semin. Nucl. Med., vol. 33, No. 3, pp. 166–179, Jul. 2003.
[12] G. B. Saha, Basics of PET Imaging. New York, NY: Springer New York, 2010.
[13] M. Musarudin, M. I. Saripan, S. Mashohor, W. H. M. Saad, S. Hashim, and A. J. Nordin, “Preliminary results from attenuation correction for MCNP-generated PET image,”
IEEE-EMBS International Conference on
Biomedical Engineering and Sciences 2012,