i
MASTER THESIS
SIMULATING THE EFFECT OF
AN INTEGRATED
EMERGENCY POST IN
ENSCHEDE
Verification and application of a general and
flexible discrete-event simulation model
D.M. Koster
iii
SIMULATING THE EFFECT OF AN
INTEGRATED EMERGENCY POST IN
ENSCHEDE
Verification and application of a general and flexible discrete-event
simulation model
SEPTEMBER 2014
Author D.M. Koster, BSc Industrial Engineering and Management School of Management and Governance
External supervisor M.A. Bruens, MSc Acute Zorg Euregio
First internal supervisor dr. ir. M.R.K. Mes School of Management and Governance Department IEBIS University of Twente
v
Summary
Research motivation
In the Netherlands, it is possible to enter the emergency department (ED) without a referral from a general practitioner (GP). Due to this, many patients with a non-urgent demand for care register at the ED, which has a number of negative consequences. A possible solution for this is to form an integrated emergency post (IEP). This is an organizational model in which the general practitioners post (GP post) collaborates closely with the ED at the same location and with one common counter.
Currently, the ED of Medisch Spectrum Twente (MST) is not integrated with the local GP post, Huisartsendienst Twente-Oost (HDT-Oost). At the moment, MST is building a new hospital due to which there is a possibility to integrate the two organizations. However, they lack insight into the effect of integration on the patients, and on the processes that take place at the ED and the GP post.
Research objective
The objective of this research is twofold. The first objective is to gain insight into the effects of integrating the emergency department of MST and the GP Post of Enschede (HDT-Oost). This research especially focuses on logistical indicators of patient satisfaction (including length of stay). The second objective is to verify the general applicability of an existing discrete-event simulation framework for evaluating integrated emergency posts, that will be used in this research.
Method
The existing simulation model that will be used in this research to determine the effects of integration, is based on the IEP in Almelo. It is assumed that this model is general and flexible and that it can easily be adapted to other emergency departments. We verify this statement by using the simulation model in a different setting. Based on process and data analysis, we analyze the differences between the situation in Enschede and the situation in Almelo. Where necessary, we adjust the simulation model. After this, we will perform experiments to determine how an IEP can be organized in the most efficient way in Enschede.
Results
Table 1 shows the simulation results when moving from a non-integrated emergency post (NIP) to an integrated emergency post. Surprisingly, we see that the average length of stay (LOS) increases at both organizations.
Table 1
From a non-integrated emergency post to an integrated emergency post Non-integrated
emergency post
Integrated emergency post
Difference
LOS (min) LOS (min) Δ LOS** P-value
ED 117.73 154.46 31.20% 0.000*
GP post 12.27 15.79 28.65% 0.000*
vi Because stakeholders from both organizations are interested in how an IEP can be organized in the most efficient way, we composed several interventions that possibly contribute to a decrease in the average LOS of patients. These interventions are analyzed apart from each other. The interventions that have a significant, positive effect on the average LOS at (one of) the organizations in the separate analysis were: changing the division of labor (regarding the ED doctor), using a nurse practitioner (NP) at the GP post, adding an additional GP at the GP post, and the use of the same triage system. These interventions are combined to identify possible interaction effects. It appears that a combination of the interventions leads to a further decrease in the average LOS at both organizations (compared to the separate experiments). The outcome of the scenario that has the most potential to succeed is given in Table 2. This scenario is a combination of a changed division of labor, adding a NP at the GP post, and using the same triage system. If we compare this scenario to the NIP, it leads to a decrease in the LOS at the ED of 10.77%, and to a decrease in the LOS at the GP post of 19.71%.
Table 2
The best scenario compared to the NIP and the IEP
Outcomes Difference
NIP IEP IEP +*** NIP vs. IEP + IEP vs. IEP +
LOS (min) LOS (min) LOS (min) Δ LOS** P-value Δ LOS** P-value
ED 117.73 154.46 105.04 -10.77% 0.000* -31.99% 0.000*
GP post 12.27 15.79 9.85 -19.71% 0.000* -37.59% 0.000*
*Significant with α = 0.05;** Δ LOS = difference in LOS; *** IEP + = integrated emergency post + interventions
Conclusion
vii
Samenvatting
Aanleiding
In Nederland bestaat de mogelijkheid om zonder verwijzing naar de spoedeisende hulp (SEH) te gaan. Hierdoor melden veel patiënten met een niet-spoedeisende zorgvraag zich bij de SEH, wat negatieve consequenties heeft. Een mogelijke oplossing hiervoor is het vormen van een geïntegreerde spoedpost (IEP). Dit is een organisatiemodel waarbij de huisartsenpost (HAP) nauw samenwerkt met de SEH op dezelfde locatie, met één gemeenschappelijke balie.
Momenteel is de SEH van Medisch Spectrum Twente (MST) niet geïntegreerd met de lokale huisartsenpost, Huisartsendienst Twente-Oost (HDT-Oost). In de nieuwbouwplannen van MST bestaat de mogelijkheid om de twee organisaties te integreren. Echter, er mist inzicht in de effecten van een integratie op de patiënten en de processen die plaatsvinden op de huisartsenpost en de spoedeisende hulp.
Onderzoeksdoel
Het doel van dit onderzoek is tweeledig. Het eerste doel is om inzicht te verkrijgen in de effecten van integratie van de SEH van MST en de HAP Enschede van HDT-Oost. Hierbij wordt voornamelijk gekeken naar logistieke indicatoren voor patiënttevredenheid (waaronder doorlooptijd). Het tweede doel van dit onderzoek is het verifiëren van de generieke toepasbaarheid van een bestaand discrete-event simulatiemodel voor het evalueren van geïntegreerde spoedposten, dat gebruikt gaat worden in dit onderzoek.
Methode
Het bestaande simulatiemodel dat in dit onderzoek gebruikt gaat worden om de effecten van integratie te bepalen, is gebaseerd op de spoedpost in Almelo. Men veronderstelt dat dit model flexibel en generiek is en eenvoudig kan worden aangepast voor gebruik bij andere spoedposten. We verifiëren deze uitspraak door het simulatiemodel te gebruiken in een andere setting. Op basis van proces- en data analyse wordt gekeken waar de situatie in Enschede verschilt van de situatie in Almelo. Waar nodig wordt het simulatiemodel aangepast, waarna experimenten worden uitgevoerd om te bepalen hoe een geïntegreerde spoedpost het best kan worden ingericht in Enschede.
Resultaten
Tabel 3 geeft de resultaten weer wanneer wordt overgegaan van een niet-geïntegreerde spoedpost (NIP) naar een geïntegreerde spoedpost. Opmerkelijk is dat zowel de doorlooptijd voor de spoedeisende hulp, als ook de doorlooptijd voor huisartsenpost omhoog gaat bij integratie.
Tabel 3
Van een niet-geïntegreerde spoedpost naar een geïntegreerd spoedpost Niet geïntegreerde
spoedpost
Geïntegreerde spoedpost
Verschil
DLT (min) DLT (min) Δ DLT** P-waarde
SEH 117,73 154,46 31,20% 0,000*
HAP 12,27 15,79 28,65% 0,000*
viii Omdat belanghebbenden uit beide organisaties geïnteresseerd zijn in de wijze waarop een geïntegreerde spoedpost het best kan worden ingericht in Enschede, zijn er verschillende interventies opgesteld die mogelijk kunnen bijdragen aan een lagere doorlooptijd. Deze interventies zijn apart van elkaar geanalyseerd. De interventies die een significant, positief effect hebben op de gemiddelde doorlooptijd van (één van de) organisaties in de individuele analyse waren: het veranderen van de taakverdeling (m.b.t. de SEH-arts), het inzetten van een verpleegkundig specialist (VPS) op de HAP, het inzetten van een extra huisarts op de HAP en het gebruiken van hetzelfde triagesysteem. Deze interventies zijn gecombineerd om mogelijke interactie effecten te identificeren. Het blijkt dat een combinatie van de interventies leidt tot een verdere afname in de gemiddelde doorlooptijd van de organisaties (vergeleken met de afzonderlijke experimenten). De uitkomst van het scenario dat de meeste potentie heeft om te slagen is gegeven in Tabel 4. Dit scenario is een combinatie van het veranderen van de taakverdeling, het inzetten van een VPS op de HAP en het gebruiken van hetzelfde triagesysteem. Vergeleken met de NIP, leidt tot scenario tot een afname in de gemiddelde DLT op de SEH van 10,77% en tot een afname in de gemiddelde DLT op de HAP van 19,71%.
Tabel 4
Het beste scenario vergeleken met de NIP en de IEP
Uitkomsten Verschil
NIP IEP IEP +*** NIP vs. IEP + IEP vs. IEP +
DLT (min) DLT (min) DLT (min) Δ DLT** P-waarde Δ DLT** P-waarde
SEH 117,73 154,46 105,04 -10,77% 0,000* -31,99% 0,000*
HAP 12,27 15,79 9,85 -19,71% 0,000* -37,59% 0,000*
*Significant verschil met α = 0,05; ** Δ DLT = verschil in DLT; *** IEP + = geïntegreerde spoedpost + interventies
Conclusie
ix
List of abbreviations and definitions
DES Discrete-event simulation
EC Entrance complaint; complaint of the patient that is registered when the patient enters the ED.
ED Emergency department
ED self-referrals Patients who enter the ED without a referral
Existing simulation model The simulation model that is used at the integrated emergency post in Almelo
GP General practitioner
GP post General practitioners post
HDT-Oost Huisartsendienst Twente-Oost; a collaborating organization between general practitioners in Enschede and the surrounding areas, which provide out-of-hours urgent primary care.
IEP Integrated emergency post
Labeled patient A patient that is referred to a given specialism at the emergency department by a general practitioner (working at the GP post) or by an internal or external specialist.
LOS Length of stay; the time between the arrival of the patient and the departure of the patient.
MST Medisch Spectrum Twente; a level 1 trauma center located in the Netherlands.
New simulation model The simulation model that will be used in the analysis of Enschede.
NIP Non-integrated emergency post
NP Nurse practitioner; staff type at the GP post.
Out-of-hours care Care delivered from 5 pm to 8 am on workdays, from 5 pm on Friday to 8 am on Monday, and on national holidays.
x Secondary care Care for which a patient generally needs a referral by another health
care professional
Triage Process in which the urgency of the patient in determined
xi
Table of contents
Summary ... v
Samenvatting ... vii
List of abbreviations and definitions ... ix
Table of contents……….xi
Preface ... xiii
1 Introduction ... 1
1.1 Background ... 1
1.2 Project initiators ... 2
1.3 Research motivation... 3
1.4 Objective ... 4
1.5 Research questions ... 4
1.6 Research approach ... 5
1.7 Scope ... 6
2 Theoretical framework ... 7
2.1 Simulation ... 7
2.2 Simulation in health care ... 9
2.3 Simulation of emergency departments ... 10
2.4 Integrated emergency posts ... 11
2.5 Flexible simulation frameworks ... 12
2.6 Our contribution ... 13
2.7 Summary ... 13
3 Process and data analysis ... 15
3.1 Paths through a NIP ... 15
3.2 Arrival process ... 18
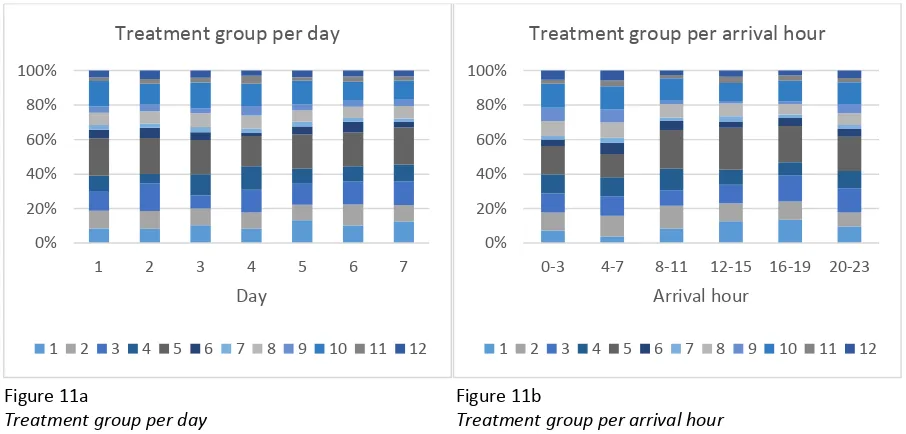
3.3 Patient groups ... 23
3.4 Resources ... 30
3.5 Sub processes at the NIP ... 32
3.6 From NIP to IEP ... 34
3.7 Summary ... 37
4 Conceptual model ... 39
4.1 Model explanation ... 39
4.2 Adjustments ... 42
xii
5 Simulation model ... 51
5.1 Overview... 51
5.2 Verification ... 52
5.3 Validation ... 53
5.4 Summary ... 56
6 Experimental settings and results ... 57
6.1 Performance indicators ... 57
6.2 Experimental design ... 57
6.3 Simulation settings ... 60
6.4 Results experiments and interaction effects ... 61
6.5 Sensitivity analysis ... 65
6.6 Summary ... 67
7 Discussion and conclusion ... 69
7.1 Conclusion ... 69
7.2 Discussion ... 71
xiii
Preface
Well, here it is, my final master thesis! The end product of seven months of research, but also the last piece for achieving my master’s degree in Industrial Engineering and Management at the University of Twente. The completion of this study, will also be the end of my 5-year study period.
Before I started studying, I wanted to do “something” in the health care sector. What this had to be exactly, I did not knew at that moment. After high school, I started studying Health Sciences. During this bachelor, I was introduced to health care logistics. I found this very interesting and this was the reason why I decided to do a master in Industrial Engineering and Management. In this study, I learned a lot about analyzing processes, finding bottlenecks, and optimizing processes in the health care sector. These are things that are, in my opinion, very interesting and at this moment I am pretty sure that I have found my “something” in the health care sector.
During lectures of the course simulation, which is part of the masters’ program, we have heard about a simulation model that was developed for the integrated emergency post in Almelo. At that moment, I found that subject very interesting. Therefore, I appointed my interests in simulation and in (acute) care in my search for a nice and challenging subject for my master thesis. Already soon, the subject “integration emergency department and GP post” was suggested to me. And now, nine months after applying for this subject, I completed the research.
I could not have performed this research without the help of some people, for which I would like to thank them. First, I thank Manon Bruens for the daily supervision and for answering all my questions. Second, I thank my supervisors from the University of Twente, Martijn Mes and Ingrid Vliegen, for the positive feedback during the execution of my research. Third, I thank the people involved from the ED and the GP post for the large amount of information that was needed as input for my research. Last, but definitely not least, I thank all the colleagues from Acute Zorg Euregio. I am convinced that the friendly and helpful working atmosphere had a positive effect on the results of this research.
I hope you will all enjoy reading this research.
Margo Koster
1
1 Introduction
Well-organized out-of-hours care is important for a properly functioning health care system. People all over the world are concerned with the quality, efficiency, and accessibility of it. The organization of out-of-hours care changed significantly during the last years. This thesis focuses on recent changes in the organization of out-of-hours care, and especially on the effects of integration of the emergency department of the hospital “Medisch Spectrum Twente” and the general practitioners post “Huisartsendienst Twente-Oost”.
This chapter is structured as follows. Section 1.1 gives a short background on the subject of this thesis. Section 1.2 describes the setting in which this research takes place. Sections 1.3 and 1.4 describe, respectively, the problem statement and the objective of the research. In Section 1.5 the research questions are formulated, after which the research approach is described in Section 1.6. This chapter ends with a description of the scope of this research in Section 1.7.
1.1 Background
During the last years, the organization of out-of-hours medical care has substantially changed in many countries. In the Netherlands, out-of-hours care is defined as care delivered from 5 pm to 8 am on workdays, from 5 pm on Friday to 8 am on Monday, and on national holidays (Grol, Giesen & Uden, 2006). Formerly, out-of-hours primary care was organized in small groups of general practitioners (GPs), who joined a rotating system. Around the year 2000, these small groups transitioned into large scale cooperatives of GPs, which we denote by a general practitioners post (GP post). These cooperatives vary with respect to the service area, the number of participating GPs, accessibility, and the distance from a hospitals’ emergency department (Uden et al., 2006; Giesen et al., 2006).
In the Dutch health care system, a patient who needs out-of-hours care has three options. One could either contact the (large scale) GP post, go to the hospitals’ emergency department (ED), or call the emergency number (112). In the Dutch health care system, the GP acts as gatekeeper to secondary care; patients need a referral from their GP in order to make use of hospital services. However, to attend an ED, a referral is recommended but not strictly needed. It appears that due to this, some patients skip the GP and directly go to the ED (Uden, Winkens, Wesseling, Crebolder & Schayk, 2003). This causes a shift from primary to secondary care, which has a number of negative consequences: confusion among patients, patients with non-urgent acute care at the ED, and cost-ineffectiveness in the delivery of out-of-hours care.
2 shows that this percentage is between 60 and 80% (Giesbers, Smits & Giesen, 2011; Klink, 2008). This leads to overcrowding at the ED and may lead to a decrease in the quality of care for more urgent cases (Moll van Charante & Bindels, 2008; Kool, Homberg & Kamphuis, 2008). The large number of self-referrals that wrongly utilize the expensive and specialized care offered at the ED leads to cost ineffectiveness in the emergency care. In addition, the providers of emergency care overlap each other, which lead to insufficient coherence and effectiveness in the emergency care.
1.2 Project initiators
This project is initiated by two organizations: ‘Medisch spectrum Twente’ (MST) and ‘Huisartsendienst Twente-Oost’ (HDT-Oost). This section outlines some key figures of both organizations.
MST
Medisch Spectrum Twente (MST) is one of the largest non-university hospitals in the Netherlands, and its core mission is promoting health of the people in the region. Basic care is the foundation of the delivered care, but MST also employs professionals with specialized knowledge/skills and has a number of special facilities for diagnosis and treatment (top clinical profile). Currently, the hospital consists of two hospital locations (Enschede & Oldenzaal) and two outpatient clinics (Haaksbergen & Losser), from which approximately 264,000 citizens are served. More key figures of MST are given in Table 5. MST is a level 1 trauma center, which means that it offers emergency care, multidisciplinary intensive care, and a wide range of specialisms 24 hours a day. The ED of MST treated 26,188 patients in the year 2013. Of these patients, 251 had a severe trauma. A patient is classified as a severe trauma when they had an Injury Severity Score (ISS) higher than 15 and were longer than two days admitted to the hospital, or died at the ED.
Table 5
Key figures MST (MST, 2012a; MST, 2012b; MST, 2013a; MST, 2013b)
2012 2013
Turnover € 347,567,237 € 359,302,000
Service area 264,000 citizens 264,000 citizens
Bed capacity 1070 1070
Staff employed, without medical specialists 2,668 FTE 2,669 FTE
Medical specialists, hiring & professionals 242 FTE 232 FTE
Outpatient visit 521,000 468,000
Day admissions 35,000 33,000
Clinical admissions 34,000 31,000
Nursing days 179,000 166,000
HDT-Oost
3
Table 6
Key figures HDT-Oost (HDT-Oost, 2012; HDT-Oost, 2013)
2012 2013
Service area 280,180 citizens 269,200 citizens
GPs 116 113
Triage assistants 40 41
Consults 72,964 70,594
1.3 Research motivation
Currently, there is a debate in the Netherlands on how to organize out-of-hours care and on the position and the role of GP cooperatives in the provision of out-of-hours care. The debate is strengthened by the desire to identify existing bottlenecks and to eliminate them (Uden, et al., 2006; NVZ, 2013). The main focus of the debate is on how to deal with the high number of self-referrals at EDs.
A possible solution to reduce the number of referrals at the ED, is to introduce payments for self-referrals with a need of primary care at the ED. Research has shown that this is an effective method. However, there is a possibility that self-referrals are deterred by payments in such a way, that they decide not to go to the ED even in acute or life-threatening cases (Reitsma & Jong, 2010). In addition, the Dutch minister of health states that such payments are undesirable. According to article 14, paragraph 2 of the Health Insurance Act, the care delivered at the ED is only reimbursed if it concerns acute care. So, officially primary (non-acute) care at the ED is not reimbursed, which makes it impossible to introduce payment for this kind of care. If one would like to introduce such a payment, primary care for self-referrals at the ED should be classified as insured care, by changing the Health Insurance Act. This is undesirable, because it means an extension of the basic package with unnecessary care (Schippers, 2013).
Another solution to reduce the number of self-referrals with a need of primary care at the ED, is by forming an integrated emergency post (IEP). This is an organizational model in which the GP collaborates closely with the ED at the same site. Such an IEP has several expected advantages, it would lead to: (i) a shift from secondary to primary care, (ii) a more efficient deployment of people and resources in the delivery of out-of-hours care, (iii) a higher employee satisfaction, (iv) an increased continuity of care through better coordination between health care providers, and (v) a higher patient satisfaction (Giesen, 2007). Kool, Homberg & Kamphuis (2008) filled this list with another expectation, namely a decrease in waiting-/ consultation times. Research shows that the introduction of such an organizational model does indeed have a positive effect on (some of these) factors (Kool, Homberg & Kamphuis, 2008; ZonMw, 2013). Due to the high number of positive effects of integration, this organizational model has many proponents, including the Dutch minister of health, the government, and many health care insurers. Many hospitals are currently thinking about integrating their ED with the local GP post.
4 patients, and on the processes that take place at the ED and the GP post. Therefore, they want to gain insight in the quantitative effects of integration on logistical indicators for patient satisfaction, and on indicators for organizational efficiency, before they take a decision whether to integrate or not.
1.4 Objective
The objective of this research is to gain insight into the effects of integrating the emergency department of MST and the GP Post located in Enschede (HDT-Oost). This research especially focuses on the effects of integration on the patients, and on the processes that take place at the ED and the GP post. The results of this research contributes to the decision whether the ED of MST and HDT-Oost should integrate or not. Besides, it contributes to the knowledge on how acute care in Enschede can be organized in a more efficient way. Due to this, this research has a high societal relevance.
In addition to the societal relevance, this research is also scientifically relevant. In this research, the second objective is to verify the general applicability of an existing discrete-event simulation framework for evaluating integrated emergency posts. In collaboration with the general hospital “Ziekenhuisgroep Twente” (ZGT) and the GP post “Centrale Huisartsenpost Almelo” (CHPA), University of Twente performed a research with the topic: “Optimal logistics and patient preferences in emergency care: the GP post and the emergency department in one integrated emergency post”. This research was funded by ZonMw, and focused on the effects of integration and how to optimally design an integrated emergency post, when taking into account patient preferences. Several theses and articles emerged from this large-scale study. One of the articles presents a general and flexible simulation model of the emergency department. Mes & Bruens (2012) state that this model can be adapted to other emergency departments as well as to other departments within a hospital. We verify this statement by using the simulation model in the urban area of Enschede, instead of the rural area of Almelo. If we need to make adjustments to the model, we try to keep these adjustments as generic as possible, such that the model is more broadly applicable.
1.5 Research questions
The main research question of this study is:
“What is the effect of integrating the general practitioners post of Enschede with the emergency department of MST, and in which way can the existing simulation model be used to correctly model the delivery of out-of-hours care in Enschede and to determine the effects of integration?”
To answer the main research question, we compose seven sub questions:
1. What is known in literature about simulation, simulation in health care, out-of-hours care, and simulation of out-of-hours care?
2. How is the current delivery of out-of-hours care in Enschede organized and how can it be modeled?
5 4. What changes need to be made in the existing simulation model in order to correctly simulate
the organization of out-of-hours care in Enschede?
5. On the basis of which performance indicators can the integrated model be compared with the non-integrated model?
6. What are the expected effects when integrating the emergency department of MST with the local GP post?
7. How can we efficiently organize the integrated emergency post in Enschede and how robust are these effects?
1.6 Research approach
This study analyses the expected effects of integrating the ED of MST with the local GP post (HDT-Oost), by making use of discrete-event simulation. The model described by Mes and Bruens (2012) serves as basis of this research. The conceptual model, developed for analysis of the IEP in Almelo, will be compared with the situation of Enschede and, if necessary, modified to make it usable for this research. We will examine the models’ robustness and generalizability and we make adjustments to the model where necessary.
The structure of this thesis is based on the 10-step approach of a simulation study as proposed by Law (2007). This approach is extended with a literature review, in order to make the 10-step approach applicable to this research. In addition, we defined the steps of Law in a different way, such that it matches with the proposed sub questions. The plan of approach is given in Figure 1.
Figure 1
Plan of approach
Formulate
problem Plan the study
Literature research
Process & data analysis
Conceptual model NIP
Conceptual model IEP
Simulate model NIP
Simulate model IEP
Analyze results
Document & present
Chapter 1 Chapter 2
Question 1
Chapter 3 Question 2 & 3
Chapter 4 Question 4
Chapter 5 Chapter 6
Question 5, 6 & 7
6
Data gathering & analysis
We perform a literature study to obtain relevant background knowledge on the subject of this research. The literature study starts with a top down strategy, in which we use several, well-defined search terms in several search engines. In order to obtain more relevant results, we use the bottom up strategy, in which we use the referenced and cited articles.
We obtain the information required for this research through process analysis and data analysis. Process analysis is performed by conducting stakeholder interviews and by performing observational research (and through the previous described literature study). Process analysis will be used for two purposes. First, to model the delivery of out-of-hours care in Enschede before integration. Second, to map the changes that occur through integration in order to model the situation after integration. Stakeholder interviews are also used to determine the key performance indicators which can be used to compare the non-integrated emergency post (NIP) and the IEP in Enschede. The quantitative data required for this research will be obtained from the hospital information system, and will be used as input for the simulation model as well as for validation. We use Microsoft Excel 2013 for the basic data analysis. For more advanced, statistical analysis of the data we use the program Minitab. This program is chosen because of its ease of use. The simulation of this research will be performed in discrete-event simulation software package Tecnomatix Plant Simulation version 10.1. This is the program in which the existing simulation model has been implemented.
1.7 Scope
In order to obtain focus in this study, it is important to introduce some restrictions and limitations. This study limits itself to modeling the processes at the ED and the GP post in Enschede. In the Section 1.2, it is described that the hospital MST consists of two hospitals, and two outpatient clinics. In this study we will only focus on the ED of the location Haaksbergerstraat in Enschede. The considered GP post is also located at this location.
Various processes in the hospital, but also outside the hospital, affect the course of events at the ED/ GP post. However, it is impossible to model all these processes. It would not fit within the given time frame, and the study will lose its focus. So, only the processes that actually take place at the emergency department/ GP post will be taken into account.
7
2 Theoretical framework
This chapter describes what is already known in literature about integrated emergency posts, simulation, and simulation of integrated emergency posts. It functions as a scientific foundation for this research. Section 2.1 describes the definition of simulation, and how and why it is used. Section 2.2 and 2.3 describe, respectively, studies in the field of simulation in health care and studies in the field of simulation of EDs. Section 2.4 gives a description of integrated emergency posts. Section 2.5 gives a description of general and flexible simulation frameworks. We end this chapter with our contribution to the literature in Section 2.6.
2.1 Simulation
Simulation is a computerized technique in which one imitates operations of various kinds of real-world facilities or processes. According to Law (2007), simulation can be defined as: “the creation of a model that represents a system, and using this model to better understand the system it represents.” Shannon (1998) defines simulation as: “the process of designing a model of a real system and conducting experiments with this model for the purpose of understanding the behavior of the system and/or evaluating various strategies for the operation of the system.”
Key components in both definitions of simulation are the words system and model. The studied facility or process in a simulation study is called a system. In order to scientifically study such a system, one have to make a set of assumptions about the working of the system. These assumptions constitute a model that is used to try to gain understanding of the studied system (Law, 2007).
There are more possible ways to explore a system, see Figure 2. First of all, one could experiment with the actual system. However, such experiments might be too costly or disruptive to a system. In addition, it is also possible that the system does not exist, but one might want to study the effect of a certain system or intervention in order to answer the question whether to build the system or not. For these reasons, it is desirable to make use of a model of the system. Then we could choose whether to build a physical model or a mathematical model. Most of the models build for engineering or management systems are mathematical models that represent a system in terms of logical and quantitative relationships. Such models are preferably solved in an analytical way. However, this is only
possible when an analytical solution is available and can be computed efficiently. When this is not possible, the system must be studied by means of simulation (Law, 2007).
Simulation models can be classified along three different dimensions. The first dimension is whether the simulation model is static or dynamic. A static simulation model is a representation of a system at a particular time, or one in which time plays no role. A dynamic simulation model represents a system
System
Experiment with the actual system
Experiment with a model of the system
Physical model
Mathematical model
Analytical
solution Simulation
Figure 2
8 as it changes in time. The second dimension is whether the model is deterministic or stochastic. A deterministic model is a model in which the components are predictable or which does not contain any probabilistic components. Stochastic models are models in which there are at least some random components. The third dimension is whether the simulation model is continuous or discrete. In a continuous model the state variables change continuously with respect to time. In a discrete model, the state variables change at separated points in time (Law, 2007).
Simulation modeling has several advantages. For some complex systems, an analytical mathematical model is infeasible, due to which simulation is the only possible method to use (Law, 2007). In addition, simulation models are easier to understand and to justify to management than analytical models (Shannon, 1998). Further, simulation enables us to estimate the performance of an existing system under specific operating conditions. Besides, it can be used to answer ‘what if’ questions, by experimenting with a new and unfamiliar system, or by comparing different proposed system designs. In these estimations and comparisons, the experimental conditions can be much better controlled than by making use of the actual system. The last advantage that we point out is that simulation allows us to control time. A system can be studied for several months or years in compressed time, or the detailed working of a system can be studied in expanded time (Law, 2007; Shannon, 1998).
The use of simulation also has some disadvantages. First, the investment required to set up a simulation study is high. It is expensive and time-consuming to develop a simulation model, and it requires specialized training. Second, due to the stochastic nature of the study, it will only provide estimates of the actual system. Therefore, these kind of studies are better in comparing alternative system designs than they are at optimization. The third disadvantage is that gathering reliable input data is sometimes difficult. This issue and the large volume of quantitative data produces by a simulation study often creates a tendency to put more confidence in the study results than is justified (Law, 2007; Shannon, 1998).
Steps in a simulation study
A sound simulation study consists of ten steps, which are represented in Appendix A. This 10-step approach is proposed by Law (2007). Other authors propose a different way of performing a simulation study. Banks & Carson (1988) add an eleventh step to the process, the implementation step. They state that this step is very sensitive to the involvement of the end user in the whole simulation process. Brailsford, Harper, Patel & Pitt (2009) state that the implementation of simulation models in health care operations research are still low. Eldabi & Paul (2001) have some critics on the existing modeling approaches. First, the approaches give too little attention to problem formulation, while this is the most important stage for problem understanding. Second, they state that data of health care systems is not reliable enough to serve as basis for a model. They proposed a Modeling Approach that is Participatory Iterative for Understanding (MAPIU). This approach is based on participatory modeling where stakeholders are involved in the complete modeling processes in an iterative way.
9 trace, allowing a comparison between the state of the simulated model with hand calculations to see whether the program is working as intended, 5) run the model under simplifying assumptions, 6) observe an animation of the simulation output, 7) compute the sample mean and sample variance for each simulation input probability distribution and compare them with the desired mean and variance, and 8) use a commercial simulation package to reduce the amount of programming required.
In the validation process, one determines whether a simulation model is an accurate representation of the system, for the particular objectives of the study (Law, 2007). Law describes several techniques which can be used for increasing the validity and credibility of a simulation model. These techniques are: 1) collect high-quality information and data on the system, 2) interact with the manager of a regular basis, 3) maintain a written assumptions document and perform a structured walk-through, 4) validate components of the model by using quantitative techniques, 5) validate the output from the overall simulation model, and 6) animation.
Besides the steps of validation and verification, there is also a process of establishing credibility. A model has credibility if the manager and other stakeholders accept it as correct (Law, 2007). Figure 3 shows the timing and the relationship between the steps proposed by Law and different processes.
Figure 3
Timing and relationship validation, verification, and credibility (Law, 2007)
2.2 Simulation in health care
Simulation is a widely accepted and powerful tool and is already applied in a variety of fields, such as manufacturing, military, and logistics. The application of simulation showed great potential to be accepted in health care facilities, which can also be seen from the significantly increased number of publications in the area of simulation in health care (Mustafee, Katsaliaki & Taylor, 2010; Fone et al., 2003). Literature reviews on the use of simulation in health care are published by the previously referred authors Mustafee et al. (2010) and Fone et al. (2003), and by Brailsford, Harper, Patel & Pitt (2009) and Mielczarek & Uzialko-Mydlikowska (2012). Brailsford et al. (2009) and Fone et al. (2003) took a wider view on modeling in health care and included also other modeling techniques than simulation. The reviews of Mustafee et al. (2010) and Mielczarek and Uzialko-Mydlikowska (2012) focused only on simulation modeling in health care.
Mustafee, Katsaliaki & Taylor (2010) have performed a literature study of the most relevant articles published in the area of health care simulation. They identified four simulation techniques commonly
System Assumptions document
Simulation program
“Correct” results available
Results used in
decision-making process
1, 2, 3 4 5, 6, 7, 8, 9 10
Validation
Establish credibility
10 used for simulation in health care, which we will explain shortly. The first technique is Monte Carlo simulation (MCS). This is a statistical technique that generates a value from a sequence of random numbers from a known probability distribution. This simulation technique is commonly used when it is impossible to calculate exact results by making use of fixed values or deterministic algorithms. The second technique is discrete-event simulation (DES). According to Law (2007), discrete-event simulation: “concerns the modeling of a system as it evolves over time by a representation in which the state variables change instantaneously at separate points in time.” DES is commonly used to model queuing systems. The third technique is system dynamics (SD), this is a modeling approach with a holistic system perspective that analyzes the behavior of a complex system over time. The fourth technique is agent-based simulation (ABS), which adopts a bottom-up approach by focusing on writing instructions that specify the behavior of the agents that make-up the real-world system, such that the actual system behavior arises as a results of the interactions of individual agents. These techniques are also mentioned by Brailsford, Harper, Patel & Pitt (2009) and Mielczarek & Uzialko-Mydlikowska (2012) as the most commonly used simulation techniques.
The simulation technique that is used in this research is discrete-event simulation. Also on this specific topic, there are a lot of literature reviews available. Examples of these are: Jacobson, Hall & Swisher (2006); Jun, Jacobson & Swisher (1999); Gunal & Pidd (2010); and Thorwarth & Arisha (2009). The most frequently described study objective areas of simulation in health care are patient flow and resource allocation. The former includes scheduling of patients and admissions, patient routing and flow schemes, and scheduling and availability of resources. The latter includes bed sizing, room sizing, staff sizing, and the planning of those resources (Jun, Jacobson & Swisher, 1999). The application areas of these kind of simulation studies are: 1) epidemiology, 2) health and care systems operation, 3) health and care systems design, 4) medical decision making, and 5) extreme events planning (Mielczarek & Uzialko-Mydlikowska, 2012).
2.3 Simulation of emergency departments
Discrete-event simulation is also often applied to simulate EDs. The objective areas on which these studies focus can be roughly classified into the two areas of the previous section. An example on the topic of patient flow is the study of Rossetti, Trzcinski & Syverud (1999), in which they analyzed how staffing at lower time of the day/week can be reduced to save expenditures and to increase staff utilization. Garcia, Centeno, Rivera & DeCario (1995) analyzed how to reduce the waiting times of low urgent patients. They concluded that the waiting times for those patients could be reduced by 25% by making use of a fast-track lane. Another, more recent example is the study of Wang, Li & Tussey (2012), they used simulation in order to analyze the patient flow and to determine the bottlenecks in reducing the length of stay of the patients. Abo-Hamad & Arisha (2013) performed a simulation study in which they analyzed the effect of several factors on patient throughput and ED efficiency. An example on the topic of resource allocation is the study of Komashie & Mousavi (2005), in which they experimented with several scenarios of varying the number of beds and the number of doctors.
11 some entities will be processed after their due date. This is not possible in an ED, because patients with a low priority cannot wait interminably for treatment. By making use of the conventional approach at the ED, patients with a high priority are always treated first. Due to this, low priority patients will be treated either outside the allowable time frame or not at all.
2.4 Integrated emergency posts
In the introduction of this report, we already mentioned that the organization of out-of-hours care in the Netherlands has substantially changed during the last years. A promising solution to tackle the bottleneck of the high number of self-referrals at the ED is to integrate an ED with a GP post. Fry (2009) performed a systematic review on the barriers and facilitators on the success and sustainability of after-hours care in Australia. By considering these factors in the organization of after-hours care, it could lead to a decrease in the demand of acute services, increased health outcomes, model sustainability, and a greater utility. These barriers and facilitators are also suitable in the Netherlands, and can be taken into account when considering changes in the organization of out-of-hours care.
Between the years 2002 and 2005, fourteen Dutch papers have been published with policy advices on the organization of emergency care. The conclusion of these papers all tend towards more cooperation and integration between GP posts and EDs. These conclusions are based on the belief that extensive cooperation can lead to more effective, efficient and coordinated emergency care. Extensive collaboration between GP posts and EDs can offer the following solutions to the existing bottlenecks (Vermue, Giesen & Huibers, 2007):
Clarity for the patient: the patient does not have to choose anymore between different health care providers, they are always at the right place.
Deflection of self-referrals from EDs to GP posts: the most complex and urgent patients are treated at the ED, and the less urgent patients at the GP post. Because less urgent patients are not treated at the ED anymore, the waiting times will decrease at the ED. In addition, unnecessarily costly care and medicalization of less urgent care will decrease.
Decrease of inefficient deployment: through integration there will no longer be two teams of health care providers working in parallel.
Increase in job satisfaction: the health care professionals working at the GP posts or the EDs can do the job for which they are trained.
Decrease in the cultural differences between the two organizations, as a result of more cooperation.
Decrease in discontinuity of care, as a result of the use of an electronic medical record. In addition, through better coordination of medical policies between the GP en the specialist, less errors will occur.
12 common triage point at which all self-referrals are triaged. After triage, the patients will either be referred to the GP or to the ED, depending on the severity of the symptoms of the patient.
During the last years, some integrated emergency posts (IEPs) have been established and in other regions they are preparing to establish such a service. A number of researchers have investigated the effects of an integrated emergency post. Kool, Homberg & Kamphuis (2008) investigated whether the expectations of an ED are actually realized. They concluded that there was indeed a shift from secondary to primary care and an increased patient satisfaction with telephone contact. However, there was no significant difference in patient satisfaction between the patients who visited an IEP and patients who visited a NIP. In addition, job satisfaction of employees working at an IEP was lower than the job satisfaction of employees working at a NIP. According to the authors, this is most likely due to the dramatic changes in the work processes.
In the framework of the ZonMw project about optimal logistics and patient preferences in the acute care chain, Visser (2011) designed a conceptual model of the IEP in Almelo. Based on this research, Mes and Bruens (2012) presented a generalized simulation model of an IEP. Two follow-up projects emerged from this research. Van der Linde (2012) used this model and analyzed the benefits of an IEP in Almelo. He made a comparison between the non-integrated emergency post (NIP) and the IEP. He concluded that due to integration, the waiting times and the workload at the ED post decreases, while the waiting time and the workload at the GP post increases. By introducing a nurse practitioner at the GP post in the weekend, the workload and the amount of overtime is reduced to a similar level as with a NIP. Overall conclusion of this study is that the IEP is preferred, based on a higher level of patient satisfaction, equal or reduced workload at both organizations, and a reduction in organizational overlap. Borgman (2012) analyzed several scenarios in order to optimize the IEP in Almelo. Examples of these scenarios are: weekend nurse practitioner replacement with a resident, treating low urgency ED patients in GP post rooms, using a single triage system, direct bed admission requests for ED patients that are likely to be admitted, and some other.
2.5 Flexible simulation frameworks
13 Sinreich & Marmor (2004) describe the foundation for the development of a simulation model for analyzing ED performance. They state that a simulation model must be simplified as much as possible, and that the simulation model has to be general, flexible, intuitive, simple to use, and it has to include default values for all system parameters. By using these principles, they state that the managements’ involvement and confidence in the simulation model will increase, and that the effort to develop a simulation model will decrease. For these reasons, they think that the use of simulation will increase. From the preceding section, in which we described some examples of generic simulation models, it appears that a generically built simulation model indeed can be adapted to other emergency departments without much effort. This shows the great advantage of a generic simulation model.
2.6 Our contribution
This aim of this study is to determine the effects of integrating the ED of MST with the local GP post. In determining this effect, the simulation model described by Mes and Bruens (2012) will be used. They state that the simulation model is flexible and general and can easily be adapted to other emergency department as well as to other departments within a hospital. By using it in a different setting, we will verify whether their statement is correct. If not, we will make adjustments in such a way that the model is more broadly applicable to other settings. So, the contribution of this work is twofold, 1) societal contribution, due to extension of knowledge on efficient organization of out-of-hours care, and 2) scientific contribution, due to the verification (and appropriate adjustments) of a flexible simulation framework for the analysis of IEPs.
2.7 Summary
15
3 Process and data analysis
This chapter describes the current situation at the GP post and the ED. We start with a description of the ways in which a patient can go through the non-integrated emergency post (NIP) in Enschede in Section 3.1. In Section 3.2, we describe the arrival process at the both organizations. In Section 3.3, the patient variables and the patient related dependencies are described. Section 3.4 describes the resources that are relevant for the processes at the GP post and at the ED, after which the sub processes at the GP post and the ED are described in Section 3.5. After the analysis of the current situation, a description follows of the changes that need to be made in the transition towards an integrated emergency post (IEP) in Section 3.6.
3.1 Paths through a NIP
In a non-integrated emergency post (NIP), the ED and the GP post work separately. Cooperation between the two organizations is limited to the referrals from the GP post to the ED. A patient can access the GP post in two ways: by calling, or by going to the GP post as a self-referral. When a patient calls the GP post, the GP assistant performs a telephonic triage to determine the urgency of the patient. Based on this urgency, the GP assistant determines the appropriate follow-up for the patient; there are four options:
When the symptoms of the patient are not urgent enough to schedule an appointment, the GP assistant gives the patient telephonic advice and the patient leaves the system.
If the complaints of the patient are urgent, he or she receives an appointment time for consultation at the GP post. The waiting time for this consultation is dependent on the urgency.
If the complaints of the patient are severe, the GP assistant sends the patient to the ED. This can be done in two ways: 1) the patient goes to the ED on his own or 2) the GP assistant sends an ambulance to the patient to transfer the patient to the ED.
Sometimes, it is impossible or medically not advisable for the patient to come to the GP post. However, if the patient does need acute primary care, the GP visits the patient at home to treat the patient there. If this treatment is sufficient, the patient stays home and leaves the system of the GP post. In some cases, the treatment is insufficient and the patient is send to the ED by ambulance.
In some cases, the patient directly goes to the GP post without calling. When the patient arrives at the GP post, the GP assistant performs a physical triage. Depending on the urgency of the symptoms, the patient gets one of the following follow-up options:
If the complaints are not urgent, the patient gets medical advice and goes home. The patient leaves the system.
If the patient needs acute medical care, he or she gets an appointment time for consultation. The waiting time for this consultation is dependent on the urgency.
16 If a patient receives an appointment time for consultation, it is intended that the patient is treated by a GP at the given time (or earlier, when it is quiet). The GP determines, based on the consultation, the correct follow-up for the patient. Again, there are several options:
The treatment and/or medical advice of the GP is sufficient, the patient goes home and leaves the system.
The GP assesses the symptoms as urgent and decides that the patient needs specialized care. The GP refers the patient to the ED and the patient leaves the system of the GP post.
In case the GP expects a fracture, an X-ray is made at the radiology department. If it turns out that there is indeed a fracture, the patient goes to the ED for further treatment. When it does not concern a fracture, the patient goes home and leaves the system.
We can also distinguish several options to enter and to leave the ED. A patient can access the ED in three ways:
The first way to enter the ED is as external referral. An external referred patient is a patient from which is known in advance that he or she is coming to the ED. The patient can be referred or by their GP, by an internal or by external medical specialist. Another option is that the patient comes to the ED by ambulance or helicopter and is pre notified. Also the police can refer a patient to the ED. And last, it is possible that the patient has telephonic contact with the ED prior to the visit.
The second option to enter the ED is as GP post referral. This is only possible outside office hours. A GP post referral can directly come from the GP post or may end up at the ED after X-ray.
The third option to enter the ED is as a self-referral. These patients skip the GP (post) and directly go the ED. Sometimes this is a fair choice, but this does not apply to all self-referrals.
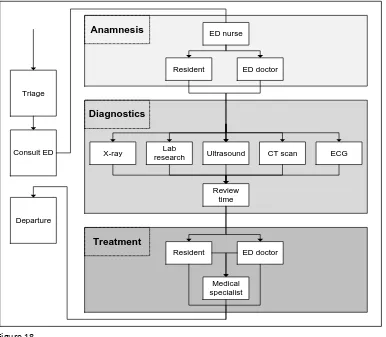
All the patients coming to the ED follow broadly the same path. The first step is a physical triage of the patient in which the urgency is determined on the basis of the complaints. After triage, the patient has to wait for further examination. This waiting time is dependent on the urgency of the patient and the resource availability at the ED. After triage, further diagnostic test are performed in order to determine the diagnosis. When the diagnosis is known, the patient receives the appropriate treatment.
The patient can leave the ED in three ways:
The patient is going home, with or without a follow-up consultation.
The patient is admitted to the acute admission ward or another hospital ward for further treatment.
The patient is transferred to another hospital.
17
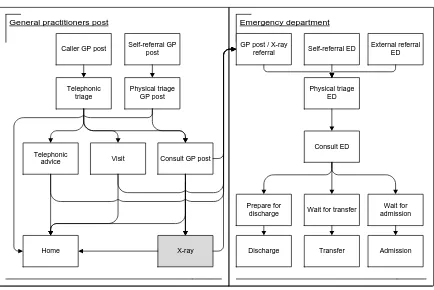
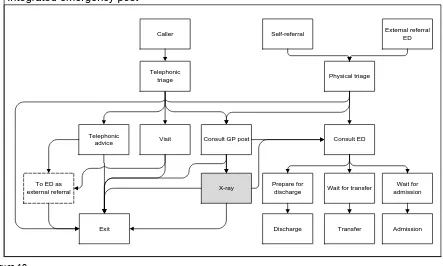
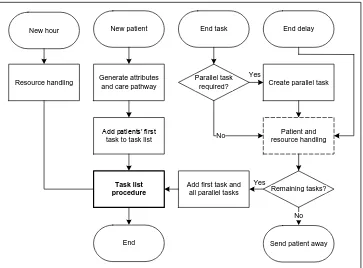
Figure 4
[image:31.595.88.522.107.397.2]Flowchart non-integrated emergency post
Table 7
Paths through a non-integrated emergency post
Group Path
A1 Self-referral ED –ED
A2 Self-referral GP post – physical triage GP post – home
A3 Self-referral GP post – physical triage GP post – consult GP post A4 Caller GP – telephonic triage GP post – telephonic advice – home A5 Caller GP – telephonic triage GP post – (telephonic advice) – ED A6 Caller GP – telephonic triage GP post – visit – home
A7 Caller GP – telephonic triage GP post – visit – ED A8 Caller GP – telephonic triage GP post – consult GP post
Group Path
X External – ED
Group Path
B1 Consult GP post – home B2 Consult GP post – X-ray – home B3 Consult GP post – X-ray – ED B4 Consult GP post – ED
Group Path
C1 ED – triage – consult ED – home C2 ED – triage – consult ED – transfer C3 ED – triage – consult ED – admission
Caller GP post Self-referral GP post
External referral ED Self-referral ED
Visit Telephonic
advice
Physical triage ED
Consult GP post
Consult ED
X-ray Discharge Admission Wait for admission
Transfer Wait for transfer
Home
Physical triage GP post Telephonic
triage
Prepare for discharge
General practitioners post Emergency department
Non-integrated emergency post
18
3.2 Arrival process
Employees from both the GP post and the ED indicate that certain hours are busier than others. For example, GP post employees indicate that it is busier early in the evening than during the night. ED employees designate the hours in the late afternoon as busy hours. Furthermore, it appears that certain days are busier than other days. Employees from both organizations state Monday and Friday as busy days, and Tuesday and Wednesday as relative quiet days. Following these statements, we analyze historical data in order to identify such patterns. In addition, we determine the underlying statistical distribution of the arrivals by which we can correctly model the arrivals.
Inspired by Visser (2011), we look at three factors when analyzing the arrivals at the GP post and the ED. These factors are defined as follows:
Hour factor The hour factor is the average number of arrivals per hour. By determining the hour factor for each hour of the day, one can identify an arrival pattern. One the basis of this arrival pattern one can distinguish the busy hours from the quiet hours on a day. Day factor The day factor indicates whether a particular day is busier than any other day in the
week. The day factor refers to the total number of arrivals at a particular day. A day factor is calculated by dividing the number of arrivals on day d by the average number of day arrivals in week w.
Week factor The week factor refers to the total number of arrivals in a certain week. On the basis of this week factor a possible seasonal effect can be identified. A week factor is calculated by the number of arrivals in week w of the year y divided by the average number of arrivals per week in year y.
For both the day factor and the week factor, it holds that a factor of one indicates an average day or week in terms of the number of arrivals, a factor of smaller than one indicates a quieter day or week compared to the average, and a factor of greater than one indicates a busier day or week compared to the average.
3.2.1 Assumptions
We assume that the arrival of patients at the ED and the GP post follows a Poisson distribution. This means that the number of arrivals in a time interval of length s is a random variable with parameter . The Poisson distribution is most commonly used to model the arrival process of customers to a queuing system. A stochastic process is said to be Poisson if (Law, 2007):
Customers arrive one at a time.
The number of arrivals in a time interval is independent of the number of arrivals in an earlier time interval.
The number of arrivals is independent from the time of the day.
The first two properties also apply to arrivals at the ED and the GP post. The last property is violated by many real-life arrival processes, as well as the arrival processes of our interest. However, when one takes a relatively short time interval (1- or 2-hour), the arrival rate is reasonably constant over this interval and the Poisson process is a good model for the process during this interval. This is the reason why we set the length of the time interval t at 1-hour. The number of arrivals in this time interval is a random variable with parameter . The average number of arrivals differ per hour, per day, and per week. So, the number of arrivals in s can be expressed by h,d,w. This parameter is given by the following
19
h,d,w = αh * βd * γw
h,d,w The number of arrivals at hour h, at day d, in week w
αh Average number of arrivals at hour h; h ∈ 1, .., 24
βd Day factor for day d; d ∈ 1, .., 7
γw Week factor for week w; w ∈ 1, .., 52
According to professionals from the GP post and the ED, the arrival pattern is not identical for each day of the week. Therefore, we assume that the hour factor is dependent on the day of the week. As a consequence of this assumption, αh is replaced by αh,d, in which d ∈ 1, .., 7.
Now, we can come up with a formula which allows us to model the arrivals of the GP post and the ED. Because the GP post and the ED are two separate organizations, we determine the values of the above variables for the two organizations separately. Therefore, we draw two formulas. The meaning of the variables are equal to the description above. The variables with a G in superscript are applicable to the GP post, the variables with an E in superscript are applicable to the ED.
G
h,d,w = αGh,d * βGd * γGw
E
h,d,w = αEh,d * βEd * γEw
3.2.2 Arrivals GP post
In this section we perform a historical data analysis in order to determine the values of αG
h,d, βGd, and
γG
w. For the analysis of the arrivals of the GP post, we used data from all full weeks of 2012 and 2013.
National holidays are excluded from the analysis, because we want to base the analysis on regular days.
First, we determine the values of the hour factors αG
h,d. Based on visual judgement, we assume that all
weekdays have the same arrival pattern, i.e. they have the same busy and quiet days (see Figure 5). In the weekends, the GP post is also opened between 08:00 am and 17:00 pm. Therefore we use a different arrival pattern for Saturday and Sunday. Besides, we split up the analysis of Saturday and Sunday, because we see another arrival pattern on those days (see Figure 5). We separately calculate the hour factors for the weekdays, for Saturday, and for Sunday. The results are given in Table 43 in Appendix B.
Figure 5
20 The next step is to determine the day factors for the GP post. The days are compared by making use of two sample student’s t-tests. The results of the tests are given in Table 8. We see that Monday and Friday are significantly different from every other day, when we use a significance level α of 0.05. Monday and Friday are also significantly different from each other. From these observations we assume that Tuesday, Wednesday, and Thursday are not significantly different regarding to the number of arrivals. Monday and Friday have different underlying arrival distributions. Because we use a separate hour factor for Saturday and for Sunday, we base the day factor of these days on the average arrivals on that specific day.
Table 8
P-values two sample t-test weekdays GP post
Tuesday Wednesday Thursday Friday
Monday 0.024* 0.008* 0.003* 0.000*
Tuesday - 0.681 0.380 0.000*
Wednesday - - 0.620 0.000*
Thursday - - - 0.000*
* Significant difference with α = 0.05
The underlying distribution of the day factors are determined by making use of the software package Minitab version 16. The day factors are tested to the Normal, Lognormal, Exponential, Weibull, and the Gamma distribution, by making use of the Anderson-Darling test. The outcomes of this test are given in Table 44, Appendix B. The chosen distributions for the days are given in Table 9, with the corresponding histogram in Figure 36, Appendix B.
Table 9
Underlying distributions day factors GP post
Day of the week Distribution P1 P2
Monday Normal 1.0022 0.1300
Tue-Thu Normal 0.9500 0.1473
Friday Lognormal 1.1440 0.1912
Saturday Lognormal 1.0000 0.1124
Sunday Lognormal 1.0000 0.1234
Normal: P1 = mean, P2 = standard deviation; Lognormal: P1 = mean, P2 = standard deviation
21
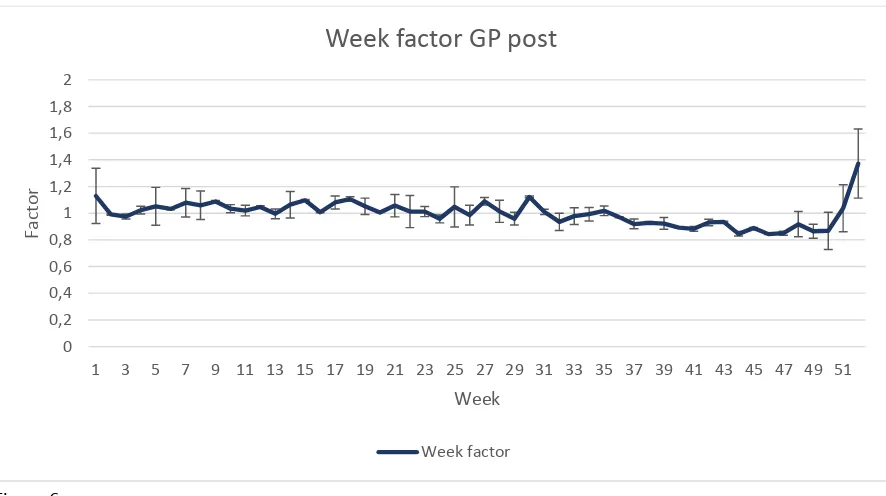
Figure 6
Average week factors GP post (n = 104)
The best fitting underlying distribution for the week factor of the GP post is also determined by making use of the Anderson-Darling test in Minitab. The outcomes of this test are given in Table 45 in Appendix B. The best fitting distribution for the week factors at the GP post is a lognormal distribution with a P-value of 0.111. The corresponding parameters are given in Table 10, the corresponding histogram is given in Figure 37, Appendix B.
Table 10
Distribution week factors GP post
Week Distribution P1 P2
1-52 Lognormal 1.0000 0.1118
Lognormal: P1 = mean, P2 = standard deviation
3.2.3 Arrivals emergency department
In this section, we continue the historical data analysis in order to determine the values of αE h,d, βEd,
and γE
w. We use the same methodology as for the GP post arrivals. However, this analysis uses a smaller
data set. Before September 2013, all patients from internal medicine were treated by their own private acute care unit. However, from September 2013, these patients were treated at the ED. Due to this change, the number of arrivals at the ED changed. Because these patients will also be treated at the ED in the future, we base the analysis of the arrivals at the ED on data from September 2013. Again, national holidays are excluded from the analysis.
First, we analyze the arrival pattern for all days of the week. Based on visual judgement of Figure 7, we assume that the arrival patterns for the weekdays are the same. Saturday and Sunday have the same arrival pattern, but this arrival pattern differs from the arrival pattern of the weekdays. So, we use one hour factor for the weekdays, and one for the weekend. The hour factors for the weekdays and for the weekend are given in Table 46 in Appendix B.
0 0,2 0,4 0,6 0,8 1 1,2 1,4 1,6 1,8 2
1 3 5 7 9 11 13 15 17 19 21 23 25 27 29 31 33 35 37 39 41 43 45 47 49 51
Facto
r
Week
Week factor GP post
22
Figure 7
ED arrivals per hour
Next, we determine the day factors for the ED. By making use of a student t-test in the comparison of the weekdays, we see that Monday is significantly different from Tuesday and Thursday, but not from Friday (see Table 11). There is no significant difference between Tuesday and Thursday. Wednesday does not significantly differ from any other weekday. Because the p-values for the difference between Tue-Wed and Thu are higher than the p-values for the difference between Mon-Wed and Wed-Fri, we classify Wednesday to Tuesday and Thursday. If we compare Saturday and Sunday, it appears that they are not significantly different (P-value = 0.577). Based on this, we assume that the following days are not different with regard to the number of arrivals: Monday and Friday; Tuesday, Wednesday, and Thursday; Saturday and Sunday.
Table 11
P-value t-test weekdays ED
Tuesday Wednesday Thursday Friday
Monday 0.011* 0.071 0.0250* 0.945
Tuesday - 0.568 0.851 0.006*
Wednesday - - 0.711 0.054
Thursday - - - 0.017*
* Significant difference with α = 0.05
Again, the underlying arrival distributions of the day factors are determined by making use of the Anderson-Darling test in Minitab. The outcomes of this test are given in Table 47, Appendix B. The chosen distributions for the days are given in Table 12. The corresponding histograms are given in Figure 38, Appendix B.
Table 12
Distribution day factors ED
Day of the week Distribution P1 P2
Mon & Fri Lognormal 1.0600 0.1246
Tue-Thu Normal 0.9584 0.1172
Sat & Sun Normal 1.0000 0.1238
Normal: P1 = mean, P2 = standard deviation; Lognormal: P1 = mean, P2 = standard deviation