ORIGINAL RESEARCH
PEDIATRICS
Comparing 3T T1-Weighted Sequences in Identifying
Hyperintense Punctate Lesions in Preterm Neonates
D. Tortora, V. Panara, P.A. Mattei, A. Tartaro, R. Salomone, S. Domizio, A.R. Cotroneo, and M. Caulo
ABSTRACT
BACKGROUND AND PURPOSE: The loss of contrast on T1-weighted MR images at 3T may affect the detection of hyperintense punctate lesions indicative of periventricular leukomalacia in preterm neonates. The aim of the present study was to determine which 3T T1-weighted sequence identified the highest number of hyperintense punctate lesions and to explore the relationship between the number of hyperintense punctate lesions and clinical outcome.
MATERIALS AND METHODS: The presence of hyperintense punctate lesions was retrospectively evaluated in 200 consecutive preterm neonates on 4 axial T1-weighted sequences: 3-mm inversion recovery and spin-echo and 1- and 3-mm reformatted 3D-fast-field echo. Statistically significant differences in the number of hyperintense punctate lesions were evaluated by using a linear mixed-model analysis. Logistic regression analysis was used to assess the relation between the number of hyperintense punctate lesions and neuromotor outcome at 3 months.
RESULTS:Thirty-one neonates had at least 1 hyperintense punctate lesion indicative of periventricular leukomalacia in at least 1 of the 4 sequences. The 1-mm axial reformatted 3D-fast-field echo sequence identified the greatest number of hyperintense punctate lesions (P⬍ .001). No statistically significant differences were found among the 3-mm T1-weighted sequences. The greater number of hyperintense punctate lesions detected by the 1-mm reformatted T1 3D-fast-field echo sequence in the central region of the brain was associated with a worse clinical outcome.
CONCLUSIONS: At 3T, the 1-mm axial reformatted T1 3D-fast-field echo sequence identified the greatest number of hyperintense punctate lesions in the central region of preterm neonate brains, and this number was associated with neuromotor outcome.
ABBREVIATIONS:FFE⫽fast-field echo; IR⫽inversion recovery; HPL⫽hyperintense punctate lesion; ICC⫽intraclass correlation coefficient; PN⫽preterm neonate; PVL⫽periventricular leukomalacia; SE⫽spin-echo
P
eriventricular white matter injury is a major form of brain damage and the leading cause of chronic neurologic disability in survivors of preterm births.1,2Periventricular white matterin-jury includes a spectrum of cerebral damage that ranges from focal necrotic lesions (periventricular leukomalacia [PVL]) to dif-fuse myelination disturbances (difdif-fuse periventricular white matter injury).3-5PVL is pathologically characterized by foci of
coagulation necrosis in the periventricular white matter, which results in degeneration of cellular elements and, in particular, the premyelinating oligodendrocytes. The physiopathologic mechanism underlying PVL remains an important unresolved question.6
Classic MR imaging signs of PVL are hyperintense punctate lesions (HPLs) on T1-weighted sequences, which infrequently may also appear hypointense on T2-weighted images.7More
se-vere presentations of PVL are either cavitation (cystic PVL) or glial scars and may be accompanied by a conspicuous reduction in white matter volume and ventricular enlargement.5The causes
determining the shortening of T1 and T2 signals in punctate PVL have not been completely established. Some authors hypothesized that signal shortening was determined by the presence of focal hemorrhages. Other studies hypothesized that the characteristic hyperintense signal on T1-weighted sequences was due to the contemporary presence of hemosiderin deposition, lipids from myelin breakdown, and dystrophic calcifications.7
Received March 10, 2014; accepted after revision August 14.
From the Radiology Unit (D.T., V.P., A.R.C., M.C.), Ophthalmology Clinic (P.A.M.), and Neonatology and Neonatal Intensive Care Unit (R.S., S.D.), University Hospital of Chieti, Chieti, Italy; and ITAB-Institute of Advanced Biomedical Technologies (D.T., V.P., A.T., M.C.) and Department of Neuroscience and Imaging (A.T., A.R.C., M.C.), University “G. d’Annunzio” of Chieti, Chieti, Italy.
Preliminary results previously presented at: Annual Meeting of the European Con-gress of Radiology, March 7-11, 2013; Vienna, Austria.
Please address correspondence to Massimo Caulo, MD, PhD, ITAB-Institute of Ad-vanced Biomedical Technologies, University “G. d’Annunzio,” Via Dei Vestini 33, 66100 Chieti, Italy; e-mail: [email protected]
Preterm children with PVL present a high incidence of neuro-developmental disabilities such as cerebral palsy; mental retarda-tion; and psychologic, developmental, behavioral, and emotional disorders.8Currently, an accurate method of identifying all
pre-term neonates (PNs) at risk of poor developmental outcome is not available, to our knowledge. Clinical risk factors, cranial sonography, and electroencephalography are used to study PNs around birth but are not optimal predictors of long-term out-come.9,10MR imaging can provide prognostic information
con-cerning neuropsychological development. For example, PNs with a greater number of HPLs at MR imaging subsequently presented a worse motor and neurocognitive outcome. More specifically, the presence of HPLs in white matter regions traversed by the motor pathway was shown to be a useful predictor of motor out-come.11,12However, the use of MR imaging to screen PNs has
been relatively limited because of the availability of the MR imag-ing systems, the complex management of neonates, and, above all, the low prognostic accuracy when no lesions are identified.13,14
To date, most MR imaging studies on PVL were performed by using MR imaging systems operating at 1.5T or lower field strengths. Liauw et al15concluded that the spin-echo (SE)
T1-weighted sequence scored best for detecting the presence of HPLs. Recently, the benefits from the improved signal-to-noise ratio and higher spatial resolution of MR imaging systems operating at 3T indicated the potential of this high magnetic field system for studying the neonatal brain, though the elongation of the T1 re-laxation time at higher magnetic field strengths16may bias the use
of 3T scanners in preterm neonates due to the potential reduction of the sensitivity of T1 images for identifying HPLs.
The aim of the present study was to determine which 3T T1-weighted sequence identified the highest number of HPLs in PNs studied at term-corrected age and to explore the relationship be-tween the number/location of HPLs and the clinical outcome.
MATERIALS AND METHODS
Patients
The institutional review board approved our retrospective study and waived informed consent. The brain MR imaging acquisi-tions of 200 consecutive PNs acquired from January 2010 to De-cember 2012 within 5 days of term-corrected age as part of an ongoing screening of premature neonates (study approved by the Ethics Committee of “G. D’Annunzio” University of Chieti and Azienda Sanitaria Locale n.2 of Lanciano-Vasto-Chieti) were in-cluded in this study. Parents or legal guardians of the neonates always gave written informed consent to the MR imaging study.
Neuromotor Outcome
Neurologic examinations of the PNs were routinely performed at 3 months of corrected age by a pediatric neurologist who assigned the
infant to 1 of the 3 following groups, according to the classification of development by the World Health Organization: 1) “normal” (nor-mal neurologic examination findings); 2) “mildly abnor(nor-mal” (mild hypertonia, hypotonia, and/or asymmetry); and 3) “definitely ab-normal” (cerebral palsy).17 Results were obtained from patient
records.
MR Imaging
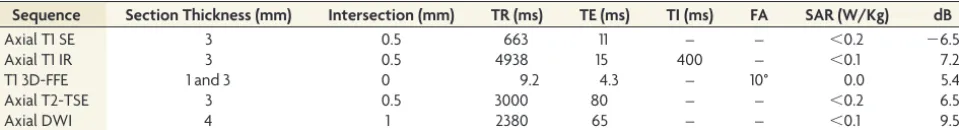
MR imaging was performed by using a 3T whole-body system (Achieva 3.0T X-Series; Philips Healthcare, Best, the Netherlands) with a dedicated 8-channel head coil. Neonates were fed and se-dated with 10-mg oral chloral hydrate per kilogram of body weight. During the scan, the neonates were laid in a supine posi-tion and swaddled in blankets. Molded foam was placed around the body of the neonate to minimize head movement. Ear protec-tion was always used and consisted of commercially available neo-natal earmuffs (MiniMuffs; Natus Medical, San Carlos, Califor-nia) and adapted ear-canal plugs. Heart rate and oxygen saturation were monitored during the MR imaging study by an experienced intensive care neonatologist. All neonates underwent the same MR imaging protocol. Details of the MR imaging se-quences are reported in Table 1.
MR Image Analysis
Phase 1. Two neuroradiologists, with 15 and 5 years of experience in neonatal neuroimaging, reviewed, in consensus, the MR imag-ing studies of the 200 neonates. They performed a preliminary image-quality assessment of the acquired sequences by using a 3-point scale (0, nondiagnostic images; 1, diagnostic image with limitations; and 2, fully diagnostic). Assessed parameters included general visual image quality, image noise, and the presence of artifacts. Only MR imaging sequences with scores of at least 2 were included in subsequent analyses.
Phase 2. Four weeks later, the same 2 neuroradiologists indepen-dently reviewed the MR imaging studies selected in phase 1. They focused on the presence of HPLs on the 4 T1-weighted sequences (3-mm axial SE, 3-mm axial inversion recovery [IR], and 3- and 1-mm axial reformatted 3D-fast-field echo [FFE]). An HPL was defined as a hyperintense punctate lesion on T1 with a diameter of
⬍5 mm that did not necessarily present a corresponding de-creased signal intensity on T2-weighted images.
A standardized system of visual assessment was used. The 2 readers, blinded to neonate identity, clinical history, and gesta-tional age at birth, used a workstation equipped with a profes-sional DICOM viewer (OsiriX Imaging Software; http://www. osirix-viewer.com). They evaluated the T1-weighted sequences for the following characteristics: 1) number of HPLs, 2) location: anterior to the frontal horn of the lateral ventricles (anterior
re-Table 1: MRI sequence parameters
Sequence Section Thickness (mm) Intersection (mm) TR (ms) TE (ms) TI (ms) FA SAR (W/Kg) dB
Axial T1 SE 3 0.5 663 11 – – ⬍0.2 ⫺6.5
Axial T1 IR 3 0.5 4938 15 400 – ⬍0.1 7.2
T1 3D-FFE 1 and 3 0 9.2 4.3 – 10° 0.0 5.4
Axial T2-TSE 3 0.5 3000 80 – – ⬍0.2 6.5
Axial DWI 4 1 2380 65 – – ⬍0.1 9.5
[image:2.594.56.536.56.121.2]gion), posterior to the trigon (posterior region), or in the centrum semiovale and/or corona radiata (central region traversed by the motor pathway).5The sequences of all neonates were randomly
presented.
Phase 3. Four weeks later the same 2 neuroradiologists jointly reviewed all the MR imaging studies in which at least 1 HPL was detected during phase 2. They were asked to reach a consensus on a global HPL evaluation (number and location). This consensus reading was considered the reference standard for statistical analysis.
Statistical Analysis
Statistical analysis was performed by using SPSS Statistics for Mac, Version 21.0 (IBM, Armonk, New York). The level of signif-icance was set atP⬍.05.
Linear mixed-model analysis was performed to evaluate the presence of significant differences between the overall number of HPLs identified in each T1-weighted sequence and the number of HPLs identified in each location (anterior, posterior, and central/motor).
The presence of a relationship between the neuromotor out-come at 3 months and the number of HPLs was tested by using logistic regression with a backward stepwise conditional method. Intraclass correlation coefficients (ICCs) were used to study the agreement between the 2 readers in visualizing the number of HPLs with each T1 sequence. An ICC of⬍0.40 indicated a poor agreement; 0.40 – 0.75, fair-to-good (moderate); and 0.76 –1.00, excellent agreement.18To analyze the performance of each MR
imaging sequence in showing the presence of HPLs, we calculated the ICC between the individual assessments and the reference standard.
RESULTS
Patients
The MR imaging studies of 184/200 (92%) PNs were scored as at least 2 at the preliminary image-quality analysis and therefore were included in the analysis. Thirty-one of 184 (16.8%) PNs (12 females; average gestational age, 32.5⫾2.5 weeks; range, 28 –36 weeks) presented with at least 1 HPL on at least 1 T1-weighted sequence and were included in subsequent statistical analysis. In 4 of these neonates, T1 SE images were not obtained due to patient awakening. In 1 neonate, both SE and T1 IR images were not obtained.
Neuromotor Outcome
At 3 months, 20/31 (64.5%) preterm infants presented with a mildly abnormal motor development (spasticity), 9/31 (29.0%) presented with a normal motor development, none of the patients presented with cerebral palsy, and 2/31 (6.5%) PNs were lost to follow-up.
Number of HPLs
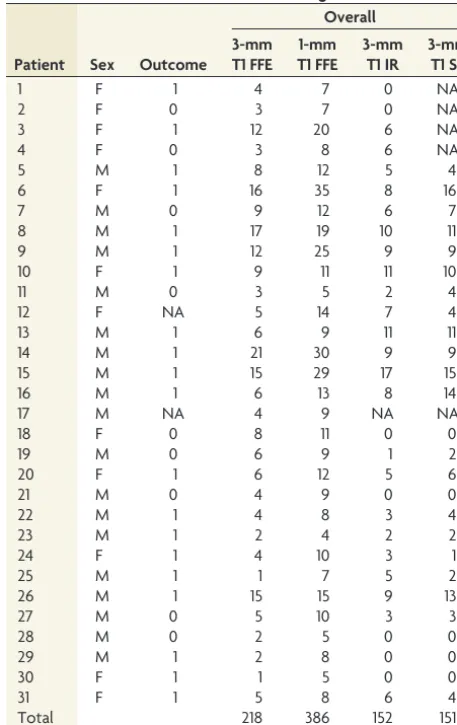
In consensus reading, the 1-mm reformatted 3D-FFE sequence detected the greatest overall number of HPLs (n⫽386 lesions); 3-mm reformatted 3D-FFE, T1 IR, and T1 SE sequences identified 218, 152, and 151 HPLs, respectively. In 7 PNs, the presence of
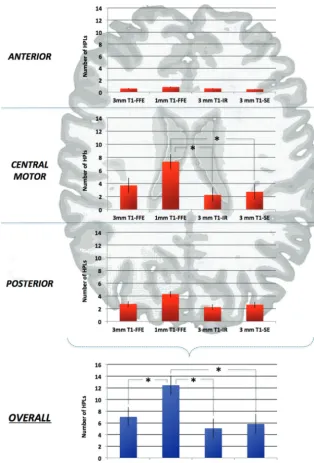
HPLs was identified exclusively on the reformatted 3D-FFE se-quences and not on SE and IR. Results are summarized in Table 2. The consensus reading of the location-related number of HPLs indicated that in the central/motor location, 1- and 3-mm reformat-ted 3D-FFE sequences detecreformat-ted 227 and 115 HPLs. The T1 IR and T1 SE sequences identified 67 and 71 HPLs, respectively. In the anterior location, 1- and 3-mm reformatted 3D-FFE sequences detected 26 and 18 HPLs. The IR and SE sequences identified 18 and 12 HPLs, respectively. In the posterior location, 1- and 3-mm reformatted 3D-FFE sequences detected 133 and 85 HPLs. The IR and SE sequences identified 67 and 68 HPLs, respectively.
The linear mixed-model analysis showed a statistical differ-ence among the overall number of lesions detected by the 4 T1-weighted sequences (P⬍.01). Comparison of the means indi-cated that the 1-mm reformatted T1 3D-FFE sequence identified a significantly greater overall number of HPLs than 3-mm refor-matted T1 3D-FFE, SE, and IR sequences. No statistical differ-ences were observed among the overall number of lesions de-tected by 3-mm sequences (P⬎.05) (Fig 1).
Linear mixed-model analysis showed a statistical difference among the number of HPLs detected by the 4 T1-weighted se-quences in the central/motor location (P⬍.01). Comparison of the means indicated that the 1-mm reformatted T1 3D-FFE se-quence identified a significantly greater number of HPLs than the SE and IR sequences (P⬍.01), whereas no differences were
ob-Table 2: HPLs identified in consensus reading
Patient Sex Outcome
Overall 3-mm
T1 FFE 1-mm T1 FFE
3-mm T1 IR
3-mm T1 SE
1 F 1 4 7 0 NA
2 F 0 3 7 0 NA
3 F 1 12 20 6 NA
4 F 0 3 8 6 NA
5 M 1 8 12 5 4
6 F 1 16 35 8 16
7 M 0 9 12 6 7
8 M 1 17 19 10 11
9 M 1 12 25 9 9
10 F 1 9 11 11 10
11 M 0 3 5 2 4
12 F NA 5 14 7 4
13 M 1 6 9 11 11
14 M 1 21 30 9 9
15 M 1 15 29 17 15
16 M 1 6 13 8 14
17 M NA 4 9 NA NA
18 F 0 8 11 0 0
19 M 0 6 9 1 2
20 F 1 6 12 5 6
21 M 0 4 9 0 0
22 M 1 4 8 3 4
23 M 1 2 4 2 2
24 F 1 4 10 3 1
25 M 1 1 7 5 2
26 M 1 15 15 9 13
27 M 0 5 10 3 3
28 M 0 2 5 0 0
29 M 1 2 8 0 0
30 F 1 1 5 0 0
31 F 1 5 8 6 4
Total 218 386 152 151
[image:3.594.302.531.55.418.2]served with the 3-mm reformatted 3D-FFE sequence (P⬎.05). Statistically significant differences were not observed among the number of HPLs identified by the 4 T1-weighted sequences in anterior and posterior locations (Fig 1).
Relationship between Neuromotor Outcome and the Number of HPLs
To test the clinical implication of the only significant difference in the detection score of the HPLs by the 4 different T1-weighted sequences, we tested the relationship between the number of HPLs in the central region and the neuromotor outcome at 3 months. The number of HPLs detected by each T1-weighted
sequence was included in the primary logistic regression analysis, and 3-mm re-formatted T1 3D-FFE, IR, and SE se-quences were removed from the back-ward stepwise model. The number of HPLs detected by the 1-mm T1 3D-FFE sequence was an independent predictive factor for neuromotor outcome (odds ra-tio⫽1.690; 95% CI, 1.017–2.807;P ⫽
.04).
Interreader Agreement Analysis
A moderate-to-excellent interreader agreement was observed for all the se-quences. The greatest agreement was reached by using the 1-mm axial refor-matted T1 3D-FFE sequence (ICC ⫽ 0.986). Results of the interreader agree-ment analysis are summarized in Table 3. The ICCs of each T1-weighted se-quence in relation to the reference stan-dard indicated that the 1-mm axial refor-matted T1 3D-FFE sequence yielded the best results (excellent agreement) for both readers. The agreement between the 3-mm T1-weighted sequences and the criterion standard yielded a higher ICC for the 3D-FFE (excellent agreement) than for the SE and IR sequences (moder-ate agreement) for both readers (Table 3).
DISCUSSION
Despite the recent availability of an ever-increasing number of 3T scanners, spe-cific indications for the identification of HPLs in PNs are still lacking. Therefore, in this 3T study, we evaluated the contri-bution of different T1-weighted se-quences for the identification and local-ization of HPLs in a group of PNs. The results indicated that axial reformatted T1 3D-FFE scored better than T1 IR and T1 SE sequences for detecting HPLs, though only the 1-mm sequence differed signifi-cantly from the others. These findings can be explained by the combination of thin-ner section thickness and the intrinsically higher sensitivity of T1-weighted FFE sequences for hyperintense lesions compared with SE. Wintersperger et al19demonstrated that T1 3D-FFE sequences
showed a higher signal-to-noise ratio compared with T1 SE se-quences at both 1.5T and 3T. Edelman et al20recently reinforced this
finding by demonstrating that at 3T the T1 3D-FFE presented a sig-nificantly higher quality compared with the 2D T1-SE images, pro-viding a higher contrast-to-noise ratio for discriminating gray and white matter structures, reducing artifacts, and improving imaging efficiency with reformatted images in orthogonal orientations. In the present study, the same reasons can be given to explain the difference in scoring HPLs observed between the T1 3D-FFE and T1 IR
[image:4.594.53.368.67.531.2]quences—that is, the T1 IR sequence had the same spin magnetiza-tion refocusing of the T1 SE. This aspect was also confirmed by the lack of a significant difference in HPL detection between the T1 SE and T1 IR sequences.
In addition to the intrinsically higher SNR of FFE compared with SE sequences, the section thickness and the possibility of obtaining an isotropic voxel are important in increasing the sen-sitivity of FFE sequences.
The T1 3D-FFE sequence with a section thickness of 1 mm scored better in identifying HPLs than the other 3-mm T1-weighted sequences (P⬍.01). In particular, the difference be-tween 1- and 3-mm axial reformatted T1 3D-FFE sequences (P⬍
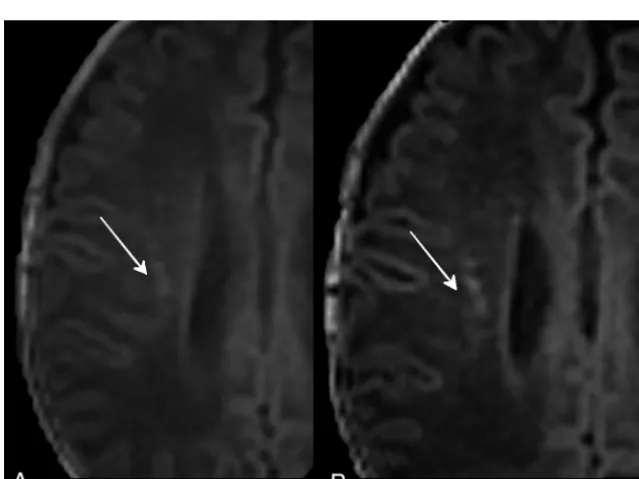
.01) demonstrated that decreasing the section thickness can sig-nificantly increase the detection rate of punctate lesions. This out-come is because the use of thinner sections allowed the separation of contiguous lesions that were seen as confluent with thicker sections (ie, cluster-organized HPLs could be identified as multi-ple lesions at 1 mm, while they appeared as a single lesion at 3 mm) (Fig 2).
The importance of using a 3D-FFE sequences was reinforced by the overall greater number of appropriately identified PVLs by using both the 1- and 3-mm reformatted images compared with SE and IR sequences.
As a second step, we classified HPLs according to their location (posterior, central, and anterior).12We observed that the 1-mm
reformatted 3D-FFE sequence scored a statistically significantly greater number of HPLs compared with the IR and SE sequences only in the central (motor) location. This finding may be attrib-uted to the intrinsically higher contrast-to-noise ratio of T1 3D-FFE sequences that discriminated HPLs from the relatively higher T1 signal intensity of the myelinated cortical spinal tract of neo-nates. On the other hand, the absence of statistically significant differences in the anterior and posterior locations among the dif-ferent weighted sequences may be attributed to the lower T1-signal intensity of the unmyelinated white matter, which in-creased the contrast with HPLs.
On the basis of the findings reported by Nanba et al,12
subse-quent analysis focused on the central (motor) location. We eval-uated the relationship between the number of HPLs detected by each sequence and the neuromotor outcome at 3 months. The greater number of HPLs detected by the 1-mm reformatted T1 3D-FFE sequence positively correlated to a worse clinical out-come, thus suggesting that this sequence should be used in rou-tine clinical use for PNs.
The ICCs of interreader agreement in the detection of HPLs were moderate to excellent for all the T1-weighted sequences ex-cept for IR, which had the lowest score performance (ICC⫽0.63) and interobserver agreement (ICC⫽0.66). These results seem to contradict a previous 3T study by Stehling et al,21which evaluated
differences in contrast-to-noise ratio, artifacts, gray-white differ-entiation, image noise, and overall diagnostic quality among FFE, IR, and SE sequences. They demonstrated a higher contrast-to-noise ratio and a better gray-white matter differentiation with a higher overall diagnostic quality of both FFE and IR compared with SE sequences. We hypothesize that this discrepancy was re-lated to the lower negative influence of the inhomogeneous my-elination of the white matter of PNs on the FFE sequences.20,21
The highest interreader agreement was obtained with the 1-mm reformatted T1 3D-FFE sequence. This result could be related to the higher HPL conspicuity on this sequence, due to the higher intrinsic SNR and thinner section thickness. In ad-dition, the higher interreader agreement obtained with T1 3D-FFE compared with T1 IR and T1 SE sequences demonstrated that the detection of HPLs by using the T1 3D-FFE sequence was less influenced by reader experience.
Another important advantage of 3D-FFE sequences is their intrinsic lower spe-cific absorption rate compared with SE. The specific absorption rate level in-creases with field strength and is higher in T1 SE sequences due to the refocusing pulses and in T1 IR sequences because of their intense radiofrequency pulse.21The
possibility of using lower specific absorp-tion rate levels is particularly important in neonates due to their immature thermo-regulatory abilities.
[image:5.594.56.284.352.437.2]FIG 2.Three-millimeter (A) and 1-mm (B) axial reformatted T1 3D-FFE sequences of PNs affected by PVL. The thinner sections (B) separated lesions that were seen as confluent with the thicker sections (A).
Table 3: Interreader agreement and pulse sequence performancesa
Pulse Sequences
Agreement of Reader 1 and
Reference Standard
Agreement of Reader 2 and Reference
Standard
Interreader Agreement
3-mm T1 FFE 0.893 0.822 0.844
1-mm T1 FFE 0.988 0.992 0.986
3-mm T1 IR 0.776 0.631 0.653
3-mm T1 SE 0.793 0.797 0.820
[image:5.594.52.372.457.697.2]The main limitation of this study was the lack of a direct com-parison between 1.5 and 3T sequences. For ethical reasons, we decided not to repeat the MR imaging studies at different mag-netic field intensities.
An additional limit of this study was its retrospective design. The only clinical outcome that was consistently available from patient records for the study group was the neuromotor one at 3 months. In addition, our study population lacked cases with the most unfavorable neuromotor outcome (cerebral palsy). These points should be addressed in future studies. In addition, 4 neo-nates had incomplete MR imaging studies because they did not undergo axial T1-SE and one did not undergo T1 IR.
All nonisometric sequences were acquired on the axial plane; thus, a comparison with sagittal and coronal reformatted 3D-FFE sequences was not possible.12The patient population imposed a
rigid limit to the duration of the acquisition, thus excluding the possibility of also acquiring all sequences in the coronal plane. Nonetheless, an evaluation of the effect of the acquisition plane was beyond the scope of this study.
CONCLUSIONS
This study demonstrated that with 3T scanners, the 1-mm axial reformatted T1 3D-FFE sequence identified the greatest number of HPLs in the central region of PN brains, and this number was predictive of neuromotor outcome at 3 months.
REFERENCES
1. Volpe JJ.Neurology of the Newborn.Philadelphia: W.B. Saunders; 2000
2. Ferriero DM.Neontal brain injury.N Engl J Med2004;351:1985–95 3. Volpe JJ.Neurobiology of periventricular leukomalacia in the
pre-mature infant.Pediatr Res2001;50:553– 62
4. Rezaie P, Dean A.Periventricular leukomalacia, inflammation and white matter lesions within the developing nervous system. Neuro-pathology2002;22:106 –32
5. Back SA, Riddle A, McClure MM.Maturation-dependent vulnera-bility of perinatal white matter in premature birth.Stroke2007; 38(2 suppl):724 –30
6. Distefano G, Pratico` AD.Actualities on molecular pathogenesis and repairing processes of cerebral damage in perinatal hypoxic-isch-emic encephalopathy.Ital J Pediatr2010;16:36:63
7. Cornette LG, Tanner SF, Ramenghi LA, et al.Magnetic resonance imaging of the infant brain: anatomical characteristics and clinical significance of punctate lesions.Arch Dis Child Fetal Neonatal Ed
2002;86:F171–77
8. Olse´n P, Paakkii E, Vainionpaa L, et al.Magnetic resonance imaging of periventricular leukomalacia and its clinical correlation in chil-dren.Ann Neurol1997;41:754 – 61
9. Ment LR, Hirtz D, Huppi PS.Imaging biomarkers of outcome in the developing preterm brain.Lancet Neurol2009;8:1042–55
10. Leijser LM, de Bruïne FT, van der Grond J, et al.Is sequential cranial ultrasound reliable for detection of white matter injury in very pre-term infants?Neuroradiology2010;52:397– 406
11. Hintz SR, O’Shea M.Neuroimaging and neurodevelopmental out-comes in preterm infants.Semin Perinatol2008;32:11–19
12. Nanba Y, Matsui K, Aida N, et al.Magnetic resonance imaging re-gional T1 abnormalities at term accurately predict motor outcome in preterm infants.Pediatrics2007;120:e10 –19
13. Bax M, Tydeman C, Flodmark O.Clinical and MRI correlates of cerebral palsy: the European Cerebral Palsy Study.JAMA2006; 296:1602– 08
14. Back SA, Miller SP.Brain injury in premature neonates: a primary cerebral dysmaturation disorder?Ann Neurol2014;75:469 – 86 15. Liauw L, van der Grond J, van den Berg-Huysmans AA, et al.
Hyp-oxic-ischemic encephalopathy: diagnostic value of conventional MR imaging pulse sequences in term-born neonates. Radiology
2008;247:204 –12
16. Williams LA, Gelman N, Picot PA, et al.Neonatal brain: regional variability of in vivo MR imaging relaxation rates at 3.0T—initial experience.Radiology2005;235:595– 603
17. Rosenbaum P, Stewart D.The World Health Organization interna-tional classification of functioning, disability and health: a model to guide clinical thinking, practice and research in the field of cere-bral palsy.Semin Pediatr Neurol2004;11:5–10
18. Fleiss JL.Statistical Methods for Rates and Proportion.2nd ed. New York: John Wiley; 1981
19. Wintersperger BJ, Runge VM, Biswas J, et al.Brain tumor enhance-ment in MR imaging at 3 Tesla: comparison of SNR and CNR gain using TSE and GRE techniques.Invest Radiol2007;42:558 – 63 20. Edelman RR, Dunkle E, Koktzoglou I, et al.Rapid whole-brain
mag-netic resonance imaging with isotropic resolution at 3 Tesla.Invest Radiol2009;44:54 –59
21. Stehling C, Niederstadt T, Kra¨mer S. Comparison of a T1-weighted inversion-recovery-, gradient-echo- and spin-echo se-quence for imaging of the brain at 3.0 Tesla[in German].Rofo