i
How research & development
adds value
- a business modelling method for R&D organisations -
ii
How research and development adds value
-a business modelling method for R&D organisations-
Version 12-12-2012 PUBLIC
Author Neill Sweet
Study Program Master of Science in Industrial Engineering and Management
Specialisation Information Technology and
Management
School of Management and Governance
University of Twente, Enschede, The Netherlands
Student number s0000434
Email [email protected]
GRADUATION COMMITTEE
First supervisor Dr. M.E. (Maria-Eugenia) Iacob
Assistant Professor
Industrial Engineering and Business Information Systems
University of Twente, Enschede, The Netherlands Second supervisor M.Sc. L.O. (Lucas) Meertens
Ph. D. candidate
Industrial Engineering and Business Information Systems
University of Twente, Enschede, The Netherlands SE Blades Technology supervisors Ing. Marcel Jasper
Quality Manager
SE Blades Technology, Hengelo, The Netherlands
Dr. ir. Klaas de Haas
Head of department Composites, Materials and Processes
iii
ABSTRACT
This research arose out of an interest in capturing the value of R&D. An interest which brought the two areas R&D and Business Models together and led to the following research question:
How to build a business model for a research and development organisation?
The quest for an answer did not only contribute by illuminating the shady grounds of value creation within R&D, it strengthened the fundaments where this research is built upon as well.
For this research, a generic method to build a business model in a structured and reproducible manner (Meertens et al, 20011) is tailored to be applicable for R&D organisations. The adjustments of the method based on typical R&D characteristics led to the solution design which then was demonstrated and validated via a case study. To ensure the quality of the validation an expert validation is done as well.
In section 2.1 the BMM is introduced based on the following business model definition: “A business model is a simplified representation that counts for the known and inferred properties of the business or industry as a whole...”
By a thorough literature study in section 2.2 the known and inferred properties of R&D were classified as project oriented, managing activities, risk management, cost management, value and external linkages. These characteristics were used in section 2.3 to research the suitable techniques within the BMM.
The solution design which is built upon the outcomes of 2.3 is presented in chapter 3. First the roles are identified using a stakeholder analysis which is especially designed for R&D projects. Second, the relations are recognised by mapping the value exchanges with e3-value modelling. Third, the activities are specified using Stage Gate Systems and the fourth step quantification of the model is covered by job costing. The fifth and the sixth step are general steps and outside the scope of this research. The solution design is based on two assumptions:
o a R&D organisation is project oriented
o the business model of R&D is a portfolio of innovation processes
iv
In the expert validation in chapter 5 the strengths, weaknesses, opportunities and threads of the solution design were discussed. One of the strengths confirmed the results in chapter 4, that the method appeared well structured and useable in practice. The lack of an earning model was addressed as a weakness. However, the solution design is demonstrated at a R&D organisation which is seen as a cost centre. Therefore this is not a weakness but a limitation, as earning models are more useful for profit centres. This automatically leads to the opportunity of doing further research on how to shift from a cost centre to a profit centre. The threads of overlapping definitions which the experts warned for are taken into account during the revision of this thesis.
v
TABLE OF CONTENTS
ABSTRACT ... iii
TABLE OF CONTENTS ... v
LIST OF FIGURES ... viii
LIST OF TABLES ... ix
ABBREVIATIONS ... x
ACKNOWLEDGEMENTS ... xii
CHAPTER 1. INTRODUCTION ...1
1.1 MOTIVATION FOR THE RESEARCH ...1
1.2 RESEARCH AIM AND OBJECTIVES ...3
1.3 METHODOLOGY ...4
1.3.1 Design Science ...5
1.3.2 Literature research strategy ...7
1.3.3 Case Study ...10
1.3.4 Interviews...11
CHAPTER 2. LITERATURE REVIEW ...12
2.1 BUSINESS MODEL ...12
2.1.1 What is a business model? ...12
2.1.2 What is the status of business model research? ...13
2.1.3 Business Modelling Method (BMM) ...15
2.2 CHARACTERISTICS R&D ...17
2.3 CHALLENGES ...22
2.3.1 Identify roles ...22
2.3.2 Recognize relations ...24
2.3.3 Specify activities ...27
2.3.4 Quantify model ...32
2.4 CONCLUSION ...34
CHAPTER 3. SOLUTION DESIGN ...35
vi
3.1.1 Choice ...37
3.1.2 Presenting the Stakeholder Analysis ...37
3.2 RECOGNISE RELATIONS ...40
3.2.1 Choice ...40
3.2.2 Presenting the e3-value model ...40
3.3 SPECIFY ACTIVITIES ...42
3.3.1 Choice ...42
3.3.2 Presenting the Stage Gates ...43
3.4 QUANTIFY MODEL ...44
3.4.1 Choice ...45
3.4.2 Presenting job-costing ...45
3.5 CONCLUSION ...46
CHAPTER 4. SOLUTION DEMONSTRATION AND VALIDATION ...47
CHAPTER 5. SOLUTION VALIDATION ...48
5.1 PROTOCOL ...48
5.2 SWOT ...48
5.2.1 Strengths ...49
5.2.2 Weaknesses ...49
5.2.3 Opportunities ...49
5.2.4 Threats ...49
5.3 CONCLUSIONS ...50
5.3.1 Strengths ...50
5.3.2 Weaknesses ...50
5.3.3 Opportunities ...51
5.3.4 Threats ...51
CHAPTER 6. CONCLUSIONS, DISCUSSION AND RECOMMENDATIONS ...53
6.1 CONCLUSION ...53
6.2 DISCUSSION ...54
6.2.1 Limitations ...54
vii
6.2.3 Contribution of research ...55
6.3 RECOMMENDATIONS ...55
REFERENCES...56
Appendix A: Top TIM Journals... 63
Appendix B: Top IS Journals ... 64
Appendix C: Top Accounting Journals ... 66
Appendix D: Search terms chapter 2.1 ... 67
Appendix E: A peek into innovation ... 69
viii
LIST OF FIGURES
Figure 1-1: R&D expenditure public sector (Kuipers, 2011) ... 1
Figure 1-2: Research Model ... 4
Figure 1-3: Overview literature search methodology ... 7
Figure 1-4: Interview scheme based on Emans (1985) ... 11
Figure 2-1: Search process chapter 2.1 ... 17
Figure 2-2: Search process 2.3.1 ... 22
Figure 2-3: Stakeholder literature map based on Elias et al. (2002)... 23
Figure 2-4: Search process 2.3.2 ... 25
Figure 2-5: Search process 2.3.3 ... 27
Figure 2-6: Example Stage-Gate system (Cooper, 1990) ... 28
Figure 2-7: traditional model versus flexible model (Iansiti, 1995) ... 28
Figure 2-8: Radical innovation process (Veryzer Jr, 1998) ... 29
Figure 2-9: Example (Iansiti, 1995) ... 30
Figure 2-10: Scales of Stage-Gate Systems ... 31
Figure 2-11: Technology Development Projects ... 31
Figure 2-12: Search process section 2.3.4 ... 33
Figure 3-1: Overview steps BMM ... 36
Figure 3-2: Step 1 BMM - Identify Roles ... 37
Figure 3-3: Stakeholder Management Capability ... 39
Figure 3-4: Dynamics Stakeholders ... 39
Figure 3-5: Step 2 - Recognise Relations ... 40
Figure 3-6: Example e3-value model (Gordijn 2001) ... 41
Figure 3-7: Step 3 - Specify Activities ... 42
Figure 3-8: Workflow of Step 3 ... 44
Figure 3-9: Step 4 - Quantify Model ... 44
Figure 6-1: Classification, place of R&D, measuring R&D... 71
ix
LIST OF TABLES
Table 1-1: Research framework according to March and Smith (1995) ... 5
Table 1-2: Design-Science Research Guidelines based on Hevner et al. (2004) ... 6
Table 1-3: Coverage by database Scopus ... 8
Table 1-4: Components of research design according to Yin (1987) ... 10
Table 1-5: Tests for judging the quality of a case study (Yin, 1987) ... 10
Table 2-1: Overview eight sub domains of business models (Pateli & Giaglis, 2004) ... 14
Table 2-2: Domains for future research (Vermolen, 2010) ... 14
Table 2-3: Business Modelling Method (Meertens et al., 2011) ... 16
Table 2-4: Concept matrix R&D ... 18
Table 2-5: overview SA ... 24
Table 2-6: Overview e3-value model... 26
Table 3-1: Stakeholder Analysis based on (Elias et al., 2002) ... 38
Table 3-2: Example e3-value model ... 42
Table 5-1: Overview Experts ... 48
Table 6-1: Overview top 10 TIM journals ... 63
Table 6-2: Generations of R&D management ... 69
x
ABBREVIATIONS
A&L Aero & Loads
ARN Activity Release Note
BMM Business Modelling Method
BSE Bombay Stock Exchange
CBS Centraal Bureau Statistiek
CEO Chief Executive Officer
CFO Chief Financial Officer
CFT Cross Functional Team
CMP Composite Materials & Processes
COO Chief Operations Officer
CTO Chief Technology Officer
DCM Design Change Management
DK Denmark
DQ Document Quality
GL Germanischer Lloyd
HOD Head of Departments
HR Human Resource
HTV High Temperature Version
IS Information System
IT Information Technology
KAM Key Account Manager
LTV Low Temperature Version
M&E Moulds & Equipment
MDV Material Design Values
ME Manufacturing Engineering
MMU Mould Manufacturing Unit
MW Mega Watt
NL Netherlands
xi
NSE National Stock Exchange of India
PB Portfolio Board
PD Product Development
PET Polyethylene terephthalate
PM Project Management
PMO Project Management Office
PRF Project Request Form
PS Product Support
PSG Product Strategy Group
QM Quality Manager
R&D Research and Development
SA Stakeholder Analysis
SB xx Suzlon Blades xx
SBT SE Blades Technology
SBU Strategic Business Unit
SCM Supply Chain Management
SCS Suzlon Composites Services
SD Structural Design
SEG Suzlon Energy GmbH
SEL Suzlon Energy Limited
STV Standard Temperature Version
xii
ACKNOWLEDGEMENTS
This thesis is the result of twenty four weeks of research at SE Blades Technology. It was educational, interesting and sometimes hard as well. During this period I have met a lot of interesting people and learned a lot about all kind of the aspects of an international organisation. This section offers me to thank everyone who has helped me to get where I am now.
First of all, I would like to express my very great appreciation to Marcel Jasper, my supervisor at SE Blades Technology, for his useful critiques. His willingness to give his time so generously has been very much appreciated. My grateful thanks are also extended to Klaas de Haas, my second supervisor at SE Blades Technology, for the support he offered when I was stationed on his department. My special thanks are extended to everybody from the department CMP as well, for the interesting internship and the weekly lunch trips to the IKEA, McDonalds or the market.
Furthermore, I would like to express my deep gratitude to Maria Iacob and Lucas Meertens, my research supervisors, for their advice and assistance in keeping my progress on schedule. The two visits at Hengelo during my internship showed your involvement in my research. I would also like to extend my thanks to Björn Kijl, Timber Haaker, Holger Schiele and Dick Quartel for your expert opinion on the results of my research.
Finally, I wish to thank my family for their support and encouragement throughout my study and Daisy Chong without whom I would not have achieved this. Let us now enjoy the fruits of all the labour!
1
Chapter 1.
Introduction
1.1
Motivation for the research
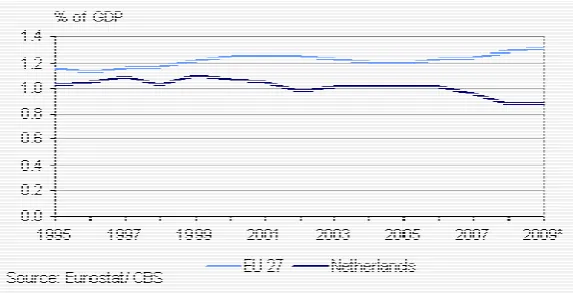
[image:13.595.191.478.314.461.2]According to figures of the Centraal Bureau Statistiek (CBS), the Netherlands are drifting further behind in research and development (R&D). In comparison to the nineties where the Dutch public sector spent 1.0 percent of the gross domestic product on R&D, in 2009 it was 0.88 percent (Kuipers, 2011). This is a huge gap with the EU 271 average of 1.25 percent (Figure 1-1) and an even bigger gap considering the agreement of Lissabon, which states that EU countries spend 2.5 percent of their gross domestic product on R&D by 2020.
Figure 1-1: R&D expenditure public sector (Kuipers, 2011)
Jan Mengelers, head of the recognized Dutch institute TNO warns that with the Dutch economy slipping, the need for R&D and innovation is necessary (Icke, 2012). This is not in line with the cuts on innovation by the Ministry of Economic Affairs, Agriculture and Innovation. In 2011, Minister Verhagen announced a cut of 500 million euro on subsidies for innovation (Verhagen, 2011) and return these cuts by reducing the taxes for entrepreneurs. He defends his policy by stating that the current Dutch subsidy policy did not produce enough tangible results in the area of knowledge and innovation (Verhagen, 2011). This reasoning is interesting for multiple
1
2
reasons. First question to answer is what are tangible results of innovation? This question relates closely to what is the value of innovation? Both questions are very hard to answer and it seems impossible to give an unambiguous answer. Even if an answer could be given, it still would be a lot of guesswork to determine ‘enough’ tangible results.
The lacking R&D spending by the Netherlands (Kuipers, 2011) are even more painfully considering that foreign stakeholders in Dutch industry are accountable for 33% of all R&D spending (Icke, 2012). This is especially the case as the Netherlands like to present themselves as a knowledge intensive economy.
Why is innovation this important?
For a company to grow, it must keep ahead of competitors whenever possible. To do this, companies must innovate, which often depends on R&D. Following this reasoning, investing in R&D would give you a competitive advantage, which would be a boost for your economy. However, it is not that easy, a higher R&D spending does not automatically lead to more or better innovation. R&D is very difficult to manage, while the success of your results is not known in advance. In this light, the decision of Minister Verhagen can be argued.
Because the direct effect can hardly be measured, it is interesting to see how R&D does add value. This question remains unanswered from the beginning of the research on R&D.
3
1.2
Research aim and objectives
As mentioned at the end of the introduction, it would be interesting to expose the business model behind R&D. The translation of this interest to a scientific research leads to the main research question of this thesis:
How to build a business model for a research and development organisation?
The research question combines two scientific areas, the one of business model research and the one of R&D research. R&D research is closely related to innovation research and is intertwined with various fields of expertise, like knowledge management, marketing, production and so on. The business model research is a field with many changing factors in the last two decades. The upcoming of information technology, the introduction of a new distribution channel ‘the internet’, other new forms of communication and together with the rise of globalization, makes business model research an interesting topic.
Because of the developments and viewpoints in both fields, this research has to be positioned and delineated in order to find the area where the two areas overlap.
To tackle the main research question, it is separated in the following objectives and sub questions.
Objective 1: Describe the choice for the business modelling method for R&D - What is the status of the current business model research?
- What is the business modelling method (BMM)?
- What is the influence of the R&D characteristics on the steps of the BMM? Objective 2: Describe the R&D characteristics
Objective 3: Tailor the method for a business model of a R&D organisation - How to design a method?
4
Objective 4: Demonstrate and validate the designed method by a case study - What is the unit of analysis?
- Which projects are suitable for the case study?
Objective 5: Validate the designed method by interviewing business model experts - What are the strengths of the designed method?
- What are the weaknesses of the designed method? - What are the opportunities of the designed method? - What are the threats of the designed method?
In the remaining part of this chapter, the methodologies used will be introduced.
1.3
Methodology
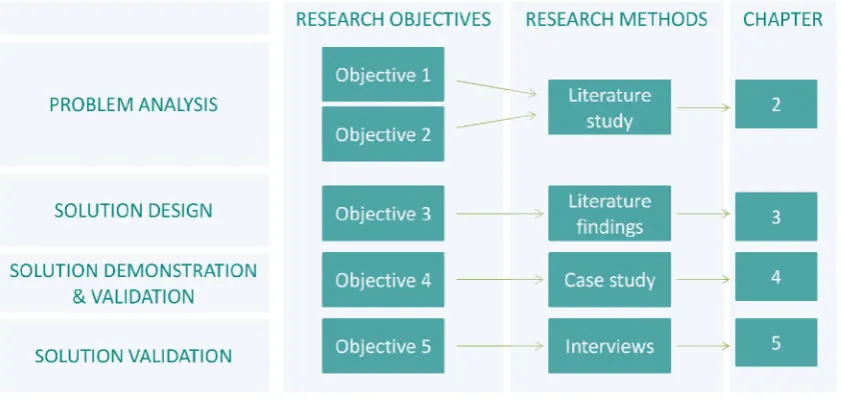
[image:16.595.125.546.387.588.2]The research objectives are assigned to the problem analysis, solution design, solution demonstration and validation (Figure 1-2).
Figure 1-2: Research Model
5
reproducible. Finally in sections 1.3.3 and 1.3.4 the validation methods, case study and interview are described. These sections together represent the foundation of this research.
1.3.1 Design Science
The reach the objectives design science is used. Design science determines the structure of this research (solution design and demonstration/validation). On the role of design science in business model research, Osterwalder (2004) states in his introduction chapter:
“The reasoning behind business model research is not the understanding of a phenomenon, rather it is a problem-solution finding approach”
In design science he finds a suitable research method for an accepted problem solution method (Osterwalder, 2004). His understanding of design science research output follows March and Smith (1995), who define IT artefacts as constructs, models, methods and instantiations. However, Offermann, Blom, Levina, and Bub (2010) present in an overview, that this is not the only view on design science research output. The lack of consensus in this field is noticed by Gregor (2006) as well, where she discusses the terms design science and design theory.
This research follows the same approach as Meertens, Iacob, and Nieuwenhuis (2011), on which shoulders this research stands. The reasons for this will become clear in section 2.1.3. Meertens et al. (2011) follow the seven guidelines of Hevner, March, Park, and Ram (2004) to frame the methodology engineering approach from Kumar and Welke (1992). Furthermore they follow March and Smith (1995) by addressing a method as a design science artefact. Table 1-1 visualises the scope of Meertens et al. (2011) based on March and Smith (1995).
Table 1-1: Research framework according to March and Smith (1995)
Research activities
Build/Tailor Evaluate Theorize Justify
Research outputs
Constructs - - - -
Model - - - -
Method ● ● - -
Instantiation - - - -
6
these guidelines and how they are handled in this research. Most guidelines are interpreted the same way as Meertens et al. (2011).
Table 1-2: Design-Science Research Guidelines based on Hevner et al. (2004)
Design-Science Research Guidelines
Guidelines Output
Guideline 1: Design as an artefact A method is tailored
Guideline 2: Problem Relevance The solution is not yet technology-based. partial automation is left for future research
Guideline 3: Design Evaluation The method is demonstrated via a case study and criticized by experts in interviews.
Guideline 4: Research Contributions The methodology is specialized for R&D business models
Guideline 5: Research Rigor Proven methods are used as foundation
Guideline 6: Design as a Search Process The design is an iterative process within the literature, after the case study and experts interviews iterative adjustments are possible. Guideline 7: Communication of Research This master thesis is used to present the
methodology
Within the guidelines of Hevner et al. (2004), the Methodology Engineering approach from Kumar and Welke (1992) is used. This approach is a proposal for the design and development of a meta-methodology for designing information systems development methodologies (Kumar & Welke, 1992). Meertens et al. (2011) describe the use of this approach as follows:
“The business modelling method has both aspects from the methodology engineering viewpoint: representational and procedural (Kumar & Welke, 1992). The representational aspect explains what artefacts a business modeller looks at. The artefacts2 are the input and deliverables of steps in the method. The procedural aspect shows how these are created and used. This includes the activities in each step, tools or techniques, and the sequence of steps.” In light of cumulative progress, this research follows this reasoning.
2
7
1.3.2 Literature research strategy
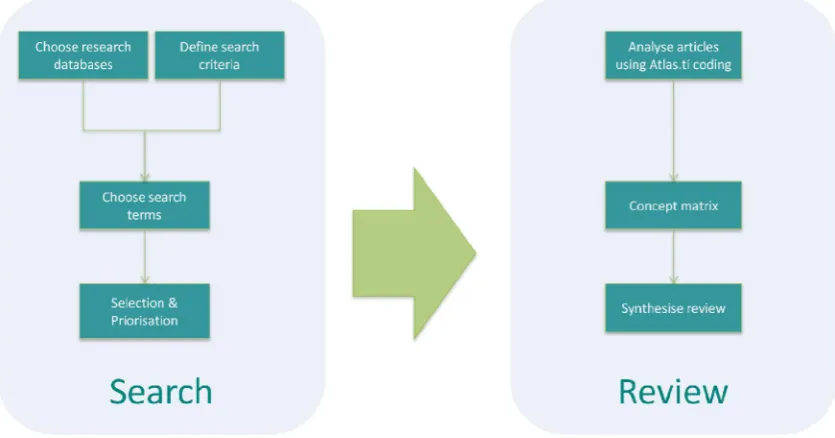
[image:19.595.108.526.260.479.2]To reach the goals of objective 1 and 2 a literature review is needed. To conduct the literature review an explicit and systematic methodology is followed. A well-defined methodology makes it less likely that results are biased. Furthermore, it guards the quality and the completeness of the review. And last, a search strategy allows replication and validation of the search process. Figure 1-3 is an overview of the followed methodology. Although the method is built up sequential, iterations within and between search and review occur.
Figure 1-3: Overview literature search methodology
The steps of the methodology presented in Figure 1-3 are conducted as following: Selection criteria
The selection criteria ensure the quality and relevance of the literature found. Furthermore they represent the limitations of search as well. The selection criteria are:
1. The sources have to be written in English, German or Dutch
8
3. The sources need to be available using the University of Twente library account 4. Search terms have to occur in the title, in the abstract or in the keywords of the
articles
5. Date of search must be recorded for replication purposes
Choice of research databases
The choice of research databases determines the coverage and quality of the research. To ensure high quality of the literature review, only articles from top 25 IS journals according to Schwartz and Russo (2004) or from the top 5 accounting journals (Bonner et al., 2006) or from top 10 TIM Journals according to Linton and Thongpapanl (2004) and the update by Thongpapanl (2012) are used. The coverage of Scopus for these journals is more than sufficient (see Table 1-3) and therefore this search engine is used. For an overview of the journal rankings and the search queries used see Table 1-3.
Table 1-3: Coverage by database Scopus
Search engine Scopus
Field Coverage top 5 Coverage top 10 Coverage top 25 Missing Journals
Accounting 100% - - -
Innovation - 100% - -
IS - 100% 96% Data Base (#14)
The limited time available for this research in combination with the search limitation to high quality journals, legitimizes the choice of omitting a forward and backward search. However, the lack of a structured forward and backward search does not mean interesting references and citations are not used. By allowing only citations of papers from top journals, the quality is guaranteed. Secondary references by papers of quality journals are assessed as sufficient.
Search terms
9
and author search. The final search terms are then checked for spelling alternatives and queries are formed. This is an iterative process which has input from all the steps in the literature search methodology. The final search terms and queries for this research can be found in Chapter 2.
Selection and Prioritisation
The search based on titles, abstract or keywords of articles results in a pool of potentially relevant articles. For the sake of reproducibility, the search terms will be tagged with the date of search. The next step is a selection of relevance, based on the abstracts, followed by a selection based on the full text. The full texts are prioritised according to the following scale:
0 = not useful 1 = useful 2 = very useful
The quantitative reporting of the papers included and excluded at each stage of the selection process is presented in a flowchart. This explicit search methodology is presented in section 1.3.2.
Analysis and concept matrix
The useful papers are then analysed and to capture the chain of evidence, they are presented in a concept matrix. A concept matrix shows which concept(s) are described in the papers.
Synthesis
10
1.3.3 Case Study
To reach the goal of objective 4 a case study is used. The founder of the research strategy ‘Case Study’ is Yin (1987). He defines a research design plan as an action plan of getting from A to B. Table 1-4 describes the five components of a research design. The case study in Chapter 4 is built up according to these five components.
Table 1-4: Components of research design according to Yin (1987)
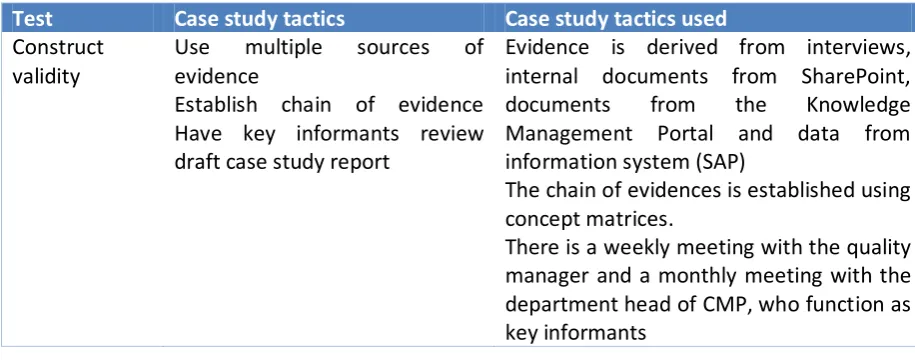
[image:22.595.99.557.548.728.2]Yin (1987) provides four tests to judge the quality and case study tactics to deal with them. These tests are used to evaluate the case study. Table 1-5 consists of an overview of the four tests, case study tactics and the case study tactics which are used for this research.
Table 1-5: Tests for judging the quality of a case study (Yin, 1987)
Test Case study tactics Case study tactics used
Construct validity
Use multiple sources of evidence
Establish chain of evidence Have key informants review draft case study report
Evidence is derived from interviews, internal documents from SharePoint, documents from the Knowledge Management Portal and data from information system (SAP)
The chain of evidences is established using concept matrices.
There is a weekly meeting with the quality manager and a monthly meeting with the department head of CMP, who function as key informants
Component Function
1. Study question ‘How’ and/or ‘Why’ question
2. Proposition(s) or purpose Limiting scope, setting focus of the study’s goals 3. Unit(s) of analysis Defines the case, which case is going to be measured 4. The logic linking the data to the
propositions
Matching pieces of information to rival patterns that can be derived from the propositions
11 Internal validity
Do pattern matching Do explanation building Do time-series analysis
With pattern matching the empirically collected data is compared with the predicted findings
External validity
Use replication logic in multiple-case studies
The scope of this research does not provide the time to multiple case studies Reliability Use case study protocol
Develop case study data base
Research design of a case study protocol is set up
1.3.4 Interviews
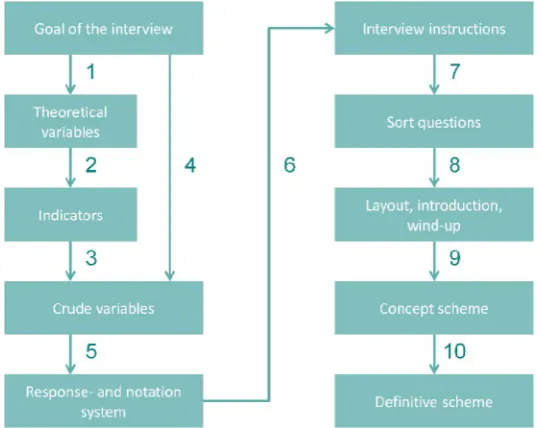
[image:23.595.199.470.327.541.2]During this research, multiple interviews are conducted. The basis of an interview is the interview scheme, which guides the interviewer as well with the design as during the interview (Emans, 1985). Figure 1-4 is an overview of the ten steps in the construction of an interview scheme.
Figure 1-4: Interview scheme based on Emans (1985)
12
Chapter 2.
Literature Review
This chapter is roughly divided in three parts, business models, R&D characteristics and challenges. First, in the business model section (2.1) business modelling method is chosen and presented. Then, in the of the R&D section (2.2), the R&D characteristics are discussed. In the last section (2.3), the first two sections are combined. Based on literature reviews, the possible techniques for the business modelling method are assessed against R&D characteristics.
2.1
Business Model
This section is an introduction into business models and its importance. Furthermore, it gives a status on current business model research and the research gaps. Finally, it argues the choice for the business modeling method of Meertens et al. (2011) in this research.
2.1.1 What is a business model?
A business model is basically a simplified representation of how a company works. The simplified representation allows getting the grasp of an organisation instead of loosing yourself into the complexity of all its internal processes, external relations and environmental influences. Furthermore, a business model can be a supportive tool to act on possible influences of changing factors. A few examples of this to get some feeling with the relevance: In the nineties, in almost every home you could find a magazine of the Wehkamp, from which you could order all kinds of products. The rise of the internet had a major influence on that business model, a new distribution channel arrived.
Another business model change which resulted from the rise of the internet is the music distribution industry. If you compare the business model behind CD’s and nowadays, for example Spotify, a lot has changed.
13
These are some examples from practice to show where a business model can be helpful in times of change. Not only seems the importance of a business model intuitive logical, many authors recognize the importance of the business model concept as well (see for overview Vermolen, 2010). Nevertheless, no consensus concerning the definition of a business model (Pateli & Giaglis, 2004; Vermolen, 2010) from an academic perspective has been reached. In this research the definition given by Meertens et al. (2011) is followed:
“A business model is a simplified representation that counts for the known and inferred properties of the business or industry as a whole, which may be used to study its characteristics further...”
This definition will be the common denominator of this chapter.
In this section, the term business model is explained from a practical perspective as well as from academic perspective. The next section will dig deeper into the business model research from an academic point of view.
2.1.2 What is the status of business model research?
Business models traditionally belong to the field of organizational management (Pateli & Giaglis, 2004), but developments in the global economy changed the traditional balance between customer and supplier (Teece, 2010). The rise of information technology and its impact on business models, has lead to an increase of business model research in the Information System (IS) field (Pateli & Giaglis, 2004; Vermolen, 2010). Although this influence led to more research on eBusiness models (for overview see Pateli & Giaglis, 2004; Vermolen, 2010), Vermolen (2010) concludes that a distinction between eBusiness models and business models does not exist.
14
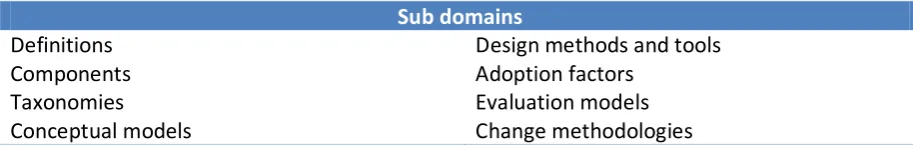
[image:26.595.100.557.199.273.2]Pateli and Giaglis (2004) offer an extensive review of literature on eBusiness and propose an analytical framework that decomposes the area of business models into eight research sub-domains. Table 2-1 gives an overview of the eight sub-sub-domains.
Table 2-1: Overview eight sub domains of business models (Pateli & Giaglis, 2004)
Sub domains
Definitions Design methods and tools
Components Adoption factors
Taxonomies Evaluation models
Conceptual models Change methodologies
Pateli and Giaglis (2004) give for every sub-domain the research status and research suggestions. Furthermore they overall conclude that the business model field has matured in such way that it needs to move from the elementary definitional studies towards more in depth analysis. Another condition to reach maturity is for the research community to invent a common language. Only then research from various scientific disciplines can communicate and build upon each other’s work.
Because of the lack of a recent business model research review, Vermolen (2010) jumped in to this by doing a structured review to identify the current status of research on business models. Based on the identified gaps and suggestions from literature, she came up with an agenda for future research on seven domains. Table 2-2 gives an overview of these seven domains.
Table 2-2: Domains for future research (Vermolen, 2010)
Domains for future research
Definitions Change
Components Implementation and monitoring Unit of analysis Evaluation
Design
15
This summary does not aim at given a full overview of the available literature. For such an overview the two founding articles (Pateli & Giaglis, 2004; Vermolen, 2010) of this section are useful. The goal is to give some insight in the current status and especially in the domains of the research gaps. Based on Vermolen (2010) Meertens et al. (2011) concludes that there is no methodological approach in literature for the design and specification of business models. In an attempt to make business modelling a science instead of an art, Meertens et al. (2011) proposes a method which enables the development of business models in a structured and repeatable manner. Meertens et al. (2011) jump in one of the research gaps defined by Vermolen (2010), as ‘Design’, and Pateli and Giaglis (2004), as ‘Design tools’.
In conclusion, the main research question of this research implies a method is needed to build a business model and for scientific purposes such a method needs to be reproducible. Based on the research of Vermolen (2010) Meertens et al. (2011) concludes that there is no such method available and proposes a method to build a business model which is structured and repeatable. Because there is no alternative, the decision to use the business modelling method of Meertens et al. (2011) to answer the main research question is considered valid. In the next section this method is described.
2.1.3 Business Modelling Method (BMM)
Meertens et al. (2011) proposes the Business Modelling Method, which from here on is referred to as BMM. The application of this method results in at least two business models. One business model which reflects the ‘as-is’ situation or the current situation of the business and the other one which reflects ‘to-be’ business model(s). This represents the potential impact on the business model after adoption of innovative technologies or more efficient business processes (Meertens et al., 2011). This is a direct representation of the definition of business models defined in section 2.1.1.
The BMM describes six steps using specific methods, techniques or tools. The first four steps concern the creation of the ‘as-is’ model:
16
3. Specify activities 4. Quantify model
The remaining two steps concern developing the ‘to-be’ model: 1. Design alternatives
2. Analyse alternatives
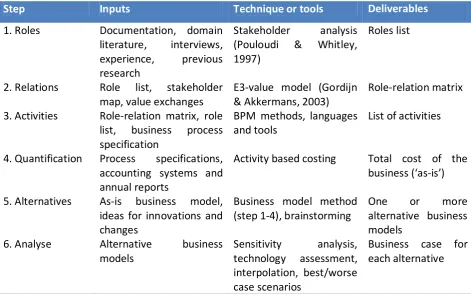
[image:28.595.97.569.284.578.2]Table 2-3 is an overview of the BMM, including for every step the inputs, possible techniques/tools and the deliverables.
Table 2-3: Business Modelling Method (Meertens et al., 2011)
Step Inputs Technique or tools Deliverables
1. Roles Documentation, domain literature, interviews, experience, previous research
Stakeholder analysis (Pouloudi & Whitley, 1997)
Roles list
2. Relations Role list, stakeholder map, value exchanges
E3-value model (Gordijn & Akkermans, 2003)
Role-relation matrix 3. Activities Role-relation matrix, role
list, business process specification
BPM methods, languages and tools
List of activities
4. Quantification Process specifications, accounting systems and annual reports
Activity based costing Total cost of the business (‘as-is’) 5. Alternatives As-is business model,
ideas for innovations and changes
Business model method (step 1-4), brainstorming
One or more alternative business models
6. Analyse Alternative business models
Sensitivity analysis, technology assessment, interpolation, best/worse case scenarios
Business case for each alternative
The BMM provides a way to create business models. Innovators can apply the steps to create business cases for their ideas systematically. This helps them to show the viability and get things implemented (Meertens et al., 2011). Furthermore Meertens et al. (2011) suggest that the BMM can be extended and/or tailored for specific situations.
17
situation and therefore the BMM could be used in search of an answer to the research question.
2.2
Characteristics R&D
For an extensive literature review on the history of R&D and the various terminologies go to Appendix E). In the section 2.1.1 the following definition is given:
“A business model is a simplified representation that counts for the known and inferred properties of the business or industry as a whole, which may be used to study its characteristics further...”
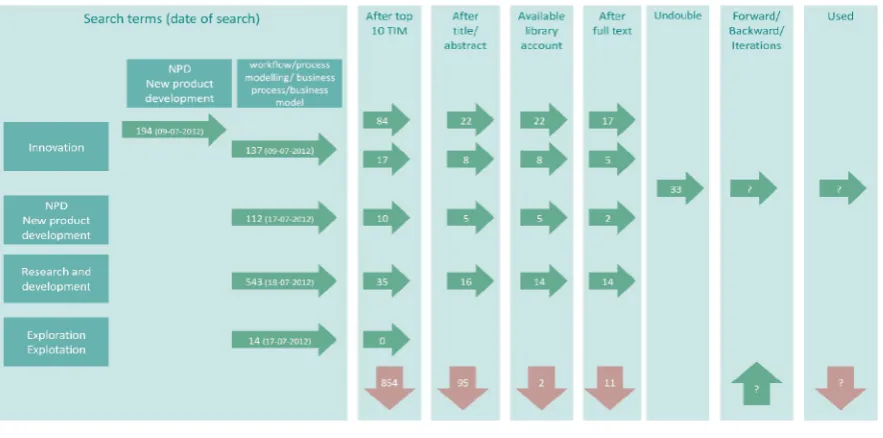
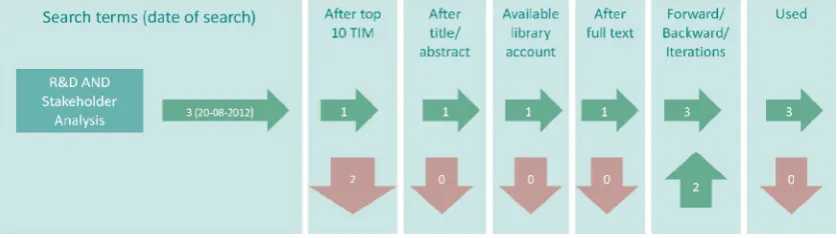
[image:29.595.109.551.421.640.2]The last section ended with the remark that the BMM can be used to answer the research question by tailoring the method to a specific situation. This specific situation is of course a R&D organisation which means that the known and inferred properties of R&D are needed to tailor the method. In this section is searched for the R&D characteristics by a literature study. This section is based on a selection of articles which are obtained by the search process in Figure 2-1.
Figure 2-1: Search process chapter 2.1
18
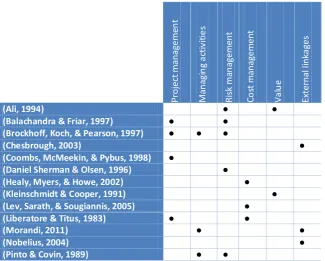
[image:30.595.173.499.326.587.2]is selected using citations it can be found in the right arrow in the block forward/backward/iteration in Figure 2-1. The arrow at the bottom of this block stands for articles conducted from iterations. These iterations are the result of the relevant articles which appeared during the literature research in section 2.3. Some terms are used from the business engineering field, this delineation is done, because of the great amount of articles in the innovation field which is not relevant for this research. Therefore, to ensure the literature review is manageable, the business engineering perspective is already taken into account. Again if articles from another field appear to be relevant they are taken into account. Table 2-4 consist the concept matrix.
Table 2-4: Concept matrix R&D
Project m anageme n t Ma n ag in g a cti vit ie s Ri sk ma n agem ent C o st m an agem ent Va lu e Exter nal lin ka ges
(Ali, 1994) ● ●
(Balachandra & Friar, 1997) ● ●
(Brockhoff, Koch, & Pearson, 1997) ● ● ●
(Chesbrough, 2003) ●
(Coombs, McMeekin, & Pybus, 1998) ●
(Daniel Sherman & Olsen, 1996) ●
(Healy, Myers, & Howe, 2002) ●
(Kleinschmidt & Cooper, 1991) ●
(Lev, Sarath, & Sougiannis, 2005) ●
(Liberatore & Titus, 1983) ● ●
(Morandi, 2011) ● ●
(Nobelius, 2004) ●
(Pinto & Covin, 1989) ● ●
Liberatore and Titus (1983) notice that a lot of R&D management research has an emphasis on project management, which is in line with the conclusions of Coombs et al. (1998) and others (Balachandra & Friar, 1997; Brockhoff et al., 1997) that project management has an important role in R&D. Pinto and Covin (1989) suggest that projects usually have the following attributes:
19
2. a specified time frame or duration
3. a preordained performance goal or set of goals 4. a series of complex, interrelated activities
Based on these attributes R&D specific characteristics are exposed in the literature review. There may be overlap between the different characteristics because they are intertwined. Therefore the different classifications do not have hard boundaries and are only for clarification.
Risk management
Pinto and Covin (1989) notice the overt risks which are familiar to R&D projects. Ali (1994) mentions a lack or loss of project support and uncertain resource requirements. The duration of a R&D project can be very long (Brockhoff et al., 1997) especially for radical innovation (McDermott & O'Connor, 2002; Veryzer Jr, 1998), which makes it harder and more risky to determine the allocation of resources and set reasonable goals. The same goes for project support which is important for R&D, because R&D benefits are often only seen on the long term and success rates are often low (Daniel Sherman & Olsen, 1996; Pinto & Covin, 1989). The outcomes of R&D projects are difficult to predict (Balachandra & Friar, 1997; Brockhoff et al., 1997; Pinto & Covin, 1989) and together with the managerial aversion of taking risk, makes risk management an important R&D characteristic.
Managing activities
21
Specify activities0 offers a deeper insight in the different management models for radical and incremental innovation.
Value
Value is hard to determine because the success of the outcome is not known. Even if the outcome will definitely lead to a patent, then the lifetime of that outcome or product cannot be predicted. The expected returns from incremental innovations are lower than from radical innovations (Kleinschmidt & Cooper, 1991). However, the risk associated with their development and commercialisation is lower than from radical innovations, incremental innovations are important for the firm’s overall profitability (Kleinschmidt & Cooper, 1991).
Cost management
Liberatore and Titus (1983) address the existence of cost-effective techniques which can improve the R&D project management for. However, costing techniques may not directly apply because of availability of information, which is in line with earlier mentioned uncertainties. Uncertainty is why financial accounting rules treat R&D as an expense instead of the capitalisation of costs (Healy et al., 2002; Lev et al., 2005). Because the success of a R&D project is not known as well as the eventual life time of the R&D outcome, it is impossible to capitalise the R&D costs without the big risk of manipulation of earnings (Healy et al., 2002; Lev et al., 2005). The downside is the intangible assets are often undervalued.
External linkages
22
2.3
Challenges
In this section the first four steps of the BMM are assessed against the R&D characteristics from section 2.3. Step 5 and 6 are steps who are based on the first four steps or use general techniques such as brainstorming. There is no need to assess them against the R&D characteristics. Meertens et al. (2011) proposed specific methods, techniques or tools that are suitable, but they remark that other techniques may be useful and applicable as well. Therefore, based on literature reviews for every step, a possible set of suitable techniques is presented. This section forms the basis for the solution design in the chapter 4, where a suitable technique is chosen, argued and presented.
2.3.1 Identify roles
Proposed technique – Stakeholder Analysis
The deliverable of this step is to create a role list. A stakeholder analysis (SA) is proposed as a technique to identify the different roles (Meertens et al., 2011). In the presented case study the SA method of Pouloudi and Whitley (1997) is used. This SA arose from the IS field and aims at inter-organisational information systems. From the perspective of ‘External linkages’ this SA is suitable for R&D, because of the focus on external stakeholders.
[image:34.595.125.544.534.653.2]Literature review
Figure 2-2 forms the search process of the literature review.
23
[image:35.595.216.454.255.458.2]The search process only results in one article (Elias, Cavana, & Jackson, 2002) which satisfies the selection criteria. In this article stakeholder management is verified as an important aspect of R&D management by various examples in literature (see for overview Elias et al., 2002). Furthermore a SA for R&D project management is presented. The proposed SA provides a systematic approach to identify and classify who the stakeholders are. It furthermore describes how to analyse the stakeholders’ interests. These interests are used to map the changing role of a stakeholder throughout a project. The foundation of this SA is presented in Figure 2-3.
Figure 2-3: Stakeholder literature map based on Elias et al. (2002)
The SA is a combined version of Freeman (1984) and Mitchell, Agle, and Wood (1997). In the first part the stakeholder capability of an R&D project is determined and in the final part the dynamics of stakeholders are analysed.
Relevance to R&D characteristics
One of the difficulties in ‘Risk management’ is the often long time frame of R&D projects. While time is passing by, the interests of stakeholders might change as well. The SA (Elias et al., 2002) focuses on the dynamics of stakeholders and their changing interests. In this way possible risks can be foreseen and acted on.
24
process and transactional level. This way a deeper insight is given in the management of relations as well as the transactions that take place. This information is supporting in the management of risks.
Table 2-5 contains an overview of the compatibility of the stakeholder analyses to R&D characteristics. According to the following scale these SA’s are valued: 0=no focus, 1=focus, 2=strong focus.
Table 2-5: overview SA
R&D characteristic SA (Pouloudi & Whitley, 1997) SA (Elias et al., 2002)
Project management 1 2
Managing activities 0 0
Risk management 1 2
Cost management 0 0
Value 0 0
External linkages 2 2
2.3.2 Recognize relations
Proposed technique – e3-value model
The deliverable of this step is to create a role-relation matrix. In the BMM the e3-value model is proposed as a technique to facilitate the creation of that deliverable. However, Meertens et al. (2011) do not explicit argue why this technique fits this step. To decide if this technique is suitable for R&D, it needs to be clear why the choice for the e3-value model is valid. First the literature review is done to unlock the full potential of the e3-value model and is use. Second, is argued if the technique is applicable to R&D.
Literature review
25
Figure 2-4: Search process 2.3.2
The search process only results in one article (Kartseva, Gordijn, & Tan, 2006) which satisfies the selection criteria. This article is used as a starting point for some forward and backward search. This search is no full forward/backward search, because of the limited amount of time within the scope of this assignment. These findings are the basis of this literature review.
The second step of the BMM aims to discover the relations among the roles. It may appear that relations are already captured in the SA of the first step and therefore this step is redundant. However, there are several reasons why the recognition of relations is a separate step in the BMM. First of all, a SA often follows a hub-and-spoke pattern, as the focus is on one of the roles (Meertens et al., 2011). Meertens et al. (2011) suggest a role-relation matrix as a deliverable, while this approach forces to specify and rethink all possible relations between the roles. Secondly, Meertens et al. (2011) note that relations always involve some interaction between two roles. Furthermore they assume that this interaction involves some kind of value exchange as well. This is in line with Gordijn, Akkermans, and Van Vliet (2001) who state that all roles in a business model can capture value from the business model. From this perspective the proposed technique for this step (Meertens et al., 2011), e3-value modelling, is a valid one. The e3-value model models the economic-value exchanges between actors (Andersson, Johannesson, & Bergholtz, 2009; Kartseva et al., 2006). This economic-value exchange can be tangible as well as intangible (Allee, 2008; Andersson et al., 2009). The initiators Gordijn and Akkermans (2003) present the e3-value model as being:
1. lightweight
26
3. based on multiple viewpoints
4. exploits scenarios, both operational and evolutionary
5. recognising the importance of economic value creation and distribution
Property 3 and 5 are in line with the choice of this model in this step. The multiple view approach is the missing link between the SA and the role-relation matrix. Furthermore the focus on value exchange fits the property of a relation being an interaction between roles with some kind of value exchange. The remaining properties 1, 2 and 4 are useful in step 5 of the BMM. The light weighted and visual oriented approach facilitates the brainstorming and generating scenarios, which are important aspects of step 5.
Relevance to R&D characteristics
Now is clear why the e3-value model is suitable for this step. The next step is to decide if this technique is suitable according to R&D characteristics as well. Two R&D characteristics which are relevant for this step are ‘Value’ and ‘External linkages’. The value exchange of intangible assets is an exchange occurs often while knowledge transfer goes hand in hand with R&D. By exposing the tangible value exchanges as well as the intangible ones, the e3-value model is from a ‘Value’ perspective suitable for R&D. This automatically shows that this model is suitable from the perspective of ‘External linkages’ as well. External linkages are the relations between different roles, for example a supplier, and the exchange of for example knowledge. The strength of the e3-value model lies in business network environments and an organisation together with their external linkages can be typed as a business network. Table 2-6 contains an overview of the compatibility of the e3-value model to R&D characteristics.
Table 2-6: Overview e3-value model3
R&D characteristic e3-value model R&D characteristic e3-value model
Project management 0 Cost management 0
Managing activities 1 Value 2
Risk management 1 External linkages 2
3
27
2.3.3 Specify activities
Proposed technique(s) – BPM methods, languages and tools
The deliverable of this step is to create a list of business activities, which together form the qualitative model. This qualitative model reveals what must happen for the business to function properly (Meertens et al., 2011). The basis for this step forms the role-relation matrix, because a relation between two roles requires activities by both roles. To visualize this, think of the example of a hairdresser and his customer. The relation between these two roles is based on the payment of the customer and the coiffure from the hairdresser. The coiffure is designed by for example two activities washing and cutting. Meertens et al. (2011) propose techniques from business process management to create the attended output. However, in contrast to the example, R&D activities are considered as a black box, which makes them hard to specify. It is possible to cluster activities in groups, but the number of techniques offered by business process management is considerable, it is necessary to look deeper into the field of business processes in R&D.
Literature review
[image:39.595.127.544.493.678.2]Process orientation and thinking has entered the engineering environment in the last two decades. The literature review for this step is based on a process perspective and uses the search process of section 2.1 as a basis.
28
One of the main directions within innovation process management literature is the Stage-Gate process. Since its introduction (Cooper, 1990) it has been the basis of inspiration for a lot of research (in example Biazzo, 2009; Chao & Kavadias, 2008; Cooper, 2008; Kahn, Barczak, & Moss, 2006; Page & Schirr, 2008; Peters, 2006; Smeds, Haho, & Alvesalo, 2003). Cooper (1990) defines the Stage-Gate system as both a conceptual and an operational model for moving a new product from idea to launch. It can be used to manage the new product development process to improve effectiveness and efficiency (Cooper, 1990). The process from idea to launch is divided in stages of which each stage consists of a set of activities. This is then followed by a gate where a Go/Kill decision is made (see Figure 2-6 for example).
Figure 2-6: Example Stage-Gate system (Cooper, 1990)
The Stage-Gate system has been criticized for the lack of flexibility in uncertain environments (Iansiti, 1995) and as not being suitable for radical innovation (Brentani & Reid, 2012; Veryzer Jr, 1998). Iansiti (1995) proposes a flexible model as an alternative for the Stage-Gate system. His criticism is based on the assumption that a Stage-Gate system has an early concept freeze. In case of the flexible model, the concept freeze moves as close to the market introduction as possible and therefore can react to changes in a turbulent environment.
29
Figure 2-7 shows the differences between the Stage-Gate system (traditional model) and the flexible model. According to Iansiti (1995) in the flexible model the concept development and implementation are tightly linked set of activities and not sequential phases like in the traditional model. By overlapping these two stages and thereby moving the concept freeze, the flexible model allows being responsive to in a turbulent environment. This perspective is followed by other authors as well (in example Haque & Pawar, 2001; Kamoche & e Cunha, 2001).
Other authors (Brentani & Reid, 2012; McDermott & O'Connor, 2002; Veryzer Jr, 1998) argue that the development process of radical innovation is a distinct process than the Stage-gate system. Radical innovation requires a less structured process, while the structure contradicts with creativity. Coincidence and fortuitousness are recurrent aspects of this messy process (Veryzer Jr, 1998). Furthermore radical innovation is not that customer driven as incremental innovation (Veryzer Jr, 1998). Figure 2-8 shows the radical innovation process according to Veryzer Jr (1998).
Figure 2-8: Radical innovation process (Veryzer Jr, 1998)
30
[image:42.595.213.457.243.454.2]this conclusion with the example of writing a scientific article. The two activities are problem formulation and problem solving and the two stages are planning and execution. Example (a) shows the organisational dimension as such the two stages and gates. Then, examples (b1, b2) give an example of how this relates to the two activities. In (b2), these activities follow a similar timeline as the gates and after a decision at the gate is taken, the activity is finished as well. In (b1), activities have shifted to another stage and thereby overlapping the stage gates.
Figure 2-9: Example (Iansiti, 1995)
Notice that there is no difference between the stages on the organisational dimension, but there is a difference on the informational dimension. Another conclusion of (Biazzo, 2009) follows this reasoning and suggests that simultaneity in task execution does not influence the organisational dimension, only the informational one. Therefore he concludes that flexibility can occur in a form of Stage-gate system.
31
projects 2) Stage-Gate Xpress is meant for medium risk projects and 3) Stage-Gate Lite for minor changes.
Figure 2-10: Scales of Stage-Gate Systems
[image:43.595.144.523.153.329.2]Furthermore, Cooper (2009) addresses the need for adaption to radical innovation as well. Based on examples from practices from various organisations, he suggests modifications of the front-end of the Stage-Gate system and positions technology development as a feeder for new product developments (Figure 2-11).
Figure 2-11: Technology Development Projects
32
Concluding remarks
Although some authors criticise the flexibility of the Stage-Gate system, others argue that the Stage-Gate system can be flexible as well. Furthermore it is important to understand that there is no one way NPD (Cooper, 2009), every company needs to adopt its own version. Finally, authors as well as organisations see the importance of a different process for technology development (or radical innovation).
R&D characteristics
A comparison based on the R&D characteristics does not seem relevant. The focus lies on the difference between incremental and radical innovation (managing activities). It is important to understand that radical innovation requires a different approach with less structure, but this does not mean any structure at all.
2.3.4 Quantify model
Proposed technique(s) – Activity Based Costing
33
Literature review
[image:45.595.134.535.169.283.2]A literature research is done to search for other cost allocation techniques. The search process for this research is visualized in Figure 2-12.
Figure 2-12: Search process section 2.3.4
Most of the literature focuses on the financial control for the process of R&D (Abernethy & Brownell, 1997; Lev et al., 2005; Rockness & Shields, 1984) or on treating R&D as expense or capital asset (Daley & Vigeland, 1983; Wyatt, 2005). There seems to be no literature on costing assignment for R&D in the top 5 accounting journals.
Nevertheless, there are systems available for an organisation to assign costs, which can be distinguished in traditional systems and more refined systems like Activity-Based Costing (ABC) (Drury, 2007). Process costing, job costing and a hybrid form of these two are considered as traditional systems. Process costing allocates costs to masses of identical or similar units of a product or service and job costing allocates costs to an individual unit, batch, or lot of a distinct product or service (Horngren, Foster, & Datar, 2006). Not only products or services can be cost objects, also a customer, product category, period, project (R&D/reorganisation), activity or a department may qualify as a cost object. ABC refines a costing system by assigning cost to individual activities.
R&D characteristics
34
distinct product or service. As mentioned, this research considers an R&D organisation as an organisation which is built on projects. Although project management techniques are used to create uniform structures like NPD processes, this does not mean that process costing can be used. These kinds of structures do not cluster uniform activities but try to support the process of delivering certain outputs. Each output is unique or has its unique features and therefore job costing is a suitable technique for R&D.
2.4
Conclusion
35
Chapter 3.
Solution Design
In Chapter 2, the BMM is presented as a generic methodology to build a business model. This methodology consists of six steps and within every step a technique or method is used to produce the necessary deliverables. Therefore, the BMM can be described as a method of methods. Then, a literature search has been done to find out which methods are suitable within the first four steps (‘as-is’ situation) and how these methods meet R&D characteristics. Section 2.3 gives an overview of the suitable methods for each step.
In this chapter, the choice for which method to use in each step is made. By choosing for each step a method which is suitable for a R&D environment, the BMM is tailored from a generic method to a more specified method to build a business model for a R&D organisation. Step five and six (‘to-be’ situation) are not taken into account, as these steps stand re-use the first four steps and/or use non R&D specific techniques. The visualisation in Figure 3-1 on the next page is the common denominator of this chapter.
36
37
3.1
Identify roles
[image:49.595.194.470.186.270.2]First, the choice for the method is argued, followed by a presentation of the method. Finally, the position of the method within the business model is reviewed.
Figure 3-2: Step 1 BMM - Identify Roles
3.1.1 Choice
Although the proposed Stakeholder Analysis (Pouloudi & Whitley, 1997) is suitable for R&D, based on the perspective of the external linkages another technique is chosen. The Stakeholder Analysis (SA) of Elias et al. (2002) is more suitable, because it scores better on the R&D characteristics, project management and risk management.
The dynamics of the stakeholder is an important aspect of this SA, because the lifetime of a R&D project usually is longer than other projects. The changing interest of stakeholders is an important factor, especially for risk management, but for top management support as well. With this SA, the course of the stakeholder can be estimated and used during a project.
3.1.2 Presenting the Stakeholder Analysis
38
Table 3-1: Stakeholder Analysis based on (Elias et al., 2002)
Rational Level
In this level, the various stakeholders are identified together with their stakes. In the last step of this level, the stakeholders are placed in a two dimension grid (stakes and power). A stake is distinguished by equity, economic and influencers, and power is distinguished by formal/voting, economic and political power. The information needed can be obtained using the organisations’ documentation and interviews. At the end of the first four steps, there is an understanding of who the stakeholders are and what their perceived stakes are.
Process Level
In this step is analysed how the project manager explicitly or implicitly manages the relations with the stakeholders. Are there any protocols or organisational processes for the management of these relations? This outcome then needs to be analysed if it is in line with the stakes and power of that stakeholder according to the rational level analysis. The information needed can be obtained using the organisations’ documentation and interviews.
Transactional Level
39
Capability index
[image:51.595.323.503.125.278.2]The capability index can be determined by placing the project within a two dimensional grid. This grid contains the axes process and transactional level (Figure 3-3). The visualisation allows to quickly overview how the stakeholders perform on process and transactional level.
Figure 3-3: Stakeholder Management Capability
Dynamics of the stakeholders
[image:51.595.103.525.248.552.2]Goal of this step is to capture the dynamics of a stakeholder. The stakeholders are classified according to eight types, which are identified by the possession or attributed possession of one or more of the relationship attributes: power, legitimacy, urgency. The stakeholder typology helps to estimate the influence of possible shifts of stakeholders and how to respond to that on process and transactional level.
Figure 3-4: Dynamics Stakeholders
The deliverable of this step is a role list resulting from the rational level steps. However, the rest of the analysis gives valuable information on how stakeholders are managed and more important, it gives insight in the changing interests of stakeholders during a project. Not only enables this insight a project manager to foresee possible risks, it can result in pointers for improving or innovating the business model.
Process level
Transactional level
High
Low
40
3.2
Recognise relations
[image:52.595.98.533.495.718.2]First, the choice for the e3-value model is argued, followed by a presentation of the method. Finally, the position of the method within the business model is reviewed.
Figure 3-5: Step 2 - Recognise Relations
3.2.1 Choice
Although the e3-value model originated from the field of e-commerce, it appears suitable for the BMM for R&D as well. E3-value model it main focus lies on business networks, which is in line with the emphasis on external linkages of the fifth generation of R&D management. Furthermore, this technique offers a way to explicit the value exchange between stakeholders.
3.2.2 Presenting the e3-value model
For this technique, seven constructs can be used: actor, value object, value port, value offering, value interface, value exchange and market segment.
Actor Graphic representation
Meaning With whom do I collaborate to deliver my value proposition? Input SA
Value object No graphic representation -
Meaning Is everything that has economic value for one of the actors Input SA
Value port Graphic representation
41
ownership
Input SA, business processes Value
offering Graphic representation
Meaning What service or product bundling is offered or requested by an actor Input -
Value
interface Graphic representation
Meaning The value interface groups in-going and -going value offerings and models economic reciprocity
Input - Value
exchange Graphic representation
Meaning Connects two value ports of at least two actors with each other Input SA
Market
segment Graphic representation
[image:53.595.97.534.103.447.2]Meaning What service or product bundling is offered or requested by an actor Input -
Figure 3-6 is an example of the use of this method.
Figure 3-6: Example e3-value model (Gordijn 2001)
[image:53.595.106.469.484.639.2]