ARCHITECTURAL ELEMENTS OF BURIED VOLCANIC
SYSTEMS AND THEIR IMPACT ON GEOENERGY
RESOURCES
by
ALAN PATRICK BISCHOFF
A dissertation submitted in partial fulfilment of the requirements for the Degree of
DOCTOR OF PHILOSOPHY IN GEOLOGY
Abstract
This PhD investigates the architecture of volcanic systems buried in New Zealand sedimentary basins. These “fossil” volcanoes occur in great numbers around the globe, typically comprising complex magmatic-sedimentary systems that produce large impacts in the evolution of the host sedimentary basin. The interaction between magmatism and sedimentation creates a range of geological conditions that can favour the occurrence of geoenergy resources, such as hydrocarbons and geothermal energy. Interpretation of volcanoes in the subsurface requires a multidisciplinary approach that combines insights from complementary disciplines, such as sedimentology, stratigraphy, and volcanology into a unified model. Over the last two decades, knowledge of volcanic systems in sedimentary basins has increased significantly, largely due to improvements in the quality and availability of seismic reflection data. This PhD research uses data from 2D and 3D seismic reflection surveys to characterise the spatio-temporal distribution of the fundamental building blocks (i.e. architectural elements) of buried volcanic systems, aiming to provide insights for exploration of geoenergy resources. Here, we divide the stratigraphic record of these “volcanic basins” into three first-order magmatic sequences (i.e. pre-, syn- and post-magmatic), which can be sub-divided into second-order magmatic stages related to the emplacement, construction, degradation and burial of the volcanoes.
In detail, the architectural elements of each volcanic system also display differences. Dikes and sills of the KVS plumbing system typically formed along, or branching from, simultaneous Miocene rift faults. Explosive submarine volcanism in Kora formed a large-volume (ca 95 km3) basaltic-andesitic compound volcano erupted from a fixed central conduit, which dominated seafloor topography and created localized debris deposits that interfinger with hemipalagic sediments and deep-water channel deposits. In contrast, the monogenetic MVS plumbing system distributed magma to dispersed eruptive centres, which formed small-volume (< 6 km3) basaltic submarine volcanoes equivalent of maar-diatreme and tuff cones erupted at ca 1000 m depth. Degradation of volcanoes in the MVS was differential, with strong erosion on the top of shallower and higher edifices that were emergent above sea-level during a late Miocene base-level fall, while volcanoes that remain below the sea-level were not subject to significant degradation and are now well preserved beneath bathyal sediments.
Dedication
Acknowledgments
I would like to thanks my supervisors Andy Nicol, Mac Beggs, Darren Gravley and Ben Kennedy for the support and guidance during this PhD research. Thanks for Mark Webster for reviewing the thesis, and for Paul Ashwell, Carlos Kazianis, Jarg Pettinga, Alex Nichols, Kari Basset, Michael MacMaster, Karoly Németh, Priscila Smith, David Clague, Jim Cole, Elisabeth Bertolett, Josh Borella, Jonathan Davidson, Marlene Villeneuve, Catherine Reid, Gabor Kereszturi, and Samuel Hampton for providing support for my geological interpretations. Thanks for the technical support from Matt Cockcroft, Sacha Baldwin, Rebekah Hunt, Jane Newman, Janet Warburton, Lizzy McKinnon, Te Maire Tau, Rob Spiers, Rachel Musgrave, Abbey Douglas, John Southward, and Chris Grimshaw. Without your help, this work will not be possible. Thanks for the Electron Microscopic Center and Geology laboratory of the University of Canterbury for providing access and material for this thesis. Thanks for Sylvia dos Anjos, Sverre Plank, Leonardo Oliveira, Maria José Oliveira, Anna Kwasniewski, Webster Mohriak, Pujon Wang, Ari Roisenberg, Evandro de Lima, Claiton Scherer and Luis Fernando de Ross for the constructive interaction with our research group during these years. Thanks for Sverre Plank, Christopher Jackson and Simon Holford for reviewing Chapter 3 priority to publication in the AAPG Interpretation Journal in 2017, and for Simon Holford and Adrian Pittari for examining the thesis. Thanks for Andrew Miall, despite we haven’t met, your work has inspired this PhD thesis. Special thanks for my workmates Andrea
Contents
1 Introduction ... 24
1.1 Research Rationale ... 24
1.2 Research Hypothesis ... 25
1.3 Research Objectives ... 25
1.4 Studied Areas ... 26
1.5 Thesis Structure ... 27
1.6 References ... 30
2 Concepts and Techniques ... 33
2.1 Fundamental Concepts of Seismic Reflection Interpretation ... 34
2.2 Seismic Imaging of Igneous Rocks in Sedimentary Basins ... 36
2.3 Seismic Attributes ... 37
2.4 Seismic Stratigraphy ... 39
2.5 Seismic Volcano-Stratigraphy ... 40
2.6 Sequence Stratigraphy... 41
2.7 Sequence Volcano-Stratigraphy ... 43
2.8 Seismic Geomorphology ... 43
2.9 Stratigraphic Record of Volcanism ... 45
2.10 Sedimentary and Volcanic Architectural Elements ... 45
2.11 Architectural Elements Analysis Applied in Geoenergy Exploration ... 48
2.12 Conclusion ... 49
2.13 References ... 49
3.2 Introduction ... 57
3.3 Kora Volcano Geologic Setting and Exploration ... 58
3.4 Data and Methods ... 61
3.5 Stratigraphy of Architectural Elements of Kora Volcanic System ... 62
3.5.1 Syn-Magmatic Sequence ... 62
3.5.2 Post-Magmatic Sequence ... 72
3.6 Economic Potential and Petroleum Plays ... 80
3.6.1 Syn-Magmatic Traps and Reservoirs ... 81
3.6.2 Post-Magmatic Traps and Reservoirs ... 82
3.7 Conclusions ... 83
3.8 References ... 84
4 Seismic Reflection and Petrographic Characterisation of a Buried Monogenetic Volcanic Field 89 4.1 Abstract... 89
4.2 Introduction ... 90
4.3 Geological Setting ... 93
4.4 Dataset, Methods and Limitations ... 96
4.4.1 Data Set ... 97
4.4.2 Petrography, RXF and SEM-EDS Methods and Limitations ... 97
4.4.3 Methods and Limitations to Reconstruct Buried Volcanoes from Seismic Data .... 99
4.4.4 Seismic Stratigraphy Methods ... 107
4.5 Geological Characterisation of Maahunui Volcanic Field ... 110
4.5.1 Results from Petrography, RXF and SEM-EDS Analysis ... 110
4.5.2 Age of the MVF and depth of the monzogabbro intrusion ... 126
4.5.5 Paleo-Physiography and Paleo-Environmental Reconstruction ... 134
4.5.6 Vent Distribution and Eruptive Fingerprint ... 140
4.6 Controls on MVF Morphology ... 141
4.6.1 Eruptive Styles and Edifice Growth Mechanisms ... 142
4.6.2 Post-Eruptive Paleogeography ... 144
4.7 Conclusions ... 147
4.8 References ... 147
5 Stratigraphy of Architectural Elements in a Buried Monogenetic Volcanic System ... 156
5.1 Abstract... 156
5.2 Introduction ... 157
5.3 Concepts, Methods and Terminology ... 160
5.4 Stratigraphy of Architectural Elements of Maahunui Volcanic System ... 165
5.4.1 Syn-Magmatic Sequence ... 165
5.4.2 Post-Magmatic Sequence ... 194
5.5 Conclusions ... 197
5.6 References ... 198
6 Models for Exploration of Geoenergy Resources in Monogenetic Volcanic Fields within Sedimentary Basins ... 205
6.1 Implications for Geoenergy Resources ... 205
6.2 Petroleum Plays in Buried Monogenetic Volcanic Fields ... 205
6.2.1 Petroleum Elements of the Emplacement Stage ... 207
6.2.2 Petroleum Elements of the Constructional Stage ... 208
6.2.3 Petroleum Elements of the Degradational Stage ... 209
6.2.4 Petroleum Elements of the Burial Stage ... 210
6.5 References ... 214 7 Conclusions ... 218 8 Appendix 1: Complementary Information of the Methods Used to Calculate the Height and Volume of Buried Volcanoes from Seismic Reflection Data ... 223
List of Figures
Figure 1: Diagram showing the workflow adopted in this PhD research. Seismic reflection and well data were
integrated with observations from outcropping analogue systems. ... 33
Figure 2: Fundamental concepts of seismic reflection acquisition and interpretation. Modified from Sheriff and
Geldart (1995) and Wright (2013). Seismic line in A is from Canterbury Basin, New Zealand. Seismic image
from Bischoff (unpublished data, 2015). ... 35
Figure 3: 2D profile of a seismic survey in Canterbury Basin, New Zealand. Figure A shows the vertical wiggle track
at individual shot points. Strong impedance contrasts display positive amplitude peaks. These peaks can be
laterally tracked (B) to display the subsurface characteristics of the area such as lithological contacts,
geological units geometries and chronostratigraphic surfaces. Seismic images from Bischoff (unpublished
data, 2015)... 35
Figure 4: Saucer-shaped sills imaged in the Waka 3D seismic survey (e.g. Blanke, 2010) from offshore Canterbury
Basin, New Zealand. The locations of the sills are highlighted by the blue ellipses. Image from Bischoff
(unpublished data, 2015). ... 36
Figure 5: 2D seismic section (A) and 3D opacity rendering (B) of a potential sill-fed volcano in the Nimitz-3D seismic
survey, Taranaki Basin, New Zealand. Note that the intrusive and extrusive parts of the volcano show high
amplitude reflectors in contrast with basin sedimentary strata. Images from Bischoff (unpublished data,
2018). ... 37
Figure 6: 2D seismic profile (A) and time-slice view (B) of a saucer-shaped sill intruding into marine sedimentary
strata, offshore Taranaki Basin in the Vulcan-3D seismic survey. Purple ellipses display the relevant
information of the 3D survey for the analysed data. Top image shows a 2D section of a saucer-shaped sill
evidenced by the attribute envelope. Bottom image show the same saucer-shaped sill in plan, evidenced by
the attribute amplitude at a time-slice at 3.7 TWT sec. Yellow line in top image is the reference for the time
slice in the bottom image. Seismic images from Bischoff (unpublished data, 2018). ... 38
Figure 7: (A) Common internal seismic reflection configurations, and (B) seismic reflection terminations observed
in seismic data. Modified from Mitchum et al. (1977); Emery and Myers (1996); Catuneanu (2006), and
Wright (2014). ... 39
Figure 8: Diagram showing the evolution of sequence stratigraphic approaches. From Catuneanu et al. (2010). .... 41
Figure 9: Allogenic controls on sedimentation, and their relationship to environmental energy flux, sediment
Figure 10: Model-independent workflow vs. model-dependent choice in sequence stratigraphy presented in
Catuneanu et al. (2009) and Catuneanu et al. (2010). The model-independent workflow leads to the
subdivision of the stratigraphy into a succession of genetic units separated by sequence stratigraphic
surfaces. After this sequence stratigraphic framework is built, the geoscientist may make model-dependent
choices with respect to the selection of surfaces that should be elevated to the status of sequence boundary.
In this study, after following a model-independent approach for the recognition of the stratal pattern of the
basins, we propose the use of magmatic sequences and stages to subdivide the stratigraphic record of
volcanic basins. Abbreviations: forced regressive (FR), normal regressive (NR) and transgressive (T) surfaces.
... 42
Figure 11: A) Channelized lava flow erupted from Kilauea Volcano, Lower East Rift Zone, Hawaii. B and C) 3D and
2D seismic images of an analogue channelized lava flow in Vulcan-3D, offshore Taranaki, New Zealand). This
3D volume together with the nearby Romney-3D reveal several large late Cretaceous polygenetic volcanoes
that formed in association with rifting and opening of the Tasman Sea. Figures B and C from Bischoff
(unpublished data, 2018). ... 44
Figure 12: Seismic images showing the morphology of shallow intrusions that fed an extrusive flow at the early
Paleocene paleosurface in Otway Basin, Southern Australia. (A) Arbitrary 2D seismic reflection profile. (B) 3D
opacity-rendered view. From Holford et al. (2012). ... 44
Figure 13: Stratigraphic model showing the faciological distribution and architecture of a hypothetical volcanic
system. Deposits show lateral variation with increasing distance from the eruptive centre. Vertical succession
occurs by the alternation of syn-eruptive and inter-eruptive deposits, bounded by proxies of
chronostratigraphic surfaces. Figure from Orton (1996). ... 45
Figure 14: 3D representation of the main deep-water architectural elements. From Haughton (2006). ... 46
Figure 15: Examples of volcanic architectural elements in Lyttelton Volcano, Banks Peninsula Volcanic Complex.
Each one of these elements is a three-dimensional rock unit genetically related to a particular process or a
suite of processes occurring within the volcano. These elements are separated from each other by internal
facies (e.g. composition, fragmentation, grain size), and external bounding-surfaces (e.g. cross-cutting
relationship, angular or sharp contacts, changes in paleo-flow directions). ... 47
Figure 16: An example of the hierarchy of volcanic architectural elements in Tongariro Volcanic Complex, New
Zealand. In a large-scale, the Red Crater (A) is one of several vents that compose the Tongariro Volcanic
Complex. Downscaling, the flanks of the Red Crater are mainly composed by bedded inclined pyroclastic
air-fall deposits, minor lava flows, and cross-cutting feeder dikes (B). A detailed view of part of the Red Crater
flanks (C) show a succession of individual coarse-grained air-fall deposits, formed by changes in the dynamics
of a single eruption, or by accumulation of tephra due to multiple eruption-cycles. At each scale, these sets
of individual rock units (i.e. architectural elements) are formed in response to co-genetic processes occurring
over a particular time-scale, and are physically separated from each other by a hierarchy of internal and
external bounding surfaces. ... 48
Figure 18: Local chronostratigraphic chart showing the age and occurrence of the main lithostratigraphic units in
the study area. Compiled from Bergman et al. (1992), King and Thrasher (1996), OMV (2011), and insights
from this study. Stratigraphic ages modified from the International Chronostratigraphic Chart 2014 and New
Zealand Geological Time Scale 2015. ... 59
Figure 19: Schematic representation of the stratigraphic sequences, magmatic sequences, stages, architectural
elements, and predominant processes associated with the Kora volcanic system. Numbers in circles
represent the location of the architectural elements indicated in the key. Numbers in squares indicate
predominant processes in the key. The symbols in the bottom part of the architectural elements key
illustrate the database used on the interpretations. The terms “observed in seismic” represent architectural
elements find in seismic data, “drilled” represent architectural elements sampled by wells, and “analogues”
represent architectural elements recognized in modern and ancient analogues. Conduit zones and dikes have
lateral thickness exaggerated for visualization proposes. Abbreviations are SyInS (syn-intrusive surface),
PrErS (Pre-eruptive surface), PoErS (post-eruptive surface), PoDgS (post-degradational surface) and PoBuS
(post-burial surface). More details about these volcano-stratigraphic surfaces in chapter 5. ... 63
Figure 20: A 2D seismic section of the Kora volcano and a representation of the main stratigraphic sequences and
processes. Note the progradation of clinoforms from the southeast to the northwest. ... 64
Figure 21: Seismic images of pre-magmatic strata deformed during magma emplacement. (a) Time slice in dip of
maximum similarity seismic cube showing faults in radial pattern and the circular structure of the Kora
volcano. The FFD is a forced-folded dome pushed up by underlying sills and dikes intrusions. (b) Inline and
crossline sections of the Kora volcano combined with a volume rendering seismic envelope showing the
pre-eruptive dome (evident in red, corresponding to the Tangaroa Formation). ... 65
Figure 22: Seismic images of syn-intrusive architectural elements. (a) High-amplitude geobody extraction revealing
the 3D geometry of a saucer-shaped intrusion. (b and d) Detail of the intrusion showing a semi lobate body
in plan view with magma-fingers structures at the terminations. (c) The 2D cross section of the amplitude
anomaly. ... 66
Figure 23: Seismic images of syn-intrusive architectural elements. (A) Cross section applying the optical stacking
technique. (B) Geobody extraction of high-amplitude anomalies (red) showing sill and dikes jacking-up the
overlaying sedimentary strata. (C) Volume rendering envelope showing the distribution of high-amplitude
geobodies. Note that the bodies are concentrated toward the southern and eastern part of the seismic cube,
region where the Miocene rift faults are more frequent and present larger displacement. ... 67
Figure 24: Seismic images of syn-intrusive and syn-eruptive architectural elements. (A) Time slice through the dip
of maximum similarity seismic cube at 1084 ms TWT. The darker blue colours represent the core of parasitic
vents and cone sectors, whereas the lighter blue colours represent sedimentary strata that onlap these
structures. Note the radial pattern of lineaments associated with the smaller parasitic and satellite vents
circled in yellow and green. (B) The 2D cross section showing the relationship of parasitic vents and conduit
zones. (C) A 2D cross section showing mount-like structures interpreted to be small parasitic vents. ... 68
Figure 25: Seismic images and outcrop analogues representing the syn and inter-eruptive architectural elements of
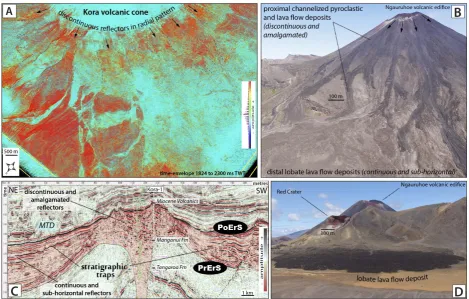
Geometry of eruptive (air fall, pyroclastic density currents, and lava flow deposits) and sedimentary deposits
on Ngauruhoe volcano and Red Crater, Tongariro National Park, New Zealand. Note that on the flanks of the
volcano, the deposits are amalgamated and discontinuous, and in the foothills, deposits form continuous and
lobate bodies. (A and C) These geometric patterns are also recognized in seismic images of the Kora volcano.
... 69
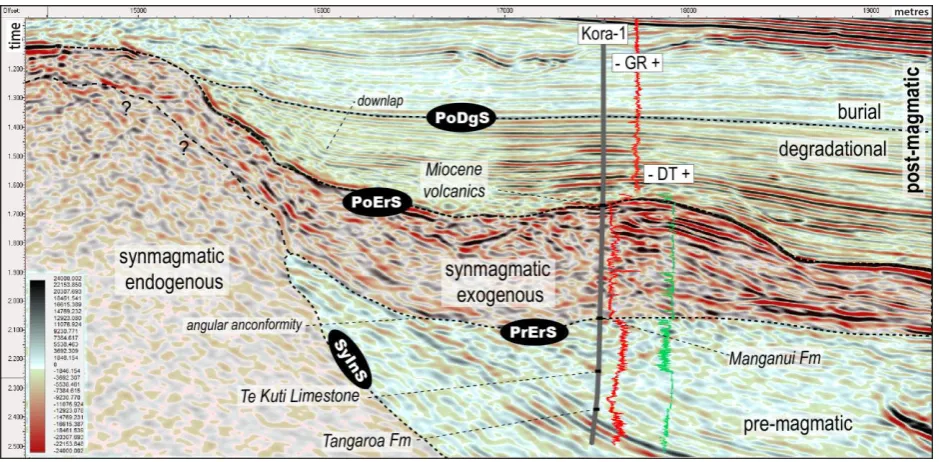
Figure 26: A 2D seismic section showing the endogenous and exogenous part of the syn-magmatic sequence,
overlaying strata from the pre-magmatic sequence and covered by strata from the post-magmatic sequence.
The 3D seismic cube is tied with lithofacies and well logs drilled on the wells (e.g., Kora-1, red = gamma ray
and green = density). ... 70
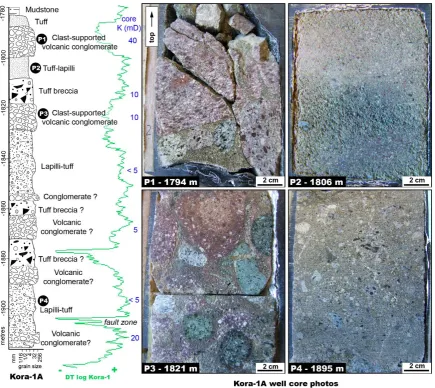
Figure 27: Well-core description and photographs of the main lithofacies recovered on the Kora-1A well. The green
curve is the density log from Kora-1, located 50 m from Kora-1A. Numbers in blue are permeability
measurements from Kora-1A cores. P1: Polymictic (more than three types of volcanic clasts) clast-supported,
rounded volcanic conglomerate with sandy matrix; P2: sorted tuff; P3: polymictic clast-supported,
well-rounded volcanic conglomerate; and P4: moderately sorted lapilli-tuff. ... 71
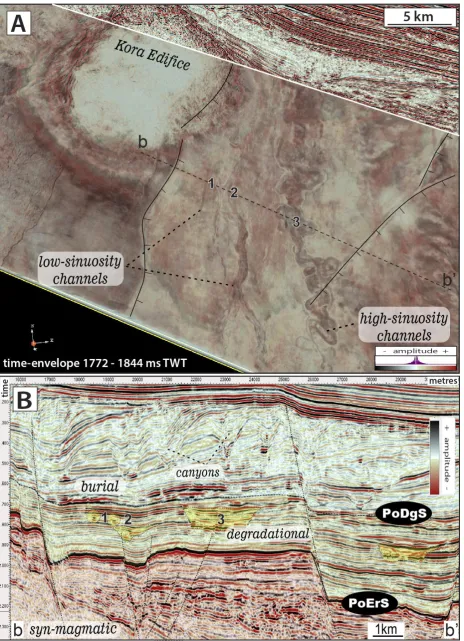
Figure 28: Seismic images of architectural elements formed during the degradational stage. (a) Composite cross
section and volume rendering envelope showing the Kora volcano and the relationship with Late-Miocene to
Pliocene deep-water channel systems. (b) Detailed 2D cross sections showing low sinuosity (1, 2) and
high-sinuosity channels (3). ... 73
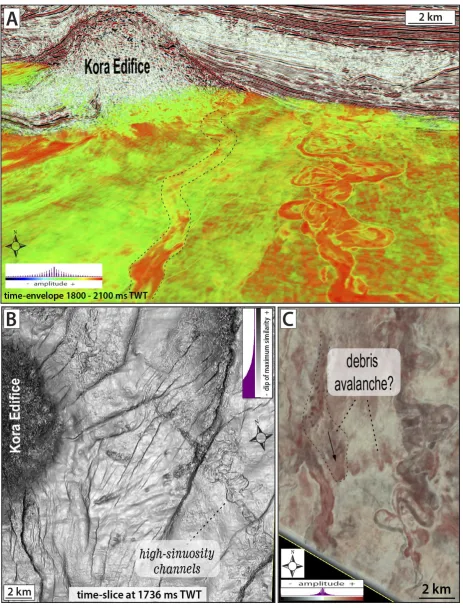
Figure 29: Seismic images of architectural elements formed during the degradational stage. (a) Composite cross
section and volume rendering showing the Kora volcano and the relationship with deep-water channel
systems. (b) Time-slice on the dip of the maximum similarity cube showing faults in the radial pattern (closer
to the cone) interfering with the northeast faults from the Miocene rift. Note that some of the faults are
compartmentalizing the high-sinuosity channel deposits. (c) Volume rendering envelope showing low and
high deep-water channels and possible debris avalanche deposits. ... 75
Figure 30: Seismic images of architectural elements formed during the burial stage. (a) Composite cross section
and volume rendering envelope showing the Kora volcano and the lobate sheet-like deposits. (b) Dip section
showing the lobate sheet-like deposits in detail. Note the foreset indicating migration of clinoforms from the
southeast to northwest at the burial interval. (c) Cross section showing the lobate sheet-like deposits
perpendicular to the paleodepositional direction. Note that most of faults do not displace sediments
deposited during the burial period. ... 76
Figure 31: Seismic images of the architectural elements formed during the burial period. Note the dome over the
buried Kora volcano and the sedimentary systems that interact with the second seamount. The volcanic
edifice was completely buried by approximately 4 Ma ago and still had a strong influence on the
development of sedimentary systems until at least the Pleistocene. (a) Dip of maximum similarity cube
showing the location of the buried Kora volcano and the development of fans, deltas, dendritic drainages,
gullies, and canyons during the progradation of the slope (northwest) and establishment of a shelf
Figure 32: Seismic images of architectural elements formed during the burial stage. Time slice through the dip of
maximum similarity cube showing the relationship of the buried Kora volcano and the enclosing sedimentary
architectural elements. The dashed line represents the position of the shelf break. ... 78
Figure 33: Overlap of the dip of the maximum similarity seismic cube and the amplitude volume rendering seismic
cube showing the main geometrical shape of the seamount-edge fans and the relationship with the
seamount produced due to the burial of Kora volcanic edifice. ... 79
Figure 34: A) Map showing the age and location of volcanic rocks onshore and offshore northern Canterbury Basin,
together with the main seismic and well data used in this work. Red dots indicate the locations of volcanoes
in the Maahunui Volcanic Field, which is the focus of this study (Chapters 4 & 5). Location of Paleogene to
Cretaceous offshore volcanoes were mapped in association with Andrea Barrier (UC PhD candidate in
structural geology). Onshore volcanoes are from GNS geologic map (Forsyth et al., 2008). B) New Zealand
topographic and bathymetric map from the NZ Petroleum Exploration 2018 datapack. Black square in B)
shows the location of the detailed map in A. ... 93
Figure 35: 2D regional strike/oblique seismic line showing the stratigraphic architecture, the main geotectonic
events in the northern part of the Canterbury Basin, and the occurrence of the MVF (red). The Resolution-1
and Clipper-1 wells were used to tie the seismic data to chronostratigraphic surfaces that represent
important changes during the basin evolution. Cretaceous-Paleogene surfaces and rift faults courtesy of
Andrea Barrier, UC PhD candidate in structural geology. ... 94
Figure 36: Local chronostratigraphic chart of the study area. We subdivide Tokama Siltstone within the vicinity of
MVF into 4 depositional units according to their depositional setting (in blue). Two main volcanic events
within northern Canterbury basin during the Miocene emplaced MVF and Banks Peninsula. The main
magmatic events are each represented by pre, syn and post-magmatic sequences, and are shown in the right
part of the figure. Stratigraphic ages follow the International Chronostratigraphic Chart 2014 and New
Zealand Geological Time Scale 2015 (Raine et al., 2015). ... 96
Figure 37: Seismic morphometric measurements and example of morphology classification of MVF volcanoes. A)
Shows a positive symmetric cone (crater-type). B) Shows a compound morphology. Bottom part (nf01 in light
red) has a negative funnel-like shape (crater-type) and its lateral association. Upper part (pc13 in light blue)
shows a positive asymmetric cone shape (crater-type) and its lateral association. Note that pc13 have one of
the flanks eroded by canyons. TWT in the seismic lines are convert to distance in metres using the method in
section 4.4.3.1. ... 101
Figure 38: 2D dip section (line CB-82-06) showing evidence of differential degradation related with the late
Miocene (lM) unconformity and of differential compaction (burial doming and “seagull wings”). PrErS is the
pre-eruptive surface, while PoErS is the post-eruptive surface. PoDgS is the post-gradational surface. ... 105
Figure 39: A) Isochron map between pre-eruptive (PrErS) and post-eruptive surfaces (PoErS) of MVF showing the
location of MVF cone-type volcanoes. Note that the surfaces thin and amalgamate with increasing distance
from individual or clusters of volcanoes, defining the seismic detectable boundaries of MVF. B)
Uninterpreted seismic section across volcano pc-14. C) Interpretation of seismic section in B) showing the
surface due to computer limitations, as they would have shown a false positive structure in the isochron
map. ... 109
Figure 40: Macroscopic and microscopic photographs of the monzogabbro recovered from a depth of -1962.25 m
in the Resolution-1 well. A) Photograph of a medium-grained leucocratic intrusive rock composed of
plagioclase (pl) and pyroxene (aug). Zeolite analcite (zeo) occurs filling cavities. Chlorite (chl) occurs as an
alteration of primary minerals. Thin-section photographs in plain (B and D) and cross-polarized light (C and E)
showing ophitic texture of plagioclase (pl) and augite (aug), olivine (ol) crystals partially replaced by
iddingsite (id), and clinopyroxenes (aug) replaced by biotite (bi) and chlorite (chl), which suggests magma
crystallization at shallow depths and H2O interaction. Accessory minerals are: opaques (op) and apatite (ap).
Photographs and petrographic identifications were made in conjunction with Marcos Rossetti (UC PhD
candidate in physical volcanology). ... 111
Figure 41: Macroscopic and microscopic photographs of the monzogabbro recovered at -1962.25 m in the well
Resolution-1. Thin-section in cross-polarized light (A), plain light (B) and macroscopic polished section (C)
showing augite (aug) and plagioclase (pl) with ophitic texture. Thin section in cross-polarized light (D) and
natural light (E) showing zeolite (zeo) filling interstitial space and plagioclase altered to clays. Macroscopic
photograph of Resolution-1 core at the depth of 1663 m (C) showing augite, plagioclase, acicular crystals of
zeolite and miarolitic cavities (mia). Photographs and petrographic identifications were made in conjunction
with Marcos Rossetti (UC PhD candidate in physical volcanology). ... 112
Figure 42: Composite well data of the Oligocene-Miocene interval of Resolution-1 well showing the lithologies,
ages, paleo-environments, stratigraphy and wire-logs. Symbol bs@ is the given biostratigraphic age in
Schiøler et al. (2011). Blue dashed lines show the bathymetry trend. Numbers in black ellipses are ages
according to the 2015 NZ Geologic Time Scale (Raine et al., 2015). Numbers in red ellipses are estimated ages
of the MVF based on the integration of these dataset. ... 114
Figure 43: A) Macroscopic photograph of an unwashed cuttings sample of a massive siltstone containing benthonic
foraminifera recovered from the interval 1120 to 1130 m from the Resolution-1 well (middle Tokama). B)
Microscope photograph in crossed-polarized light of unwashed cutting samples of volcanic clasts and a
gastropod in a muddy matrix from the interval of 1130 to 1140 m in Resolution-1. ... 116
Figure 44: Macroscopic photographs of unwashed cutting samples from the interval of -1130 to -1140 m in
Resolution-1. A) Volcanic fragments and bioclasts immersed in a muddy matrix. Black fragments are mainly
altered pyroxenes (B). ... 118
Figure 45: Macroscopic photographs of plagioclase (pl) and pyroxene (py) phenocrysts in microporphyritic texture
(A), and a broken plagioclase fragment (B). C to F show photographs in cross-polarized thin-section of rocks
with microporphyritic and vitrophyric textures. Note that phenocrysts with broken angular borders (C and F)
are associated with peloidal (pel) and palagonite (pal) clasts. ... 120
Figure 46: Macroscopic images of volcanic fragments submerged in water (A) during the washing process of
samples from the interval of -1130 to -1140 m in Resolution-1. These rocks show altered microporphyritic
Figure 47: A and B) Macroscopic images of loose shards with cuspate, cuneiform, blocky (blo) and platy (pla)
shapes, and common relic bubble walls (bw). C) Hypocrystalline fragment containing concentric spherules
(sph) and vesicles (ves). D) Photograph of thin-sections in plain light showing palagonite (pal) and glassy
shards with, cuspate (cus), platy (pla) and pumice (pum) shapes, and relics of bubble walls (bw). E)
Macroscopic image of microcrystalline blocky equant fragment with some micro-vesicles. F) Macroscopic
photograph of loose and poorly indurated spalls of shards with common vesicles. ... 122
Figure 48: A and B) Thin-sections in plain light showing fragments of very-fine grained rocks with a pervasive
alteration to palagonite (pal), shards with cuspate (cus) and platy (pla) shapes, and fragments of broken
crystals (bc). Macroscopic images of limestone (C) and sandstone lithics (D), which may correspond to rocks
of Amuri and Omihi limestones, and Charteris Bay sandstone. ... 123
Figure 49: Thin-sections in plain (A and B) and cross-polarized (C) light showing spherules with and without an
inner core enveloped in a palagonite (pal) film. Macroscopic (D) and SEM (E) examples of poorly indurated
highly porous glassy aggregate are also displayed. ... 124
Figure 50: Macroscopic (A) and plain light microscopic (B) examples of well indurated aggregate of cored spherules
(sph), associated with vesicles (ves) and intense palagonite alteration. Plain light (B), cross-polarized and SEM
(E and F) images of spherule with a glassy devitrified (palagonite) inner core, enveloped in a single concentric
outer rim associated with an array of acicular crystals in radial pattern and pseudo-perlitic (per) cracks. ... 125
Figure 51: Interpreted 2D dip seismic section at the Resolution-1 well (thick dashed line). Saucer-shaped sills (a)
were intruded into Cretaceous sedimentary strata during the middle Miocene (ca 12.5 Ma K-Ar) and caused
doming of the overlying strata. The doming consequentially changed the sea-floor topography and promoted
deposition as channelized systems (c) next to the dome structures. The syn-eruptive interval (between PrErS
and PoErS) is defined by the occurrence of volcanic material (b) interbedded with sedimentary rocks of the
Tokama Siltstone of Waiauan age (ca 12.7 to 11 Ma) and seismic stratigraphic analysis. At the border of the
domed strata, disrupted reflectors and faults suggest magma and hydrothermal fluid pathways that fed
eruptions onto the middle Miocene paleo-seafloor. All seismic anomalies interpreted to correspond to
buried volcanoes of the MVF occur between PrErS and PoErS surfaces, which merge to form a single reflector
in all directions away from the MVF. Seismic anomalies interpreted to correspond to intrusions are located
below PrErS. The available evidence together with geochemical and petrographic analysis demonstrate that
the intrusive and extrusive rocks penetrated by the Resolution-1 well have a co-genetic relationship, which
together with estimations of sedimentation rate in the area allow us to propose that the MVF was formed
from ca 12.7 to 11.5 Ma. Cretaceous to Paleogene horizons courtesy of Andrea Barrier. ... 127
Figure 52: Igneous seismic facies in the study area. A) Regional 2D strike/oblique seismic section showing the lower
(PrErS) and upper (PoErS) stratigraphic limits of the MVF (see chapter 4.5.5 for details). B and C show images
interpreted as volcanoes erupted in the MVF, while figures D, E and F show images of interpreted intrusions.
... 131
Figure 53: Pie diagrams showing the qualitative-quantitative morphometric results from MVF volcanoes. See text
for details. ... 133
Figure 55: Chronostratigraphic maps of the northern Canterbury Basin. The MVF erupted entirely in a lower
bathyal setting (D and C), and was buried in a lower to uppermost bathyal setting (B) due to rapid SE
progradation in the northern Canterbury Basin. During the Neogene, the physiography of the basin evolved
from a ramp to a basin-slope morphology (C to A). Outcropping paleo-environments compiled from Field et
al. (1989). During mapping of the PrErS chronostratigraphic horizon, we corrected the effects of local
deformation underneath eruptive vents and near shallow intrusions. ... 135
Figure 56: Composite paleo-physiographic and paleo-environmental map of the study area from ca 12.7 to 11 Ma.
Abbreviations are plotted at the position of MVF volcanoes and correspond to their morphology. Pc’s are
positive cones, pt’s are positive trapezium, pm’s are positive mounds, nf’s are negative funnel-like structures
and nb’s are negative basin-like seismic anomalies. Red dashed lines show the approximate bathymetry at
the onset of eruptions in the MVF. Blue dashed line shows the position of the shelf-break at 11 Ma. Note
that all pm’s and pt’s are located within relatively shallow waters, proximal the 11 Ma shelf-break (except
pm03 which was eroded by canyons). To construct this map, we combine information from the pre-, syn-,
and post-eruptive stages of MVF in a single map. First, we produce an isochron map of the syn-eruptive stage
of MVF (background rainbow colours), which is approximately equivalent to the interval (in TWT) between
PrErS (12.7 Ma) and PoErS (11.5 Ma). This isochron map was produced by applying a mathematical algorithm
embedded in the Kingdom Software, which subtracts the time of the PoErS from time of the PrErS (Figure
39). The isochron background map shows the location of each volcano in the MVF. We opt for the
non-reconstructed forms of the volcanoes (PoErS using HaBs volcanic heights) for two reasons: first,
computational limitation to map a theoretical reconstructed morphology in the software, which could create
several interpolation errors and artefacts. Second, because the degraded morphology of the volcanoes is
related to the position of the 11 Ma proto shelf-break, we decided to show the effects of erosion in the
composite map. To estimate the 12.7 Ma (onset of volcanism) bathymetric contours of the study area, we
first integrate biostratigraphic data at the location of the Resolution-1 well, with the local
chronostratigraphic map of 12.5 Ma (Figure 55D). The distal contour in MVF is highlighted by the red dashed
line on the right hand corner of the map, which corresponds to water depths ranging from 1000 to 1500 m.
The proximal bathymetric contour (red dashed lines showing bathymetry ranging from 500 to 750 m deep)
was estimated by calculating the slope angle (ca 1.5 degree) of the pre-eruptive regional ramp from seismic
data, and in relation to the distance from neritic rocks of similar age outcropping in the Canterbury plains
(Figure 55D), which was compiled from paleogeographic maps presented in Field et al. (1989). The position
of the 11 Ma shelf-break (blue dashed line), was mapped from 2D seismic lines in the study area, and
adjusted using the contours of the chronostratigraphic map of 11 Ma as required (Figure 55B). Note that
volcanoes distal the 11 Ma proto-shelf break show a sharp increase in slope towards their summit, while
volcanoes located proximal to this line show shallower slopes. Compare the contours that represent the
morphology of pt03 vs. pc 17 in the right-hand corner of the map. ... 136
Figure 57: Isochron maps of the northern Canterbury Basin. By 11 Ma and younger, most volcanoes were buried by
Figure 58: 2D regional seismic lines showing the location of the MVF in relation to the regional chronostratigraphic
horizons mapped in the study area from the Cretaceous to Recent, and the main physiography of the basin.
Neogene to Recent shelf-break migration is indicated by arrows that show the location of the shelf-break at
each time, with the arrowhead pointing in the direction of migration. Cretaceous-Paleogene horizons were
supplied by Andrea Barrier. ... 139
Figure 59: Morphometric analysis of MVF volcanoes relative to their post-eruptive paleo-environmental location.
Blue bars show the height of volcanoes after burial (as they were measured in seismic lines). Orange bars
show decompacted height values. Grey bars show reconstructed original height of the MVF volcanoes. Red
dashed line shows the limit between preservation and degradation of the edifices. Compare pm03 vs. pc04
for example. Red arrow points to a volcano with evidence of canyon erosion. ... 141
Figure 60: Top images show 2D seismic sections of crater (left) and cone (right) type dominated volcanoes. In the
seismic sections, crater-type is characterised by deep funnel and basin-like excavations into the PrErS
horizon, while cone-type is characterised by upwards deflection of the PoErS above the PrErS and reflectors
that pile-up above PrErS. Bottom images correspond to interpreted subaerial analogues. The crater-type is a
classic maar-diatreme volcano (McDougal Crater, in USA), while the cone-type is a well-known scoria cone
(SP Crater, USA). Despite morphometric differences, tuff cones and scoria cones share many morphologic
similarities, such as the presence of a crater zone with layers inward dipping, and peripheral flanks with
layers outward dipping. Note the geometric similarity between the volcanoes in seismic and analogue
images. Complete interpretation of the different types of volcanoes is presented in Chapter 5. ... 143
Figure 61: A and B show attribute analysis of pt02 and pc06 volcanoes and their seismic morphology. The
curvature (B) attribute suggests that the internal and external parts of the volcanoes (black) are composed
by rocks with similar acoustic properties, which are interpreted to represent volcaniclastic rocks eroded from
the pt02 and deposited next to its flanks. C shows the morphological contrast between pt03 and pc17. Note
that in both cases, extinct volcanic edifices located at shallow water (pt02 and pt03) show flattened tops in
relation to the position of the 11 Ma unconformity, while volcanoes located at deeper water (pc06 and pc17)
do not show a morphological relationship with this unconformity. This suggests that distal volcanoes were
below see-level and were well preserved. Blue dashed lines show the interpreted position of the sea-level at
ca 11 Ma, based on the flattened top of proximal volcanoes. ... 145
Figure 62: Morphometric analysis of crater-type MVF volcanoes in relation to the lM unconformity. Data have
been organised by the position of volcanoes relative to the 11 Ma shoreline (proximal and distal). They were
then organized by the estimated degree of degradation from the highest to smallest values, and finally by
oHm from smallest to highest values. The yellow fill represents volcanoes with a moderate to high degree of
degradation. At the left-hand side of the graph, all volcanoes are pc’s of < 200 m oHm and show little
degradation. All pt’s and pm’s are located on the shelf at 11 Ma and have oHm > 200 m. We interpret that at
ca 11 Ma, these volcanoes were volcanic islands and experienced wave erosion. All volcanoes located on the
slope do not show significant evidence of degradation, with the exception of pm03 which was eroded by
canyons. The H:W ratio was multiplied by 500 for visualisation proposes. Note that the estimated
degree of degradation produced volcanoes with smaller H:W ratios, due to their loss in height (H) and gain in
diameter (W). ... 146
Figure 63: Conceptual representation of the magmatic sequences and stages (left), predominant geological
processes, stratigraphic surfaces (centre), and boundaries of MVF and MFS (right). ... 161
Figure 64: Methods used for the identification and interpretation of volcanic and sedimentary architectural
elements in the MVS. The input 2D seismic reflection are described and compared with analogues. Elements
sampled by drillholes can provide an accurate geological characterisation of the anomaly, while
interpretation without physical confirmation remains only hypothetical. ... 164
Figure 65: Schematic representation of the stratigraphic sequences and surfaces, magmatic stages, architectural
elements, and predominant processes associated with MVS. Numbers in circles represent the location of the
architectural elements indicated in the key. Numbers in squares indicate the predominant processes in the
key. The symbols in the right hand corner illustrate the database used for interpretations. Conduit zones and
dikes have lateral thicknesses exaggerated for visualization proposes. In this framework, PoDgS and PoBuS
are related to the volcano in the centre of the figure, and to the 11 Ma unconformity described in chapter 4.
Lateral variation of the lithostratigraphic units are not shown in the image. The pre-eruptive dome is a
regional feature shown in Figure 68. ... 166
Figure 66: Photographs of potential analogue dikes outcropping in the Canterbury Basin. Intrusions have different
patterns and products according to their depth of emplacement. At deeper levels, dikes show sharp contacts
and little branching into enclosing sediments (D), while at shallower levels, they show magma finger
terminations and several thin apophysis with peperitic borders. Thirty meters above the shallower
intrusions, calcite veins (C) suggest migration of fluids up-sequence. ... 169
Figure 67: 2D seismic images (A and B) of disrupted blocks, and a possible outcrop scale analogue of this
architectural element in Banks Peninsula formed by host pyroclastic deposits cross-cut by multiple dike
intrusions. ... 170
Figure 68: Top early Miocene isochron map of the northern part of Canterbury Basin. Red contours correspond to
higher topography. The area inside the white dashed line shows semi-regional uplift with maximum vertical
relief of ca 100 meters, coincident with the location of large sill and dike and sill swarms of the MVS
plumbing system. This surface was chosen to demonstrate uplift of the sequence that predate the MVF,
because in contrast to the PrErS, the top early Miocene surface is less disrupted by shallow intrusions, and
reflectors can be tracked with more confidence at the sub-volcanic level. ... 171
Figure 69: 2D seismic reflection lines showing the locations and geometries of the five plumbing-types observed in
the MVS. Images A, B and C for the same line ANZ-001 which display the seismic attributes pseudo-relief (A),
amplitude (B) and envelope (C). Note the systematic vertical distribution from type-1 (deeper) to type-4
(shallower) and their relationship. Type-5 differs from the other types in that it represents a deep
source-to-surface feeder systems. ... 173
Figure 70: 2D seismic reflection images and characterisation of the five plumbing-types from the MVS. Seismic
Figure 71: Images on the left hand side show schematic cross-sections through a maar-diatreme and a tuff ring,
and their typical volcano-sedimentary processes, deposits and morphology (from Kereszturi and Németh,
2013). On the right-hand side are shown interpreted 2D seismic lines of the MVS crater-type volcanoes, and
their main large scale architecture. ... 177
Figure 72: Uninterpreted (above) and interpreted (below) 2D seismic line showing the main architectural elements
related to crater-type volcanoes in the MVS. Numbers in red circles are syn-intrusive architectural elements,
in green syn-eruptive, and in yellow post-magmatic architectural elements. We observe that crater-type
volcanoes present two distinctive morphologies related to at least two different eruptive-styles: lower part
(in red) shows funnel-like excavation into PrErS and lateral high amplitude parallel reflectors, which we
interpret to represent a submarine equivalent of a maar-diatreme volcano, and may be related to large
submarine phreatomagmatic eruptions. Upper part (in blue) shows cone-like morphology and lateral
semi-continuous reflectors in wedge-shape, which we interpreted as intra-crater volcanoes formed by late
eruptive events, and associated material that overspills from the rim of the underlying maar-diatreme
structure. WD is the interpreted approximate water-depth at the time of the formation of the volcanos. .. 181
Figure 73: Three-dimensional representation of the main syn-eruptive architectural elements of crater-type
volcanos of the MFV and their average size. Each of these large-scale elements can be composed by sets of
smaller-scale elements formed by the interplay of volcanism, external environments, and concomitant
sedimentation. ... 183
Figure 74: Images on the left-hand side show schematic cross-sections through tuff and scoria cones showing their
typical volcano-sedimentary processes, deposits and morphology (from Kereszturi and Németh, 2013).
Seismic images on the right-hand side show interpreted 2D lines of MVS crater-type volcanoes, and their
large-scale architecture. The seismic section in the lower right-hand corner shows a buried submarine
Eocene volcano 40 km offshore of Oamaru (Barrier et al., 2017), which we use as analogue for our
interpretations... 184
Figure 75: Uninterpreted (left) and interpreted (right) 2D seismic line showing the main architectural elements
related to crater-type in the MVS. Numbers in red circles are syn-intrusive architectural elements, in green
syn-eruptive, and in yellow post-magmatic architectural elements. We observe that crater-type volcanoes
are mainly composed of a basal cone, a central crater, a tephra flank and a cone apron. These volcano-types
produce upward convex morphologies between the PrErS and PoErS horizons, which we have interpreted to
represent the submarine equivalents of tuff cones. Note that the central-crater show inward dipping
reflectors while the tephra flank shows outward-dipping reflectors and minor excavation into the PrErS
horizon. ... 186
Figure 76: Photographs of potential analogue for MVS syn-eruptive architectural elements outcropping in Kakanui
South Head submarine volcanic edifice, near Oamaru, South Island of New Zealand. A) Map showing the
location of the vent and flanks of the cone. B) Massive, chaotic, to amalgamated intra-crater lapilli-tuff to
tuff-breccia interpreted to be deposited by tephra jets, ballistic and debris flow of material remobilized into
the central crater (Corcoran and Moore, 2009; Moorhouse; 2015). C) Angular contact between amalgamated
jetting and eruption-fed density currents deposited at the flanks of the volcanic edifice (Corcoran and
Moore, 2009; Kaulfuss et al., 2012). ... 189
Figure 77: Three-dimensional representation of the main syn-eruptive architectural elements of crater-type
volcanoes of the MFV and their average size. Each of these large scale elements can contain sets of
smaller-scale architectural elements formed by the interplay of volcanism and concomitant sedimentation. ... 191
Figure 78: Uninterpreted (above) and interpreted (below) 2D seismic line showing the main architectural elements
related to cone-type volcanoes in the MVS volcanos. Numbers in red dots are syn-intrusive architectural
elements, in green syn-eruptive, and in yellow post-magmatic architectural elements. Based on seismic
stratigraphic interpretation, the lower sequence of volcaniclastics recovered in Resolution-1 was probably
sourced from volcanoes NW or W of the well (likely nf02 and nf03). Tuffs from -1103 to -1110 m depth were
likely vented from pc-14. WD is the interpreted approximate water depth at the time of the formation of
these volcanos. ... 194
Figure 79: Seismic attribute analysis of pt02 and pc06 volcanoes. Note that the attributes show similarity between
the internal and external parts of pt02, which we interpreted as a plume of sediments deposited after
erosion of extinct volcanic islands during the degradational stage. ... 196
Figure 80: Schematic representation of the possible petroleum plays associated with buried monogenetic volcanic
systems, based on the observation of the MVS architectural elements. Distinctive sets of architectural
elements can create prospective plays according to the magmatic stages of emplacement, construction,
degradation, and burial of the volcanoes (following volcano-stratigraphic models proposed in Bischoff et al.
(2017) and chapter 5 of this thesis). Sandstones below the PrErS (yellow) and limestones above the PoErS
(blue) were added to this model to illustrate possible plays formed by the interaction of these lithologies
with volcanism. ... 206
Figure 81: Schematic representation of the possible intrusion-related hydrothermal systems associated with buried
monogenetic volcanic systems, based on the observation of MVS architectural elements. Distinctive sets of
architectural elements can create prospective plays according to the magmatic stages of emplacement,
construction, degradation and burial of the volcanoes. Sandstones below the PrErS (yellow) were added to
this model to illustrate possible plays formed by the interaction of this lithology with volcanism. ... 212
Figure 82: Graphs showing the population of HaBm (Height after burial in meters) for MVF volcanoes using the
Relative Impedance Index method (RII) to estimate the acoustic velocities of buried volcanoes. A) Black lines
show expected bounds in HaBm calculated from maximum and minimum velocities of tuffaceous rocks
compiled from laboratory and drill-hole measurements elsewhere. Blue lines define the bounds in HaBm
using estimations of velocities from the RII method. Note that blue lines (RII approach) show a property of
convergence between maximum and minimum ranges with increasing calculated height, while black lines
show divergence. ... 223
Figure 83: Reconstructed morphology of volcanoes imaged by 2D seismic lines in Maah ... 225
Figure 84: Reconstructed morphology of volcanoes imaged by 2D seismic lines in Maahunui Volcanic Field and Kora
List of Tables
Table 1: Areas studied during this PhD research project. ... 27
Table 2: Structure of this PhD thesis. ... 28
Table 3: Attributes and parameters used on the seismic morphological Characterisation and reconstruction of MVF
volcanoes. ... 100
Table 4: Equations used to calculate seismic morphometric parameters of the MVF volcanoes. ... 107
Table 5: Main stratigraphic and paleo-environmental characteristics of the Tokama Siltstone depositional units.
Highlighted middle Tokama unit (red) is interbedded with the volcaniclastic rocks described in the section
4.5.1.5. ... 117
Table 6: Main stratigraphic and paleo-environmental characteristics of the MVF area. Interval highlighted in red
corresponds to the active eruptive time in the volcanic field. ... 140
Table 7: Main characteristics of the stratigraphic surfaces that bound distinctive magmatic sequences and stages in
the MVS. ... 163
Table 8: Main characteristics of the syn-intrusive architectural elements in the MVS. ... 167
Table 9: Main characteristics of the architectural elements of the crater-type dominate volcanoes formed during
the constructional magmatic stage in the MVS. ... 178
Table 10: Main characteristics of the architectural elements of the cone-type dominate volcanoes formed during
Chapter 1
1
Introduction
1.1
Research Rationale
In a world with increasing demand for energy, this PhD research aims to provide insights for both petroleum and geothermal industries. This study characterises the architecture of volcanic systems buried in sedimentary basins, by identifying the geological situations that favour the occurrence of valuable geoenergy resources, such as hydrocarbons and geothermal energy. A vast range of petroleum plays can form in association with buried volcanic systems, with some examples of world-class hydrocarbon fields estimated to contain > 1Gbbl currently in production (e.g. Mohriak, 2008; Carlotto et al., 2017). Important energy resources can also occur in active volcanic systems emplaced in sedimentary basins, because, for example, the interaction of magma with the host sedimentary strata can form prolific intrusion-related hydrothermal systems (e.g. Stimac et al., 2015; Montanari et al., 2017). However, in certain conditions, volcanism can be detrimental for geoenergy exploitation by degrading the quality of reservoirs (e.g. Schutter, 2003), or producing large amounts of greenhouse gases such as CO2, CH4 and H2S
(e.g. Svensen et al., 2017). Today, it is widely accepted that the interaction between magmatism and sedimentation can have both positive and negative impacts on geoenergy resources (e.g. Wight and Hardian, 1982; Planke et al., 1999; Schutter, 2003; Rohrman, 2007; Holford et al., 2012; Rateau et al., 2013; Bischoff et al., 2017). Despite the increase in knowledge of these volcanic systems (and their associated geoenergy prospects) in the last few decades, the conditions that determine their success or failure as economic resources remains poorly understood.
1.2
Research Hypothesis
Petroleum and geothermal systems share many similarities. Both systems rely on the presence of certain fundamental elements and processes to form prospects suitable for exploration and production of geoenergy. Since the 1990’s, the concept of a petroleum system from Magoon and Dow (1994) make an important impact on the way that the industry explores and exploits oil and gas. The petroleum system is a unifying concept that evaluates the presence of fundamental elements (source, reservoir, seal, and trap) and essential processes (generation, migration, and accumulation) that are necessary for an oil and gas field to exist. Similarly, key elements and conditions are also necessary for the formation of hydrothermal systems including: a source of heat (typically magma or hot igneous rocks), a reservoir body (which can be fractured or porous), water (vapour or liquid), and a permeable network to transfer fluids and heat through the system (e.g. Goff and Janik, 1999; Stimac et al., 2015).
In sedimentary geology, the concept of architectural elements was introduced to describe the fundamental building blocks of sedimentary systems (Allen, 1983; Miall, 1985). After the development of this concept, architectural element analysis has been widely applied to further the understanding of the fundamental processes that control the formation of petroleum systems in sedimentary settings. I hypothesise that volcanic systems, such as sensu stricto sedimentary systems, are comprised of sets of igneous and sedimentary architectural elements with petrophysical characteristics that can provide storage, and can conduct, or can entrap fluids, such as water, oil, and gas.
This PhD thesis proposes that “volcanic” architectural elements occur in a predictable stratigraphic order, and that they are controlled by the interplay of igneous and sedimentary processes, such as magmatic intrusions, eruptions, degradation, and burial of the volcanic structures within the sedimentary strata. Here, I propose that the analysis of architectural elements can be applied to reduce exploratory risks, and increase the likelihood of finding geoenergy resources associated with buried and active volcanic systems.
1.3
Research Objectives
within the buried volcanic systems. The volcano-stratigraphic frameworks aim to illustrate possible combinations of architectural elements that can favour the formation of petroleum accumulations and geothermal fields, in association with monogenetic and polygenetic volcanism in sedimentary basins. In addition, this work aims to encourage an effective transfer of knowledge between the well-established oil and gas industry and the geothermal sector. The work programme includes development of techniques that can be applied to evaluate the risks and uncertainties of subsurface exploration and production of geoenergy in volcanic areas. However, a large number of variables control the fluid-flow properties of volcanic systems and the formation of petroleum occurrences, such as the diverse morphology of these systems (e.g. Silva and Lindsay, 2015), complex facies architecture (e.g. Pittari et al., 2008; Jerram et al., 2009) and rapid changes in petrophysical properties of volcanic rocks (e.g. Heap and Kennedy, 2016). Therefore, the application of concepts introduced in this thesis will likely need to be considered on a case-by-case basis. In this thesis, I briefly evaluate how the interaction of magmatism and sedimentation controls the architecture of buried volcanic systems and their potential to contain geoenergy resources. Further research will be required to understand these systems in suffice detail to document their full diversity.
1.4
Studied Areas
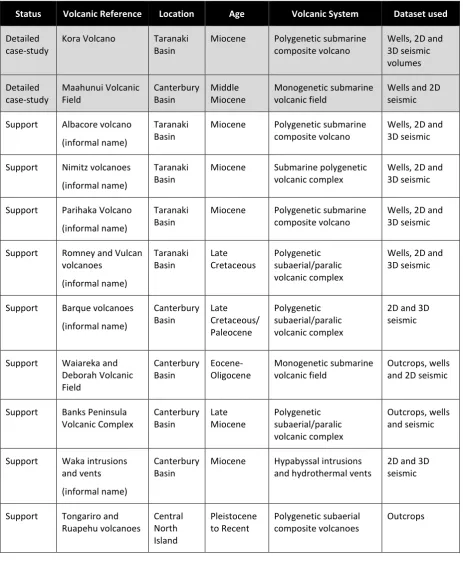
Table 1: Areas studied during this PhD research project.
Status Volcanic Reference Location Age Volcanic System Dataset used
Detailed case-study
Kora Volcano Taranaki Basin
Miocene Polygenetic submarine composite volcano
Wells, 2D and 3D seismic volumes Detailed case-study Maahunui Volcanic Field Canterbury Basin Middle Miocene Monogenetic submarine volcanic field
Wells and 2D seismic
Support Albacore volcano
(informal name)
Taranaki Basin
Miocene Polygenetic submarine composite volcano
Wells, 2D and 3D seismic
Support Nimitz volcanoes
(informal name)
Taranaki Basin
Miocene Submarine polygenetic volcanic complex
Wells, 2D and 3D seismic
Support Parihaka Volcano
(informal name)
Taranaki Basin
Miocene Polygenetic submarine composite volcano
Wells, 2D and 3D seismic
Support Romney and Vulcan volcanoes (informal name) Taranaki Basin Late Cretaceous Polygenetic subaerial/paralic volcanic complex
Wells, 2D and 3D seismic
Support Barque volcanoes
(informal name) Canterbury Basin Late Cretaceous/ Paleocene Polygenetic subaerial/paralic volcanic complex
2D and 3D seismic
Support Waiareka and Deborah Volcanic Field Canterbury Basin Eocene-Oligocene Monogenetic submarine volcanic field Outcrops, wells and 2D seismic
Support Banks Peninsula Volcanic Complex Canterbury Basin Late Miocene Polygenetic subaerial/paralic volcanic complex Outcrops, wells and seismic
Support Waka intrusions and vents
(informal name)
Canterbury Basin
Miocene Hypabyssal intrusions and hydrothermal vents
2D and 3D seismic
Support Tongariro and Ruapehu volcanoes Central North Island Pleistocene to Recent Polygenetic subaerial composite volcanoes Outcrops
1.5
Thesis Structure
read and understood independently, but follow a logical sequence of related themes. These chapters are preceded by an introduction to the overall topic and a brief literature review to explain the main concepts and techniques applied in this study. Preparing the chapters as a series of papers results in some duplication within the thesis, especially at the beginning of each chapter. I have reduced this repetition by incorporating the geological settings for the Kora and Maahunui volcanic systems in chapters 3 and 4, respectively. The research described in this thesis has been conducted by me (Alan Bischoff), however, many others have contributed to refining the ideas and their presentation. The chapters are all written in the first person plural (“we”), as is common practice for multi-authored publications. In particular, Andy Nicol and Mac Beggs contributed insights into the geological context and petroleum potential of Kora volcano (Chapter 3), and Ben Kennedy, Andrea Barrier, Darren Gravely, Marcos Rossetti and Hanfei Wang to the Maahunui studies presented in Chapters 4, 5. And 6. I am first author in the Kora publication (Bischoff et al., 2017) and anticipate also being first-author on all remaining two publications.
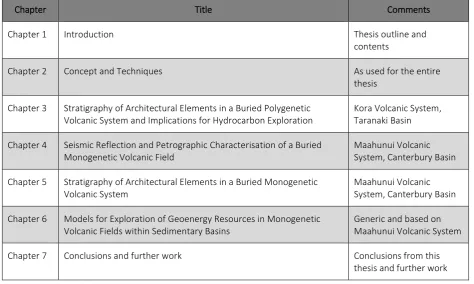
Table 2: Structure of this PhD thesis.
Chapter Title Comments
Chapter 1 Introduction Thesis outline and
contents
Chapter 2 Concept and Techniques As used for the entire
thesis
Chapter 3 Stratigraphy of Architectural Elements in a Buried Polygenetic Volcanic System and Implications for Hydrocarbon Exploration
Kora Volcanic System, Taranaki Basin
Chapter 4 Seismic Reflection and Petrographic Characterisation of a Buried Monogenetic Volcanic Field
Maahunui Volcanic System, Canterbury Basin
Chapter 5 Stratigraphy of Architectural Elements in a Buried Monogenetic Volcanic System
Maahunui Volcanic System, Canterbury Basin
Chapter 6 Models for Exploration of Geoenergy Resources in Monogenetic Volcanic Fields within Sedimentary Basins
Generic and based on Maahunui Volcanic System
Chapter 7 Conclusions and further work Conclusions from this
Chapters 1 and 2 setup the thesis and provide the technical background necessary to analyse and interpret the main body of the research presented in chapters 3, 4, 5 and 6. As a product of this PhD research, we expect three publications in high impact scientific journals:
Publication 1 (Chapter 3): Stratigraphy of Architectural Elements in a Buried Volcanic System and
Implications for Hydrocarbon Exploration
In this first paper we reveal the architecture of Kora Volcanic System (KVS), drawing insights for hydrocarbon exploration. The purpose of this paper is to show the complete architecture of a buried composite submarine volcanic system. Kora is a Miocene volcano active for ca 10 Ma and currently buried by more than 1000 m of sedimentary strata offshore Taranaki Basin, New Zealand. A sub-commercial hydrocarbon field was discovered within volcanogenic deposits on Kora Volcano in the 1980’s. This manuscript was submitted to AAPG Interpretation Journal on the 3rd of November, 2016, was accepted on the 24th of March, 2017, and published in the special
edition Subsurface Expression of Igneous Systems and Their Impacts on Petroleum Systems on the 19th of June, 2017. The full publication is available online on
https://doi.org/10.1190/INT-2016-0201.1.
Publication 2 (Chapter 4): Seismic Reflection and Petrographic Characterisation of a Buried
Monogenetic Volcanic Field
The second manuscript will present the analysis and conclusions from Maahunui Volcanic Field (MVF), a previously uncharacterised middle Miocene monogenetic volcanic field, currently buried by ca 1000 m of sedimentary strata in the offshore Canterbury Basin. In this manuscript, we will present morphological reconstruction of 31 submarine equivalents of maar-diatreme and tuff cone volcanoes using 2D seismic reflection data. In this paper we will show the lithological evidence that supports an igneous origin for the features recognized in seismic, and the interpretations about their eruptive-styles that had occurred in a bathyal setting, with water depths of ca 1000 m.
Publication 3 (Chapter 5 and 6): Stratigraphy of Architectural Elements in a Buried Monogenetic
Volcanic System and Implication on Geoenergy Exploration
emplacement, submarine eruptions, and burial of a monogenetic volcanic field in a sedimentary basin. The two Maahunui papers are expected to be submitted and published in 2019.
1.6
References
Allen, J. R. L., 1983, Studies in Fluviatile Sedimentation: Bars, Bar-Complexes and Sandstone Sheets (Low-Sinuosity Braided Streams) in the Brownstones (L. Devonian), Welsh Borders: Sedimentary Geology, 33 (4): 237–93. doi:10.1016/0037-0738(83)90076-3.
Bischoff, A. P., A. Nicol, M. Beggs., 2017, Stratigraphy of architectural elements in a buried volcanic system and implications for hydrocarbon exploration: Interpretation, doi:10.1190/INT-2016-0201.1.
Carlotto, M. A., R. C. B. Silva., A. A. Yamato., W. L. Trindade., J. L. P. Moreira., R. A. R. Fernandes, O. J. S. Ribeiro., et al. 2017. Libra: A Newborn Giant in the Brazilian Presalt Province. In Gialnt Fields of the Decade 2000-2010. doi:10.1306/13572006M1133685.
Goff, F., Janik, C.J., 2000, Geothermal Systems, Encyclopedia of Volcanoes, Academic Press, Chapter-49, pp. 817 – 834.
Holford, S. P., N. Schofield, J. D. MacDonald, I. R. Duddy, P. F. Green., 2012, Seismic Analysis of Igneous Systems in Sedimentary Basins and Their Impacts on Hydrocarbon Prospectivity: Examples from the Southern Australian Margin. APPEA Journal, 52, 229–52.
Jerram, D. A., R. T. Single., R. W. Hobbs., C. E. Nelson., 2009, Understanding the offshore flood basalt sequence using onshore volcanic facies analogues: An example from the Faroe-Shetland basin: Geological Magazine, doi:10.1017/S0016756809005974.
Kereszturi, G., K. Németh., 2013, Monogenetic Basaltic Volcanoes: Genetic Classification, Growth, Geomorphology and Degradation: Updates in Volcanology - New Advances in Understanding Volcanic Systems, doi:http://dx.doi.org/10.5772/51387.
Magoon, L. B., and W. G. Dow, 1994, The Petroleum System: AAPG Memoir, doi:10.1126/science.51.1323.468.
Miall, A. D., 1985, Architectural-Element Analysis: A New Method of Facies Analysis Applied to Fluvial Deposits. Earth-Science Reviews Elsevier Science Publishers B.V 22: 261–308. doi:10.1016/0012-8252(85)90001-7.
Montanari, D., M. Bonini,, G. Corti,, A. Agostini,, C. Ventisette., 2017, Forced folding above shallow magma intrusions: Insights on supercritical fluid flow from analogue modelling: doi:10.1016/j.jvolgeores.2017.07.022.
Mohriak, W.U., M. Nemcok., G. Enciso., 2008. South Atlantic divergent margin evolution: rift-border uplift and salt tectonics in the basins of SE Brazil. In: Pankhurst, R.J., Trouw, R.A.J., Brito Neves, B.B. & de Wit, M.J. (eds.), West Gondwana pre-Cenozoic correlations across the South Atlantic region. Geological Society of London, Special Publication 294, p.365-398.
Pittari, A., Cas, R. A. F., Lefebvre, N., Robey, J., Kurszlaukis, S., Webb, K., 2008. Eruption processes and facies architecture of the Orion Central kimberlite volcanic complex, Fort à la Corne, Saskatchewan; kimberlite mass flow deposits in a sedimentary basin. Journal of Volcanology and Geothermal Research, 174(1), 152–170. https://doi.org/https://doi.org/10.1016/j.jvolgeores.2007.12.019
Rateau, R., N. Schofield, M. Smith., 2013, The Potential Role of Igneous Intrusions on Hydrocarbon Migration, West of Shetland. Petroleum Geoscience 19 (3): 259–72. doi:10.1144/petgeo2012-035.
Rohrman, M., 2007, Prospectivity of Volcanic Basins: Trap Delineation and Acreage de-Risking. AAPG Bulletin 91 (6): 915–39. doi:10.1306/12150606017.
Schutter, S. R., 2003, Hydrocarbon Occurrence and Exploration in and around Igneous Rocks. Geological Society, London, Special Publications 214 (1): 7–33. doi:10.1144/GSL.SP.2003.214.01.02.
Silva, S. D., J. M. Lindsay., 2015, Primary Volcanic Landforms. The Encyclopedia of Volcanoes. doi:10.1016/B978-0-12-385938-9.00015-8.
Stimac, J., F. Goff, and C. J. Goff., 2015, Intrusion-Related Geothermal Systems, in The Encyclopedia of Volcanoes: doi:10.1016/B978-0-12-385938-9.00046-8.
Svensen, H. H., T. H. Torsvik., S. Callegaro., L. Augland., T. H. Heimdal., D. A. Jerram., S. Planke., and E. Pereira., 2017, Gondwana Large Igneous Provinces: plate reconstructions, volcanic basins and sill volumes: Geological Society, London, Special Publications, doi:10.1144/SP463.7.
Chapter 2
2
Concepts and Techniques
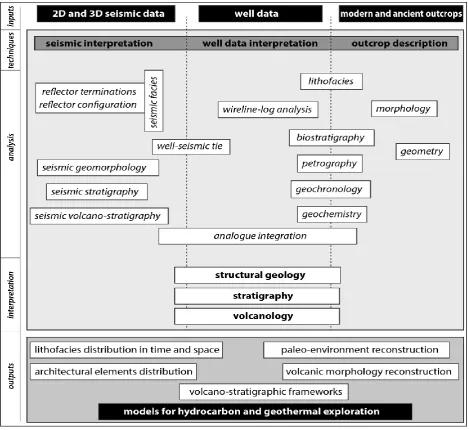
This chapter aims to briefly introduce the main techniques and fundamental concepts applied in this thesis to characterise the architecture of buried volcanic systems using seismic reflection and borehole data (Figure 1). The structure of the thesis is designed to provide background information to support our interpretations in each independent chapter, in which we present more detailed discussions of the concepts and techniques applied in this study.
Figure 1: Diagram showing the workflow adopted in this PhD research. Seismic reflection and well data were integrated with observations from outcropping analogue systems.
[image:33.595.71.541.208.638.2]stratigraphy and volcanology into a unified model to explain the geology of the studied areas. The integration of these disciplines enables us to understand the spatio-temporal distribution of facies and geobodies within the buried volcanoes, and to reconstruct the paleo-environmental scenarios in which volcanic events occurred during the evolution of the host sedimentary basins. This background information is the basis for construction of volcano-stratigraphic frameworks that represent the architecture of volcanic systems buried in sedimentary basins. These frameworks can be used to propose models for the exploration and development of geoenergy resources such as hydrocarbons and geothermal power (Figure 1).
2.1
Fundamental Concepts of Seismic Reflection Interpretation
resolution depends on the parameters of acquisition such as frequency of the seismic waves and the time interval over which the data is record. Vertical resolution is strongly influenced by the characteristics of the seismic reflectors such as thickness, heterogeneity within the geological layers and presence of interstitial fluids. The raw seismic data are then processed to reduce seismic noise and errors encountered during the acquisition process (e.g. Sheriff and Geldart, 1995; Catuneanu, 2006; Abdelmalak et al., 2016; Marfurt, 2018). Finally, the information is displayed on 2D profiles showing the two-way travel time of the waves versus the horizontal distance of receptors (Figure 2; Figure 3; Figure 4) or on 3D seismic volumes (Figure 5).
[image:35.595.73.538.242.465.2]Figure 2: Fundamental concepts of seismic reflection acquisition and interpretation. Modified from Sheriff and Geldart (1995) and Wright (2013). Seismic line in A is from Canterbury Basin, New Zealand. Seismic image from Bischoff (unpublished data, 2015).