FOR CONFINED CONCRETE : RECTANGULAR SECTIONS
A report submitted in partial fulfilment of the requirements for the degree of Master of Engineering at the University of Canterbury, Christchurch~ New Zealand.
by
BRYAN D. SCOTT
\
. ~'\
J
,.
.,. I
• I ' lI •' {
' I
ABSTRACT
An experimental investigation into the behaviour of square, confined, reinforced concrete columns was undertaken. Thirty 450 mm square, 1200 mm high units were cast with varying amounts of longitudinal and lateral steel. These were subjected to concentric or eccentric axial loads to failure at slow or dynamic loading rates.
Confinement requirements of reinforced concrete columns are discussed and the results and analyses of experimental work presented.
Results include an assessment of the significance of loading rate, eccentricity, amount and distribution of longitudinal steel, and the amount of confining steel.
ACKNOWLEDGEt~ENTS
The research for this report was carried out in the Department of Civil Engineering, University of Canterbury, under the overall guidance of its Head, Professor R. Park.
i i
The project was supervised by Professor R. Park and Dr. M.J.N. Priestley, both of whom have given invaluable advice, and careful guidance. My
thanks also to Professor S.M. Uzumeri (Toronto, Canada) for his introduct-ion to this topic.
I wish to thank Mr. N.W. Prebble, Technical Officer, and all the technical staff of the Civil Engineering Department who have been associated with this project. Special thanks are due to Mr. A. Bell, Mr. G. Hill, and Mr. G. Clark for their contribution towards constructing, preparing and testing the specimens.
The financial assistance of the National Roads Board is gratefully acknovJl edged.
Thanks are also due to Mrs. V. Grey for her tracing and to Mrs. C. Gaerty for typing this text.
The special care and attention given by Ashby Bros. Ltd. to obtaining uniform concrete properties is gratefully acknowledged.
TABLE OF CONTENTS
ABSTRACT
ACKNOWLEDGEMENTS TABLE OF CONTENTS LIST OF FIGURES LIST OF TABLES NOTATION
CHAPTER ONE~ : . INTRODUCTION 1.1
1.2 1.3 1.4 1.5
General Aim Scope Format
Previous Research 1.5.1 Chan (1955)
1.5.2 Roy and Sozen (1964)
1. 5. 3 Bertero and Fe l i ppa (1964) 1.5.4 Soliman and Yu (1967) 1.5.5 Kent and Park (1971) 1.5.6 Sargin (1971)
1.5.7 Vallenas, Bertero and Popov (1977) 1.5.8 Sheikh and Uzumeri (1978)
1.5.9 Modified Kent and Park (1979)
1. 5. 10 Summary
CHAPTER TWO : CONFINEMENT REQUIREMENTS FOR PLASTIC HINGE ZONES IN REINFORCED CONCRETE COLUMNS
Page:
i
Hi
Vi'
ix
X
1
2
2
2
2
4
4
7
7
9
11
12 15 17 18
2.0 Summary 20
2.1 The Codes Considered 20
2.1.1 ACI 318-77 21
2.1.2 SEAOC (1975) 21
2.1.3 ATC (1978) 22
2.1.4 ACI Committee 343 22
2.1.5 Japanese Practice 22
2.1.6 Ministry of Works and Development, Civil Division 22
2.1.7 Draft SANZ Concrete Design Code 23
2.2 Comparison of Code Requirements for A Typical Rectangular
2.3 Conclusions
CHAPTER THREE : DESIGN AND CONSTRUCTION OF TEST UNITS 3.0 Summary
3.1 Unit Size Criteria 3.2 Design of Test Units
3.2.1 Longitudinal Steel 3.2.2 Hoop Steel
3.3 Material Properties 3.3.1 Steel
3.3.2 Concrete 3.4 Construction
CHAPTER FOUR · · INSTRUMENTATION AND TESTING PROCEDURE 4.0 Summary
4.1 Instrumentation
4.1.1 Load Measurement
4.1.2 Longitudinal Concrete Strains 4.1.3 Hoop Reinforcement
4.2 Testing Procedure
4.2.1 Test Unit Preparation 4.2.2 Testing Procedure
CHAPTER FIVE : TEST RESULTS 5.0 Summary
5.1 General Behaviour and Visual Observations 5.2 Presentation of Results
5.3 Discussion of Results 5.3.1 Rate of Loading 5.3.2 Confinement Ratio
5.3.3 Distribution of Longitudinal Steel 5.3.4 Ultimate Compression Strain
5.3.5 Strength of Longitudinal Steel 5.3.6 Eccentricity of Loading
27
28 28 28 28 29 32 32 32 40
42 42 42 42 43 44 44 45
47 47 56
87 87
92 97
9Z
100 100
CHAPTER SIX : CONCLUSIONS AND FUTURE RESEARCH
6.0 Summary 6.1 Conclusions
6.2 Recommendations for Future Research
APPENDIX A : REFERENCES
101
101
102
Figure 1.1 1.2 1.3 1.4 1.5 1.6 1.7 1.8 2.1 3.1 3.2 3.3 3.4 3.5 3.6 3.7 3.8 4.1 4.2 5.1 5.2 5.3 vi
LIST OF FIGURES
Title Page:
Effect of Tie Spacing on Stress~Strain Relationship
of Concrete (Roy and Sozen (1963)(10} 5
Stress-Strain Curve for Concrete Confined by (
Rectangular Ties as Proposed by Roy and Sozen (1964) l 1) 6 Stress-Strain Relationship of Confined Concrete in
Flexure (Soliman and Yu 19671 (151 8
Stress-Strain Curve for Concrete Confined by
Rectangular Hoops (Kent and Park 1971] (18) 10 Comparison of Analytical Curves with Experimental
Results (Vallenas et al, 19771 (24} 13
Confined Concrete with Longitudinal Reinforcement -Analytical Curve and its Comparison with Experimental
Results (Vallenas et al, 19771 (24} 13
Stress-Strain Curve for Confined Concrete in Square
Columns (Sheikh and UzU!l)eri 19781 (2) 16 Stress-Strain Curve for Concrete Confined by
Rectangular Hoops (Park, Priestley and Gill? 1979}(29} 17 Comparison of Code Hoop Steel Requirements for a
Square Column (Park and Priestley 1979} (30) 26 Detai 1 s of Test Units and Transverse Reinforcement 31 Stress.,..Strain Curve for DH24 Steel (Grade 380)
Stress.-Strain Curve for DH20 Steel (Grade 380) Stress.-Stra in Curve for 020 Steel (Grade 275) Stress-Stra i. n Curve for R10 Hoop Steel (Grade 275} Stress-Strain Curve for Rl2 Hoop Steel (Grade Strength-Age Diagram of 200 x 100 mm Diameter Photographs of the Construction Sequence Strain Gauge Locations
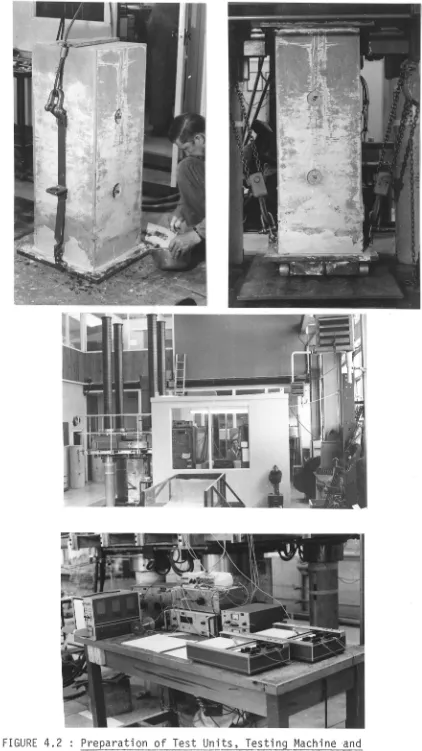
Preparation of Test Units, Testing Machine and Recording Instruments
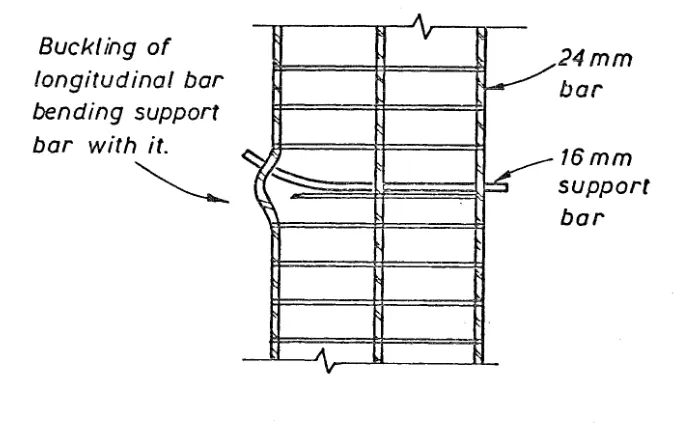
Bending of the Support Bars
Unit 12 Photographs Showing Test Sequence Unit 15 Photographs Showing Test Sequence
5.4 Photographs Showing Selected Features of Failure 53 for Various Test Units
5.5 Photographs Showing Selected Features of Failure 54 for Various Test Units
5.5(e) Mid-Height lateral Displacement Versus Average 55 Longitudinal Strain
5.6 Unit 1 Axial Load, Slow Speed 58
5.7 Unit 2 Axial Load, Slow Speed 59
5.8 Unit 3 Axial Load, High Speed 60
5.9 Unit 4 Eccentric Load, Slow Speed 61
5.10 Unit 4 Eccentti c Load~ Sl O'V'I Speed 62
5.11 Unit 5 Eccentric Load, High Speed 63
5.12 Unit 5 Eccentric Load, High Speed 64
5.13 Unit 6 Axial Load, Slow· Speed 65
5.14 Uni. t 7 Axial Load, High Speed 66
5.15 Unit 8 Eccentric Load? Slow· Speed 67
5.16 Unit 8 Eccentric Load~ Slow· Speed 68
5.17 Unit 9 Eccentri. c Load, Hi'gh Speed 69
5.18 Unit 9 Eccentric Load~ Hi.gh Speed 70
5.19 Unit 11 Axi.a l Load~ High Speed 71
5.20 Unit 12 Axial Load, High Speed 72
5.21 Unit 13 Axial Load2 High Speed 73
5.22 Unit 14 Axial Load, High Speed 74
5.23 Unit 15 Axial Load, High Speed 75
5.24 Unit 17 Axi.al Load? High Speed 76
5.25 Unit 18 Axial Load, Hi.gh Speed 77
5.26 Unit 19 Axial Load, High. Speed 78
5.27 Unit 20 Axial Load, High Speed 79
5.28 Unit 21 Axia 1 Load, Slow Speed 80
5.29 On it 22 Axi a 1 Load1 High Speed 81
5.31 5.32 5.33 5.34 5.35
Unit 24 Axial Load, High Speed Unit 25 Axial Load, High Speed Unit 26 Axial Load, High Speed Unit 27 Axial Load, Medium Speed
Plain Concrete Units Loaded at Different 5.36 8 Bar Units Loaded at Different Rates 5.37 12 Bar Units Loaded at Different Rates
Rates
5.38 Effect of Confinement Ratio for an 8 Bar Unit 5.39 Effect of Confinement Ratio for a 12 Bar Unit 5.40 Strength Increase Versus Confinement Ratio 5.41 Confinement Due to Distribution of Longitudinal
Vi'i i
83 84 85 86 89 90 91 94 95 96
Table
1.1
3.1
3.2
3.3
4.1
5.1
5.2
LIST OF TABLES
Title
Summary of Tests Reported by Different Researchers. (After Sheikh (1978) (21
Hoop Bar Diameter and Spacing of Hoop Sets Yield and Ultimate Steel Stresses
Test Unit Properties Calculated Eccentricities Summary of Results
The Effect of Loading Rate on Peak Stress
3' 4
30 32
39 45
48
b or b• c cl d dl dll /5, Ec E: Ec E: cu Esl,Es2 E:y Eo,Eoo E20c E50c E: 50u fc fl c
f' s fy fyh h 1cr k Ks NOTATION
= area of concrete section confined by hoops = gross area of section
= area of longitudinal steel
= area of rectangular hoop bar (one leg only)
= total effective area of hoop bars and supplementary cross ties in the direction under consideration within spacing sh = core dimension
= neutral axis depth at ultimate
= centre to centre distance between the longitudinal bars = effective depth of section
nominal diameter of longitudinal bar
= nominal diameter of transverse feinforcement = displacement
= modulus of elastici'ty of concrete = strain
= concrete strain
=:. ultimate concrete strain
= minimum and maximum average 1 ongitudina 1 strains corresponding to the maximum stress in concrete (2} = steel yield strain
= concrete strain at maximum stress level = concrete strain at 20% maximum stress (18)
= concrete strain at 50% maximum stress for confined concrete (18)
= E50c - E50u (18)
= concrete strain at 50% maximum stress for unconfined concrete (18)
= stress in concrete
=concrete cylinder strength = stress in transverse steel
= yield stress in longitudinal steel = yield stress of transverse steel = depth of full section
= cracked section modulus = maximum stress ratio (24)
= ratio of the strength of confined concrete to the strength of plain concrete (2)
m
M
Jl n
NA
pe Po pace Ps Pt
¢
1>
1>
u
ipy
s or sh
z
=
cover concrete ratio for confined concrete=
moment=
displacement ductility factor= number of longitudinal bars in the specimen = neutral axis
= axial load due to gravity and seismic loading
=
0.85 f~ (Ag - Ast) + fy Ast= 0.85 f~ (Ac - As) (12}
= volumetric transverse steel ratio
=
longitudinal steel percentage=
capacity reduction factor=
curvature=
section curvature at ultimate=
section curvature at yield= spacing of hoop sets
CHAPTER ONE
INTRODUCTION
1.1 GENERAL
For moment-curvature analysis of structural members and systems it is usually necessary to model the behaviour of the materials used. For reinforced concrete structures under monotonic loading suitable models exist for unconfined concrete and for steel, but limited information is available for concrete confined by transverse reinforcement.
The stress-strain curve for unconfined concrete is well known and generally accepted to finish at Ecu = 0.003, when crushing occurs.
However under seismic loading high ductilities are often demanded of structures, which require ultimate concrete strains much greater than Ecu = 0.003. These strains and ductilities can be achieved by providing
longitudinal and transverse reinforcement to effectively confine the core concrete. The confinement is provided by allowing the concrete to arch stirrup to stirrup vertically and bar to bar horizontally which is often assumed to confine the core as if by an equivalent uniform lateral fluid pressure.
A knowledge of the stress-strain curve for confined concrete is partic-ularly important for columns with high axial load levels, when the moment curvature characteristics of the column are largely dependent on the concrete compressive strength and the stress strain relationship.
1
Early research on confined concrete was (generally) on small scale, concentrically and monotonically loaded units, often without cover or longitudinal reinforcement. The testing was generally carried out in load controlled testing machines at slow loading rates.
1.2 AIM
The aim of the study of this report was to examine Experimentally the confinement requirements of Chapter 17 of DZ 3101( 1), "Members subjected to flexure and axial load- additional seismic requirements", in order to further understand the behaviour of confined concrete in rectangular reinforced concrete columns in earthquake risk areas. To minimise interpretation problems inherant in extrapolating previous test data to seismic conditions, the study aimed at testing near full size models at rapid loading rates in a displacement controlled testing machine to more closely simulate seismic conditions.
1.3 SCOPE
Thirty large scale, about half to two-thirds full size, square column sections were designed to the revised provisions of Chapter 17 of DZ 3101, and confined to four different axial load levels, nominally 0.1, 0.25, 0.4, 0.7 off~ Ag. These were subjected to concentric or eccentric axial loads to failure at slow or dynamic loading rates.
1.4 FORMAT
The next section contains a brief review of previous research carried out in the field of the stress-strain behaviour of confined concrete.
Chapter Two examines the various code provisions for confining steel. Chapter Three outlines the design and construction of the test units along with the properties of the materials used, while Chapter Four describes the instrumentation and testing procedure.
Test results are presented in Chapter Five in the form of load, confined concrete core stress/cylinder strength and hoop steel stress plotted against longitudinal strain. The results are summarised in Table 5.1 Trends in the results are also compared and discussed in Chapter Five,
A
summary and conclusions are given in Chapter Six along with suggestions for the direction of future research.
References are listed in Appendix
A.
1.5 PREVIOUS RESEARCH
3
various institutions throughout the world. Comprehensive literature surveys
(2) A
have been collated recently by Leslie (1974)( 25 ) and Sheikh (1978) summary of the work reviewed by Sheikh( 2) is given in Table 1.1. A brief description of the salient points from the more important
researchers, based on Sheikh 1s survey( 2) is presented below. The work summarized will concern mainly square or rectangular column units confined by square or rectangular hoops. This report will not discuss results for spiral column tests.
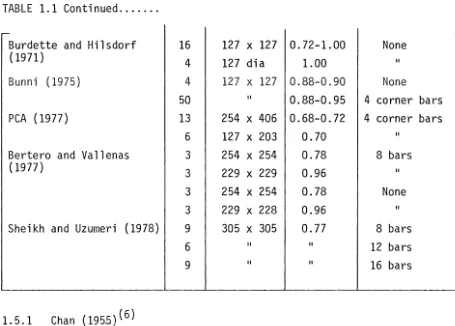
TABLE 1.1 : Summary of the Tests Reported by Different Researchers (Sheikh(l978)( 2)
Details of the Specimens
Researcher Size of A Longitudinal
Number the section core
mm Agross Steel
King (1946) 164 89 X 89 0.54-0.61 4 corner bars
King (1946) 18 254 X 254 1. 34-0.66 li
Chan {1955) 9 152 X 152 0.63-0.92 li
7 152 X 152 0.92-0.96 li
7 152 dia 0.97 4 bars
Bresler and Gilbert 2 203 X 203 0.61 6 bars
(1961) 2 203 X 203 li 8 bars
Pfister (1964) 4 305 X 305 0.42-0.53 12 bars 3 203 X 457 0.36-0.49 12 bars 4 254 X 305 0.49 6 bars Roy and Sozen (1964) 45 127 X 127 0.86x0.9 4 corner bars
Bertero and Felippa 2 76 X 76 None
(1964) 5 II
4 corner bars
2 108 X 108 None
6 II
4 corner bars Hudson (1966) 32 102 X 102 0.46-0.47 8 bars
28 152 X 152 0.63-0.66 8 bars Soliman and Yu (1967) 3 152 X 102 0.92-1.00 2 bars
11 II
0.44-0.92 4 corner bars
1 152 X 76 0.91 II
1 152 X 127 0.93 II
Shah and Rangan (1970) 11 51 X 51 0.83 None
Somes (1970) 42 102 X 102 0.88-0.92 None
Sargin (1971) 41 127 X 127 0.64-0.96 None
-TABLE 1.1 Continued ...
..-Burdette and Hilsdorf 16 127 X 127 0. 72-1.00 None
(1971) 4 127 dia 1.00 II
Bunni ( 1975) 4 127 X 127 0.88-0.90 None
50 II 0.88-0.95 4
corner bars PCA ( 1977) 13 254 X 406 0.68-0.72 4 corner bars
6 127 X 203 0.70 II
Bertero and Va 11 en as 3 254 X 254 0.78 8 bars
(1977) 3 229
X 229 0.96 II
3 254 X 254 0.78 None
3 229 X 228 0.96 II
Sheikh and Uzumeri (1978) 9 305 X 305 0. 77 8 bars
6 II II 12
bars
9 II II
16 bars
1.5.1 Chan (1955)( 6)
As part of some other investigations Chan reported the testing of 9 prisms 152 x 152 x 292 mm with bent-in hoops, 7 cylinders 152 mm diameter and 305 mm high with spiral reinforcement, and 7 prisms 152 x 92 x 1321 mm with welded hoops. These were loaded eccentrically or axially with a transverse load at the mid point. Chan•s results for rectangular hoops, when compared with unconfined concrete, showed a strength increase of more than 50%, an increase in ultimate strain of about 500%, and that these increases were only 50% and 70% respectively of those for equivalent spiral reinforcement.
To determine the effect of confinement Chan ignored the hoop spacing, and considered only the volumetric ratio of hoop steel.
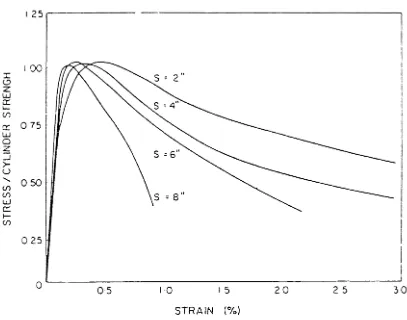
1.5.2 Roy and Sozen (1963)( 10), (1964)( 11 )
[image:17.602.73.528.69.395.2]of concrete but not the concrete strength (peak stress) (See Figures 1.1 and 1.2).
I 25!
I 00 I
t:) z
w
0::
1-r.r:
0:: 0 75
w
0
;s ...J
[image:18.599.81.488.153.473.2]>-u
... 050
(f)
(f) w
c::
I-(f)
0 25
STRAIN (%)
FIGURE 1.1 Effect of Tie Spacing on Stress-Strain Relationship of Concrete (Roy and Sozen 1963)(10)
,
0.5fc
I
I
I
_ _j _ _ _ _ I
I
I
I
r
0.002 E 5o
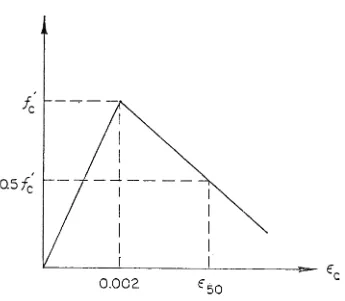
FIGURE 1.2 Stress-Strain Curve for Concrete Confined by Rectangular Ties as proposed by Roy and Sozen
(1964) ( ll)
where
E:
50
p h
= 3! s
'4
-s-h = overall depth of member
ps
=
ratio of volume of transverse reinforcement to volume of concrete core [image:19.600.103.448.93.394.2]7
1.5.3 Bertero and Felippa (1964)( 12 )
In their discussion to Roy and Sozen•s paper above( 11 ), Bertero and Felippa reported the results of tests performed on 76 x 76 x 305 mm and 114 x 114 x 305 mm p sms with square hoop steel and/or longitudinal steel under concentric loading. Increases in concrete strength were found to be 13% to 26%, depending on the hoop steel volume. It was concluded that
longitudinal steel alone did not enhance the concrete ductility. Hoops alone however did, and hoops with longitudinal steel provided even greater ductility enhancement.
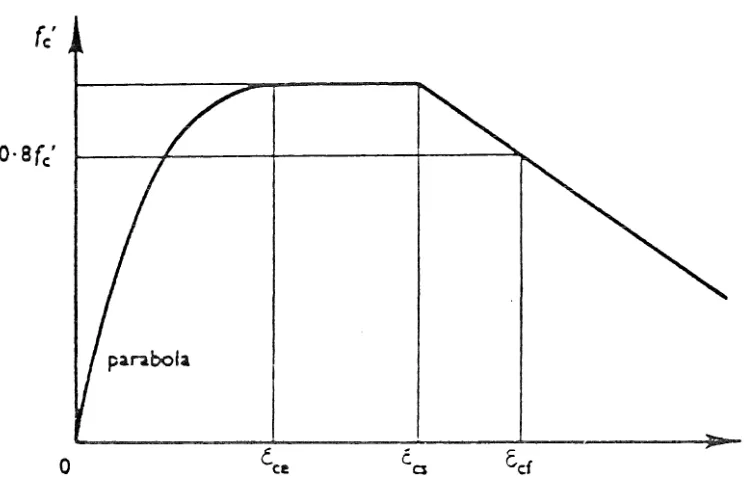
1.5.4 Soliman and Yu (1967)( 15 )
Soliman and Yu conducted a study on the flexural stress-strain relation-ship of-confined concrete. Fourteen units 152 x 102 x 1321 mm and one each 152 x 76 x 1321 mm and 152 x 127 x 1321 mm 2343 tested under the action of a major load and a minor load applied such that the neutral axis was kept constant near the tension side of the unit and parallel to the stronger axis throughout the entire range of loading.
An increase in concrete strength of up to 28% was observed by using closely spaced rectangular hoops. It is unclear whether this was based on gross concrete area or core concrete area. It appears also that no consideration has been given to the spalling of the cover concrete and that the stress-strain curve was based on the total concrete area initially under compression.
0·8fc'
0
FIGURE 1.3 Stress-Strain Relationship of Confined Concrete in Flexure (Soliman and Yu 1967)( 15 )
1\
Atie(So-S)
M
q"
=
( 1. 4 A cc - 0. 45)c At. S + .0028 BS2 1e
fcmax
=
0.9 f~ (1 + .05 q") Ece=
0.55 f~ X 10-6Ecs
=
0.0025 (1 + q")Ecf
=
0.0045 (1 + 0.85 q")! ' ! ' . 1.1
1.2 1.3 1.4
[image:21.599.82.454.191.436.2]where for these equations
Ac
=
area of concrete in compressionA = area of confined concrete in compression
cc
At. 1e
=
area of bar used for tieB = width of bound concrete or 0.7 (depth
of bound concrete) whichever is greater f1 = concrete cylinder strength
c
fcmax
=
maximum stress in confined concretes
=
tie spacing= tie spacing at which ties are not effective
in confining the concrete, for the tests reported in the paper S0
=
10 in.A
9
In the q11 relation, the term Ace seems to be present in order to give the stress-strain relation for thecgross concrete section which will result in a lower value of q11 and hence lower values of fcmax' Ecs and Ecf"
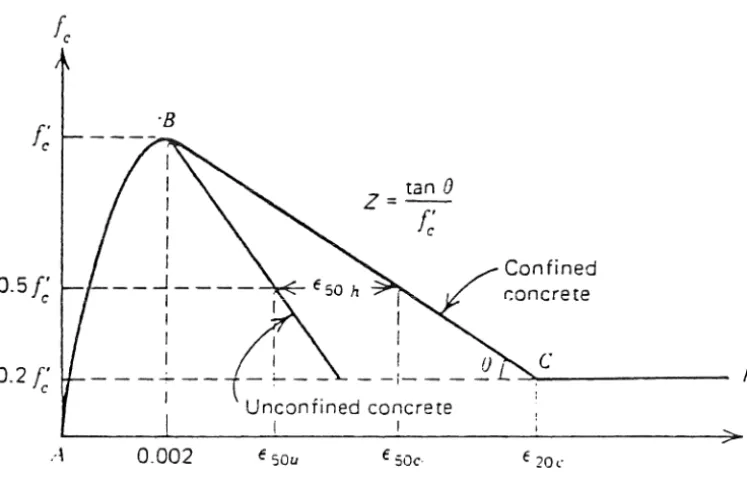
1. 5.5 Kent and Park {1971)( 18 )
f' c ·B
z
=tan 0r;
0.5['
c
Confined r.oncrete
0.2 f' c
c
Unconfined concrete
I I
A 0.002 c sou € 50c € 20<"
FIGURE 1.4 Stress-Strain Curve for Concrete Confined by
Rectangular Hoops (Kent and Park 1971)( 1S)
Region AB for E: < E:
c- 0
where Eo = .002
2E
(E:c)2) fc = f' (-c-c E: Eo
0
Region BC for Eo ~ E:c ~ E:20c f = f' {1-Z( c - c ) J
c c c 0
/)
tc
1.6
[image:23.605.104.478.141.380.2]J.l
where
z
= 0.5E5ou + E5oh -E: co
1.8
3 + 0. 29f ~
=
E5ou 145f ~ - 1000 1.9
1.10
where for these equations
f' c
=
concrete cylinder strength in MPa, and h"=
width of confined core,Region CD £c .L E20c
f c
=
0.2 f' c 1.11This relationship was proposed on the basis of an analysis of existing experimental data. It incorporates many features of previous researchers but no increase in the strength of confined concrete was considered, although many researchers(l 6, 12 ' 13 ' 15 ) observed a significant increase in concrete strength due to confinement by rectangular hoops. Thi$
assumption was based conservatively on the test results of Roy and Sozen (1964)( 11 ) which indicated no significant increase in strength due to confinement by square hoops.
The falling branch was developed from the results of Roy and Sozen (19641
(ll), Bertero and Felippa (1964)(.17) and Soliman and
Yu
(19671(15 1,_ Itwas assumed to be 1 i near and fo 11 ows the same format as suggested By Roy and Sozen (1964)( 11 ).
It was also assumed that the stress~stratn curve for the cover concrete was either the same as the unconfined concrete~ or the confined concrete core, or somewhere in between, at strains less than 0.004, At strai.·ns greater than 0.004 the cover was considered to have spalled and to have zero strength.
1.5.6 Sargin
(1971)(
19~
20l
loading and the remainder were tested under eccentric loading. All the specimens were 127 x 127 x 508 mm and contained no longitudinal reinforce-ment.
For concentrically loaded plain prisms the average concrete strength was about 98% of the cylinder strength and the strain, over a 254 mm gauge length, corresponding to the maximum stress was 0.0024. For eccentric loading these values were 100% and 0.003 measured over a 127 mm gauge length respectively.
These findings conflict with those of Sturman, Shah, and Winter (1965)( 26 ) where they found the strength of concrete in eccentrically loaded units to be 20% higher than that of concentrically loaded units. Results reported by Hognestad et al (1955)( 27 ) found excellent agreement between stress-strain curves for their eccentrically loaded prisms and concentrically loaded cylinders.
Sargin carried out a theoretical analysis of his results assuming that the increase in strength of the 'truly• confined concrete core is 4.1 times the lateral pressure, and that the hoops yield at or before the concrete reaches its maximum strength.
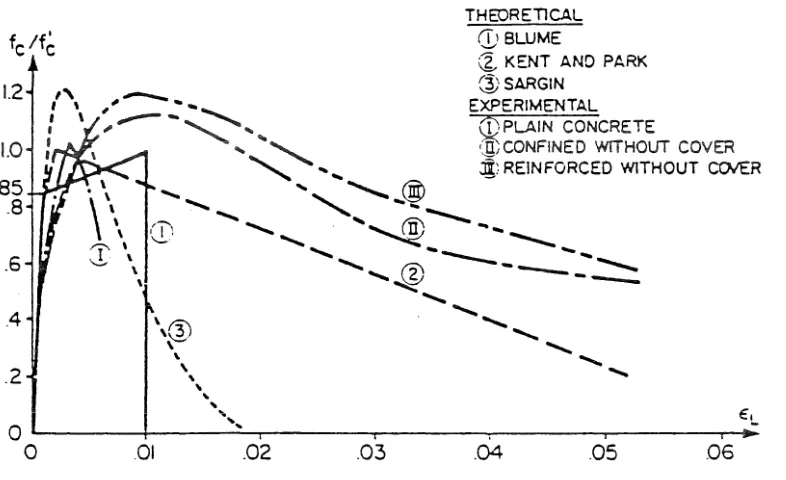
1.5.7 Vallenas, Bertero and Popov (1977)(24 )
1.2 1.0 .85 .8 . 6 4 . 2 THEORETICAL
CD BWME
\b KENT AND PARK @SARGIN
' - - .. EXPERIMENTAL
, . , - - ... .. ... =,;,-:::c..:.:..:.:.:.=:...:,,:-:=
"' " .. ._ ~PLAIN CONCRETE
..., " ' '-M, CONFINED WITHOUT COVER
[image:26.599.94.487.79.319.2]'-... ...
.:g;
REINFORCED WITHOUT COlER [image:26.599.94.482.497.707.2]...
...,
... ~ ... ... @)..._ ... ... ~...
...__
...--
...
... ..@ ... -:-..::::::
... ......
\@ \ ' \ ... ' ... ...'
~
OL---+---~-.---~---~---~---r~0 01 .02 .03 .04 05 06
FIGURE 1. 5
fc/f~
L2r---:,-1.0
.8
Comparison of Analytical Curves with Experimental Results (Vallenas et al, 1977)(24 )
8 .... , ... , ...
...
...
...
...
...._... ...
...
r--
9"---i-
......
.-EXPERIMENTAL6
4
2
0 A
0
FIGURE 1.6
... ..!
CJl
ANALYTICAL-...
c
' I I I I €L
Eo, E.3kl
.01 .02 03 04 .05 06
Confined Concrete with Longitudinal Reinforcement -Analytical Curve and its Comparison with Experimental Results (Vallenas et al, 1977}( 24 )
D
Region AB
E E E E 2 fc - j.o
(_!_)-k(_!_)
c Eo Eo
y
-f.EcEo
J
( .:1.)
c1 + "i("f"' - 2
L.: c so
1.12
Region BC fc
k [ 1-ZE0 EL 1)]
y -
(-c Eo
1.13
Region CD f c
0.3 k
1'- . . . 1.14
where
c
. 734(5) ) Ps fyh
E = . 0024 + . 006 (1 - h n
0 jf~
d"
s (
p s + d p) f yhk = 1 + .1096 (1-. 24 h" ) " '
-If~
0.5
z
=---=---=---=---:::~---3 /lh" . 3 + 0.29 f~
4
Ps /s-
+ (145 f 1 - 1000 ) - · 002c
where for these equations
d = diameter of longitudinal steel bar
d11
=
diameter of tie barEc = initial modulus of elasticity of concrete (MPa)
fyh = yield strength of tie steel (MPa)
h" - core dimension of rectangular tied colum inside the hoop (mm)
k = ratio of maximum stress in the confined concrete to the cylinder strength
S = hoops spacing (mm)
1.15
1.16
p
=
=
volumetric ratio of the longitudinal steel volumetric ratio of the tie steel
It is worth noting that these equations are dimensionally dependent and The
15
the equation for E0 appears to provide too large a strain increase. result is that the stress at a strain of 0.002 is significantly less f1 • The equations also suggest that strength and ductility are not
than c
directly proportional to the confining force.
Gill, Park and Priestley (1979)( 28 ) have shown that when applying the model to members under combined axial load and bending, results from moment-curvature analysis using Vallenas, Bertero and Popov•s model have under-estimated the moment when compared with both experimental results and other models e.g. Sheikh and Uzumeri( 2).
1.5.8 Sheikh and Uzumeri (1978)( 2)
Sheikh and Uzumeri (1978)( 2) presented the results of 24 columns 305 x 305 x 1956 mm loaded in monotonic axial compression. Four different lateral steel arrangements, involving rectangular and/or octagonal hoops were used with 8, 12 or 16 longitudinal bars. Also examined were the volume spacing and characteristics of the hoop steel, and volume of longitudinal steel. It was concluded that rectangular hoop reinforcement enhances the strength and ductility of confined concrete. The distribution of longitudinal steel around the core perimeter increased the efficiency of the confine-ment. A closer spacing of hoops resulted in higher concrete strength and ductility for the same amount of hoop reinforcement and vice versa. A higher steel strength and larger amount of hoop reinforcement resulted in higher strength and ductility.
t
U1 U1
w
0:: 1-(J)
QL---~~---J---L---
STRAIN---+-FIGURE 1.7 Stress-Strain Cutve for Cohfin~d Concr~t~ in Sq~are Columns (Sheikh and
Uzu~ert
1978)(2]Ks = l.O + l40P 1
[o -
nC2
}(1 - 0.5~l\2JM
5.5 b
2
b s s. DCC
(ff in MPa and p in KN)
s DCC
£sl = 80 Ks f'
c X 10-6
(f'
c in MPa)£s
1. 0 + 2~8 p f'
= [ 1 - 5(S/b)
2]
s s£00
If[
(C in mm; f' and f' in MPa}
c s
£
S85 = 0.225 ps;'b!S + £s2
...
I!! ~ ..
1.18
1.19
1.20
1.21
The units tested by Sheikh and Uzumeri, which were more realistically sized than previous tests, showed clearly the enhancement of strength and
ductility due to confinement. The model however produces a flat plateau in the stress-strain curve due to the use of high yield strength hoops,
(fyh
=
520 or 700 MPa). This meant that when maximum concrete core17
confining pressure to increase with subsequent increases of longitudinal and lateral strain. It is felt this may not be suitable for New Zealand conditions where lower grades of hoop steel (e.g. fyh
=
275 or 380 MPa) are commonly used which might not produce this plateau.1.5.9 Modified Kent and Park (1979)( 29 )
In the light of research results presented more recently by Gill, Park and Priestley (1979)( 28 ) a modified form the Kent and Park stress-strain relationship has been proposed by Park, Priestley and Gill (1979)( 29 ) which accounts for the increase in the concrete core strength and strain at maximum stress.
The maximum stress reached is given by Kf~, where fyh
K=1+p F
s c
The maximum stress, Kf~, is assumed to occur at a strain of 0.002K. The regions of the stress-stain curve are shown in Figure 1.8 and as detailed below.
ill ill
<lJ
... ..._
1.1)
Q.J ....
<lJ
...
u c:
8
Modified Kent and
Park , Confined Z m = - -tan8m
Kf~
where K = 1 + Ps fyh
f' c
Kent and Park, Confined
if K = 1 is assumed
---Unconfined
0.002K
c
A ~--J-J~---~---~---~---~
0 0.002 0.005 0.010 0.015 0.020
Concrete Strain, Ec
FIGURE 1.8 Stress-Strain Curve for Concrete Confined by
Region AB
Region BC (cc > 0.002K)
f
=
KfT [1 -z (
E - 0. 002K)J
c c m c
but not less than 0.2Kf', where c
0.5
z
=
~-:--;~""',.,---m 3 + 0.29f'c 3 /["
145f~- 1000 +
4
Ps;sh- o.002K1.22
1.23
1.24
Gill, Park and Priestley note that the increase in peak stress may not be as much as observed in tests but the discrepancies seem to make little difference when using the model for moment-curvature analysis as Gill, Park and Priestley (1979)( 28 ) have shown.
It should be noted that the basis of choosing 0.002K as the strain at peak stress is so that the second degree parabola defining the region AB
maintains the same tangent modulus at zero stress (i.e. the same initial modulus of elasticity) regardless of the value of K. The relationship also assumes that rectangular hoops are only one half as effective as a circular spiral in enhancing the strength of the concrete.
1. 5. 10 Summary
arrangements of rectangular hoops.
The definition of the core is another variable over which there has been
much disagreement, brought about at least in part by the large variation in calculations of volumetric hoop steel ratio and gain in concrete strength which occur with small test models. Theoretically it is likely that the core may be defined to the centre~line of the outer hoops but from a practical standpoint and in keeping with current practice it will be taken in this study to the outside of the outer hoop. The behaviour of the
cover concrete is another variable which is often ignored by researchers.
Attempts have been made to overcome this problem by casting test units without cover, however Burdette and Hilsdorf (1971)(2l) showed that for
columns without cover, shrinkage may result in an appreciable reduction
in the strength increase due to confinement. In this study the behaviour of the cover has been taken as that for the large plain concrete units and
its load carrying capacity at various strain levels calculated accordingly.
King (1946)( 3) concluded from comparitive scaled up tests that the
behaviour of large size columns would be very different from small scale
models, and that a large number of parameters would require investigation before the results of small scale models could be used to predict the behaviour of full size units.
None of the previous experimental research was carried out at loading rates simulating those likely to occur during an earthquake. Generally tests were carried out on axially loaded units. Therefore, there must remain doubts about the validity of the proposed curves to seismically loaded columns subjected to combined axial load and bending moment.
CHAPTER TWO
CONFINEMENT REQUIREMENTS FOR PLASTIC HINGE ZONES
IN REINFORCED CONCRETE COLUMNS
2.0 SUMMARY
This chapter reviews the requirements for confining steel in plastic hinge zones in rectangular columns, as specified in the seismic codes of various countries. In particular a comparison is made between New Zealand and overseas recommendations. This work is summarised from a paper by Park and Priestley (1979)( 30 ).
2.1 THE CODES CONSIDERED
The overseas code requirements for reinforced concrete design considered in this section will be the A.C.I. Building Code( 31 ), the S.E.A.O.C. Code (32 ), the tentative provisions for buildings of the A.T.C.( 33 ) and the A.C.I. Committee 343 report on the analysis and design of bridge
structures( 34 ). An indication of Japanese practice can be obtained from publications in English for example references 35 and 36. In New Zealand the Ministry of Works and Development have developed provisions for
21
2.1.1 ACI 318-77( 31 )
Confining steel consisting of hoop reinforcement is required over the end regions of columns adjacent to moment resisting connections over a length from the face of the connection equal to the greater of the over a 11
thickness h (h being the larger sectional dimension for rectangular columns), one-sixth of the clear height of the column, or 450 mm.
For rectangular hoop reinforcement, with or without supplementary cross ties, if Pe ~~ 0.4Pb. the transverse steel should be designed as for beams but the hoop bar diameter should not be less than 10 mm and the spacing should not exceed d/2. If Pe > ~0.4Pb' and if a single rectangular hoop is used, the area of one leg of the hoop bar in the direction considered within spacing sh should be at least equal to
2.1
where ps is calculated by the greater of Equations 2.2 and 2.3.
If Pe ~ ~o.4Pb, ps is required to be at least equal to
p = 0. 45 [ A _g_ - 1
J
_c_ f 1s Ac fyh 2.2
If Pe > 0.4~Pb, ps should not be less than that given by Equation 2.2, or
p = 0.12f~/fvh
s - ,J ••
2.3
wtth
Ac
taken as the area of concrete core measured to the outside of the pertpheral hoop, The value of sh used should not exceed 100 mm.Supplementary cross ties of the same bar diameter as the hoop may be used to reduce the unsupported length lh, The hoop and cross tie bar diameter should not Be less than 10 mm for longitudinal bars 32 mm diameter or
smaller~ or 12 mm for larger longitudinal bars or bundled bars.
2,1,2 SEAOC (1975}(32
1
The potential plastic hinge zone is taken as in ACI 318-77,
2.4
or
A =0.12sh"f'/f
sh h c yh . . . 2. 5
whichever is greater. The value of sh used should not exceed 100 mm, and supplementary cross ties or legs of overlapping hoops should not be spaced at more than 360 mm between centres transversely.
2.1.3 ATC (1978)( 33 )
The SEAOC provisions appear to have been followed for fully ductile frames.
2.1.4 ACI COMMITTEE 343( 34 )
For rectangular hoop steel the transverse bar diameter is specified as in ACI 318-77. The quantity of transverse steel is not specified, but it is stated that the tie spacing should not exceed the least dimension of the member or 300 mm, except that when bars larger than 32 mm diameter are bundled the tie spacing should be reduced to one-half of that value.
2.1.5 \PANESE PRACTICE( 35 • 36 )
No information was available to Park and Priestley (1979)( 30) regarding current Japanese practice for bridges. However, AIJ requirements for buildings( 36 ) specify a minimum rectangular hoop diameter of 9 mm with spacing not to exceed the lesser of 150 mm, one-half of the smaller column dimension, or 7.5 longitudinal bar diameters.
2.1.6 N.Z. MINISTRY OF WORKS AND DEVELOPMENT, CIVIL DIVISION( 37 • 38 )
Until recently the design of confining reinforcement for bridge columns was governed bv the MWD provisions (37 • 38 ). This involves sufficient confi111ng steel to ensure that the available structure displacement ductility factor~ is at least 6, ~u~ed on the following steps:
23
(2) Calculate the yield curvature ~y' and hence the required ultimate curvature ~u·
(3) Calculate the "ultimate" compression strain e:cu corresponding to ~u' based on a conservative idealisation for the stress-strain curve of confined concrete.
(4) Calculate the required volumetric ratio of confining reinforce-ment.
For rectangular hoops and supplementary cross ties ps is obtained using
e:cu
=
0.0021 { 1 + 150ps + (0.7 - 10 s)%}
2.6 Equation 2.6 is based on the work of Baker and Amarakone( 39 ) and Chan{6 ), but was made significantly less conservative than the results of that work in the light of the findings of more recent tests (see the December 1977 amendment ( 37).It is understood that the MWD will be adopting the requirements of the new SANZ Concrete Design Code (at present in draft form( 1)) when that SANZ code is available in its final form.
2.1.7 DRAFT SANZ CONCRETE DESIGN CODE( 1)
The confinement provisions of the draft SANZ Concrete Design Code, DZ3101, are based on the ACI/SEAOC requirements modified to take account of the effect of axial load level.
(a) First Draft
nor
In the first draft of DZ3101, issued for comment in 1978, the potential plastic hinge regions were specified as in ACI 318-77.
The total area of rectangular hoop reinforcement, including supplementary cross ties if any, in the direction under consider-ation in potential plastic hinge regions, when Pe ~ 0.6f~Ag, was required to be not less than
2.7
f1 p
= o.12shh"
T-
[o.33 + 1.67f•~
J
less than O.lf'A . The diameter
c g
least 10 mm, and the maximum where Pe was not to be taken as
of hoop or tie bar was to be at
centre specing of hoop sets was not to exceed the smaller of one-fifth of the smaller member section dimension, 150 mm, or six times the diameter of the longitudinal bars. The yield force of the hoop bar or supplementary cross tie was to be at least one-sixteenth of the yield force of the longitudinal bar or bars it was to restrain. Other rules were also given to ensure adequate lateral support of the longitudinal bars. These equations were based on theoretical moment-curvature analyses( 25 ) conducted
using the stress-strain model proposed by Kent and Park (1971)( 18 ).
(b) Revised Draft
nor
The potential plastic hinge region for Pe ~ ~0.3f~Ag is now recommended as not less than the longer column section dimension in the case of a rectangular section, or where the moment exceeds 0.8 of the maximum moment at that end of the member. When
P > ~0.3f'A the potential plastic hinge region is increased to
e c g
1.5 times the above value.
In potential plastic hinge regions when rectangular hoops, with or without supplementary cross ties, are used and either
Pe ~ ~0.7f~Ag or Pe ~ ~0.7P0, the total area of transverse steel
within spacing sh should not be less than
A f' p
Ash = 0.\hh" [
~-
1J
T-
(0.5 + 1.25 ~f'A eyh c g 2.9
f' p
Ash = 0.12shh11 / (0.5 + 1.25 e
~f'A
yh c g
2.10
When the load Pe has been obtained using a capacity design procedure, the value of the strength reduction factor ~ in all the above equations can be taken as unity.
25
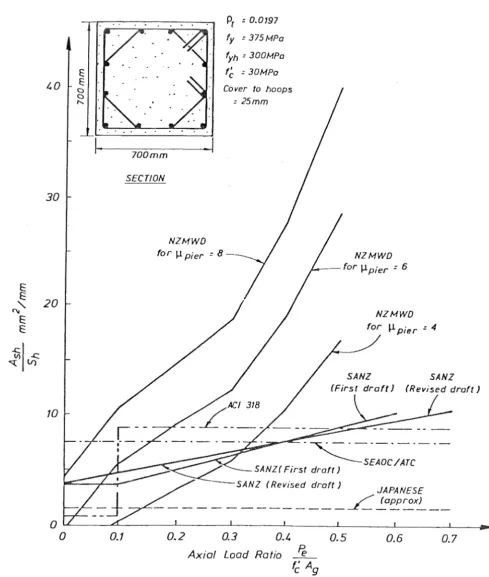
2.2 COMPARISON OF CODE REQUIREMENTS FOR A TYPICAL RECTANGULAR COLUMN The difference between the confinement ratios required by the above codes is illustrated in Figure 2.1 for a typical 700 mm square column confined
by an arrangement of square and octagonal hoops such as would be used in a building.
Figure 2.1 illustrates that the Japanese requirements apparently result in very low quantities of hoop steel.
The step change in the ACI 318 requirements has again been taken to occur at P e
=
0.4~Pb. the hoop
0.1f~Ag in Figure 2.1, which is a reasonable approximation for The SEAOC and ATC recommendations do not permit a reduction in content at low axial load levels. The SANZ (revised draft) quantity shows a linear increase in hoop content with axial load from 50% of the SEAOC moment at zero axial load to 1.38 times the SEAOC amount at P = 0.7f1A. Using the arrangement of one square hoop plus one octagonal
e c g
hoop per set, shown in the column section in Figure 2.1, the total effect-ive area of hoop bars per set, Ash' is taken as twice the area of the square hoop leg plus 1.414 (i.e. twice 1/12) times the area of the
octagonal hoop leg. Hence if both hoops are of the same size bar with leg area Asb' the value of Ash would be 3.414Asb· The SEAOC code requirements for the column shown in Figure 2.1 could be met using 16 mm diameter
square and octagonal hoop bar with the hoop sets placed at 88 mm centres. The longitudinal steel used in this example consisted of twelve 32 mm diameter bars.
As illustrated in Figure 5, the MWD approach requires substantially more hoop steel than does the other approaches at high axial load levels. At low axial load levels only very small quantities of confining steel are again required because of the high emphasis of the d/c ratio on Ecu in Equation 2.6. For example, Equation 8 indicates that Ecu
=
0.010 will be available if c/d < 0.19 even if ps = 0. Also there are large differences40
30
20
-CI -C
~V) lf)
10
E E
a a "
FIGURE 2.1
'·
SECTION 700mmNZMWD
P1 = 0.0197
fy = 375MPa fyh = 300!-1Pa
f~ = 30MPa Cover to hoops
= 25mm
NZMWD
~-for llpier = 6
NZMWD for ll pier = 4
SANZ
0.1 0.2 0.3 0.1. 0.5 0.6
Axial Load Ratio
Pe
f~ Ag
Comparison of Code Hoop Steel Reguirements for a Square Column (Park and Priestley (1979)(30)
SANZ
[image:39.600.42.532.119.696.2]2.3 CONCLUSIONS
The various overseas and New Zealand code recommendations for transverse confining steel in potential plastic hinge regions of columns and piers in seismic design show vast differences in the required quantities of
transverse steel and it is evident that this is still a matter of some controversy.
Recent tests on near full scale reinforced concrete columns containing spiral steel or rectangular hoop steel, under simulated seismic loading, at the University of Canterbury, have shown that the quantities of
confining steel recommended in the draft SANZ Concrete Design Code, with slight modifications mainly to take into account the effect of the
possible increase of actual concrete strength over a specified f~ and to avoid the spread of plastic hinging into less heavily confined regions, will result in available displacement ductility factors for columns of at
least 8.
The provisions for confining steel which have been used by the Ministry of Works and Development for ductile bridge piers appear to be very conservative when axial load levels are high and are in need of revision to avoid the use of excessive quantities of confining steel. This
observation is made not only from comparison with the quantity of
CHAPTER THREE
DESIGN AND CONSTRUCTION OF TEST UNITS
3.0 SUMMARY
This chapter describes the design of the test units, the properties of the materials used and the construction method employed.
3.1 UNIT SIZE CRITERIA
In 1978 the University of Canterbury installed a 10 MN Dartec Universal Testing Machine in the Civil Engineering Department, which now permits the testing of large scale building components at rapid loading rates.
Considerable effort was made to test as large a unit as possible, in order to avoid the complications caused by scale effects that have been noted by other researchers (e.g. King (1946)( 3) and Sheikh and Uzumeri (1978)( 2)). The 10 MN capacity of the Dartec testing machine was the dominant factor in determining unit size. Other factors which influenced final column dimensions were the expected enhancement of concrete
strength due to confinement and rapid loading rates; a realistic longitud-inal steel ratio; the expected yield and ultimate strengths of the
longitudinal steel; the ease of formwork construction and a suitable height to core dimension ratio. Based on these considerations a unit size of 450 x 450 x 1200 was chosen.
3.2 DESIGN OF TEST UNITS
3.2.1 Longitudinal Steel
The use of high strength steel (Grade 380) in reinforced concrete building columns is becoming increasingly common. The early strain hardening
29
in a bridge where plastic hinging must occur in the piers, the column overstrength may be very high with Grade 380 steel, resulting in excessive shear forces. To model current building practice 18 of the 30 units were constructed with Grade 380 longitudinal steel.
It has been shown that distribution of longitudinal steel has a marked effect on ductility( 40) and confinement( 24 ), and so two longitudinal steel distributions were chosen to represent current practice. The longitudinal steel was also selected to conform with NZS DZ3101( 1) and the volume of steel to be similar between units. The final choices for longitudinal reinforcement were 8 DH 24 bars with Pt
=
0.0186, or 12 DH 20 or 12 D 20 bars with Pt=
0.0179 as shown in Figure 3.1, where D signifies Grade 275 deformed bar (nominal f=
275 MPa) and DH signifies Grade 380 deformed bary
(nominal f = 380 MPa).
y
3.2.2 Hoop Steel
The hoop steel was designed to conform with a proposed modification of NZS DZ 3101( 1) for Special Transverse Hoop Reinforcement in Potential Plastic Hinge Zones, as detailed in Chapter Two.
The equations used in their modified form, restated here from Chapter Two, were:
A f~. 1.25P
=
o.35hh''Cf- 1) f (0.5 + f'A ec yh c g
3.1
or f' 1. 25P
Ash = 0.12Shh" / (0.5 + ...,.,f';-;:-A_e
yh c g
) 3.2
whichever is greater, where Pe is not greater than 0.7f~Ag.
Four levels of confinement were chosen to cover the range of axial loads, Pe. These were Pe equal to 0.1, 0.25, 0.4, and 0.7 of f~Ag. Confinement to an axial load level of 0.25f~Ag was chosen to be typical of current practice and to be representative when considering the effect of the other variables.
TABLE 3.1 Hoop Bar Diameter and Spacing of Hoop Sets
Pe Hoop Bar Diameter Hoop Spacing
f'A c 'g mm mm
0.1 11"\
98
lU
0.25 10 72
0.4 12 88
0.7 12 64
16 mm. :---llM=====$$======!F1
Support
---JI
barDH 24
R10
Hoopsets -~~~
Jl
r
5tJ = 98 mm nn==f=~~=======U/.
F-E
~~ ~~~~~;~~~:~
BDH24
RTO
' 183
450
.[
~r---!6mm
Suppo bar
sh varies between units
DH20
sets
Bmm
~r
-Cl__0 11 Yl 0
"'
111-L
~~
HI-7
I 0
0
H
"!"F= 1!!11
1-0
=
0"'
~-r0 0
"'
FIGURE 3,1 Details of Test Units and Transverse Retnforcement
31
0 0
3.3 MATERIAL PROPERTIES
3.3.1 Steel
The reinforcement for each bar size was chosen from a single supply batch to ensure uniform properties. Three randomly selected samples of each diameter bar were subjected to full extensometer tensile testing in order to establish the stress-strain relationships for the steel.
This assumes that the static stress-strain curve for steel in tension can be applied to steel in dynamic compression. For these test units the longitudinal steel carries a maximum load of about 1.5 MN so that an error of 10% due to any discrepancy between tension and compression yield, or from dynamic loading rates represents only 2% error in concrete core stress.
Table 3.2 summarises the yield and ultimate stresses while Figures 3.2 -3.6 show the measured stress-strain curves.
TABLE 3.2 : Yield and Ultimate Steel Stresses
Bar Yield Stress Ultimate Stress (MPa) (MPa)
DH 24 394 646
DH 20 434 708
D 20 272 416
R 12 296 424
R 10 309 436
3.3.2 Concrete
The concrete used in all specimens was delivered ready-mixed with a target strength at 28 days of 25 MPa, a slump of 75 mm and maximum aggregate size of 20 mm.
d:
~
I
(/")
t]
~
ll)
600
fy
=
394 MPofu
=
647 MPoE5
=
205 GPaCy
=
0.001870 I I ~
0 0.01 0.02 0.03 0.01, 0.05 0.06
STRAIN
FIGURE 3.2 : STRESS-STRAIN CURVE FOR DH24 STEEL (GRADE 380)
w800
-600
0
A
Q
fy
=
1.31. fv!Pa~
I
ll)
I
fu=
708 MPall)
lu
Es
=
185 GPo((
1--ll)
[ y -- 0 • 00213
I
I
200
0 " - - - J ' - - - L ~---~---~---~' ~
0 0.01 0;02 0.03 0.01. 0.05 0.06
STRAIN
FIGURE 3.3 :
STRESS~STRAINCURVE FOR DH20 STEEL (GRADE 380)
w1.00
. 16.1. [y ...
1
11--300 r.LI _ _ _ _ _ _ _ _
0
Q ~ V)
V) 200
IJ.J
~
V)
100 I'
fy
=
272MPa fu=
1.16 MPaE5 = 211 GPa
[y
=
0.00129ol
I I I I II~
0 0. 01 0.02 0. 03 0.01. 0. 05 0.06
STRAIN
0
Q ~
I
400
300
~
200~
lr)
100
J
14
6.49Cy1
fy
=
309MPafu
=
443MPaE5 = 185 GPo
€y
=
0.001670~---~--~----~---~---~~---~---~
0.03
STRAIN
FIGURE 3.5 : STRESS-STRAIN CURVE FOR RlO HOOP STEEL (GRADE 275)
0 0.01 0.02 0.04 0.05
0
a..
~
I
ll) V)
400
300
Lu 200
e:
t.t)
100
A
' I
... 6.09 [y..
I
I
-fy = 296MPa fu = 424 MPa E5
=
192 GPo[y = 0.00141
0 ~---~---~---~---~---~---~~~
0 0.01 0.02 0.03
STRAIN
FIGURE 3.6 : STRESS,STRAIN CURVE FOR R12 HOOP STEEL (GRADE 275)
0.04 0.05 0.06
w
-.
~
ll)
"< ,,
....__
~ 1.0
(::J
~
~
(/)
...
ltJ
(.!J
Q:: ~
)(
i?:
~
ltJ 0.5
~ (/)
Q::
l!J ~
~
<..J
~
~
00
0 <..J
Figure 3.7 shows the strength-age properties of the three batches of concrete as measured by standard 200 x 100 mm diameter cylinder tests. The average cylinder strength measured at 6 weeks is given in Table 3.3, which also summarises reinforcement details for all units. It will be noted that strength at 6 weeks was very close to the target value of 25 MPa for all three batches.
• Batch 1
X o Batch ;;
0 x Batch 3
10 ;;o 30 40
AGE· (DAYS)
39
TABLE 3.3 Test Unit Properties ...
"'
Number and Hoop0... .s::::
::E: +-'
Diameter Volume
.__; m Diameter c:
-o QJ
Yield and Yield of Hoop
c: $.... Specimen of c:C +-'
Vl
Spacing Strength Hoop Type
~
Number Longitudinal Strength
0 s.... Z Q J
Steel
-o Bars
.s:::: c:
U•i-(mm) (MPa) (mm) (MPa)
+-"
,.,--ra>,
rou
1 0 0 Q
2 12 'V 20 434 10 'V 72 309 ,0182
D
II II ~I
~· II
3
4 II !I 1,_1
·~ i).
(V)
-
II II fl,,
,,
lJ") 5
N
6 8 'V 24 394 "'' 1 .• 1 ,0174
~
2
7 II II . \.~
·~ I{
t-1
8 !I II I~ ~~ ll
9
,,
H II. "'· ~~10 II ..
,
"'
'·' I~·11 Q 0 Q
12 12 'V 20 434 10 'V 98 309 \0140
D
13
"
~ 10 'V 72'*
.018214 II I), 12 'V 88 296 ,0224
co
.
II II
12 'V 64 l1 ,0309
<:j-15
N
16 II IJ 10. "' 72 309 ,0182
2
17 8 'V 24 394 10 "' 98 lil ,0134
~
N
18 II II 10 rv72 u ,0174
19
"
H 12 'V 88 296 ,021320
"
ll12 "' 64 ~I ,0293
21 0 0 Q
22 12 'V 20 272 10 'V 98 309
,01400
23 !I I} 10 "' 72 I) ,0182
24 II II
12 "' 88 I) ,0224
N
<:j-25 ll II, 12 'V 64 ~~. ,0309
N
2 26 0 0 0
(V) 27 !I l,l "!
28 II 1.1 I~
29
"
I"' ~~3.4 CONSTRUCTION
The height of the test units was chosen to be 1200 mm for two reasons. Firstly this gave a suitable aspect ratio of 3 to 1 height to core dimens-ion, and secondly the 18 mm construction plywood was produced in a 2400 x 1200 mm module. This meant that test units could be cast in batches of ten in two moulds, each with five test units. The formwork was supported by 38 x 38 x 4.7 mm angle at all exterior joints and at the third points of height on each side. The test units were tied at these levels with 10 mm bolts into 16 mm diameter rods that were to be used as lifting points and also during testing as supports for the linear potentiometers used for longitudinal strain measurement.
The construction sequence consisted of tying the cages, fixing the strain gauges to the transverse reinforcement and placing the cages in the
painted and oiled moulds. The cages were fixed in position by the bolted tie rods.
The ready mixed concrete was placed in 3 lifts and well vibrated.
41
CHAPTER FOUR
INSTRUMENTATION AND TESTING PROCEDURE
4.0 SUMMARY
To obtain the strain and load measurements for analysis various instruments were required to record the data. This chapter details the instruments
used and describes the testing procedure.
4.1 INSTRUMENTATION
Two methods of recording data were used, depending upon the loading rate. For dynamic loading rates all measurements were recorded electronically and synchronised with a 2HZ timing signal generator. For 'slow' loading rates all measurements were recorded manually while loading continued at the preset rate.
4.1.1 Load Measurement
Two methods of load measurement were employed, The first (Pressure Load), as part of the Dartec testing machine equipment, measured load across the pressure transducer valves of the machine hydraulics to a precision of 1 kN. The second (Strain Load) measured load from strain gauges installed on the columns of the Dartec machine. Pressure load was recorded on
three Hewlett-Packard X-Y (Type 70358) Plotters, plotted against Dartec displacement, sum of East and West, and sum of North and South potentio-w.eter strains respectively, Strain load was recorded along with Dartec displacement against time on a two channel Hewlett-Packard chart recorder, (Type 7402A).
4.1.2 Longitudinal Concrete Strains
43
was found between the two records. As well as being recorded in pair summation plotted against load, as described above, individual potentio-meter readings were recorded on a 20 channel Bryans Southern Ultra-violet Chart Recorder.
4.1.3 Hoop Reinforcement
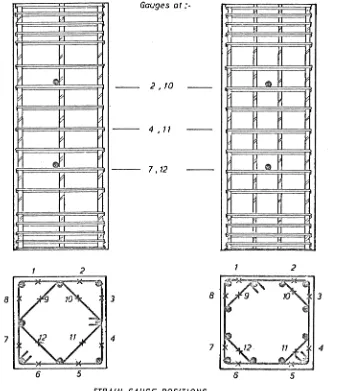
To measure strains·on hoop reinforcement, electrical resistance strain gauges were fixed to the underside of the transverse reinforcement. In general six gauges were located on each unit at three different levels within the test region, as shown in Figure 4.1. For tests carried out at slow loading rates additional strain gauges were used to obtain further information.
Gauges
at:-k'l F
~J i'1 "
r
Jl
- - 2,10 ~H
H
H
- - 4,11 H
H H H
H
H
~Irl
H H
~H
H
H H
- - 7,12
~
f ·-· n H
~.
" f
2
8 3 8
7 4
7
STRAIN GAUGE POSITIONS
[image:56.595.125.468.331.722.2]