Textures and Rare Earth Elements Composition of Banded
Iron Formations (BIF) at Njweng Prospect, Mbalam Iron
Ore District, Southern Cameroon
Dieudonne Charles Isidore Ilouga1,2*, Cheo Emmanuel Suh3, Ghogomu Richard Tanwi1
1Department of Earth Sciences, Faculty of Science, University of Yaoundé I, Yaoundé, Cameroon 2Camlron S. A., Yaoundé, Cameroon
3Economic Geology Unit, Department of Geology and Environmental Science, University of Buea, Buea, Cameroon
Email: *[email protected]
Received September 25, 2012; revised October 22, 2012; accepted November 23, 2012
ABSTRACT
The REE signature of banded iron formations (BIF) and martite-goethite mineralization of the Njweng ridge (South Cameroon) are used here to decipher the nature of the ocean during the period of BIF precipitation. The textures of typical BIF categories are also presented as the only sedimentary feature. Two types of BIF facies are present at Njweng: the oxide and silicate facies. These facies show two stages of phase transformations. The first is the transformation of the original magnetite mineral into martite by oxidation resulting in trellis texture; the second is a simultaneous trans- formation by hydration into goethite and dehydration into martite. The samples typically show LREE depleted patterns relative to HREE, a characteristic similar to that of modern seawater. Also the strong positive Eu anomalies from the samples indicate the involvement of hydrothermal plumes of volcanic origin such as at mid ocean ridges (MOR). Yt- trium (Y) has a strong positive anomaly pointing to the transportation of REEs as aqueous complexes within these an-cient seas. The BIF samples have no positive Ce anomalies, suggesting that the oceans at that time were more reducing with no Ce fractionation than in present day oceans. The martite-goethite mineralization rather shows a positive Ce anomaly that derived from the enrichment in REE during the weathering of REE-bearing minerals. These results are integrated into existing literature on REE in BIFs worldwide and provide new insights into these heretofore unstudied BIFs of the northern edge of the Congo Craton.
Keywords: REE; BIF; Martite; Magnetite; Alteration; Njweng; Cameroon
1. Introduction
The chemical coherence of rare earth elements (REE) and their similar ionic properties consequently give them similar geochemical behaviours. The element Yttrium (Y) is also often included in this category of elements be- cause of its properties that are similar to those of some elements of this group. Rare earth elements have been widely used as geochemical tracers of various types of processes in the Earth Sciences e.g. environmental and hydrological studies [1-3], ancient and modern analogues for seawater composition [4-11], origin and deposition of iron formations, other iron oxide-rich sedimentary rocks [12-16]. The geological rock record extends back some 3.8 Ga into Earth history and samples of ancient seawater are not similarly preserved [17]. Chemical sediments (e.g., limestones, iron formations, phosphorites) precipi- tated from seawater have been identified to record
some of the trace elements and isotopic characteristics of the water mass from which they were formed [18]. With the absence of preserved samples of old seawater, the REE patterns of the sediments are used as proxies to in- fer some of the important chemical features of the an- cient oceans. Iron formations being part of this have long been inferred as to have trapped the REE signature of seawater at the site of Fe precipitation as supported by experimented studies and results from natural systems [18,19]. More specifically Eu anomalies are tracers of hydrothermal input and Ce anomalies are used as redox proxies. Many aspects of the sedimentary origin of iron formations remain enigmatic because modern analogues are unknown. The intriguing question is still to know how these deposits were upgraded to iron ore [20,21], and whether REE signatures of enriched ores remained fix.
In this study we discuss the various banded iron for- mations (BIF) textural features, nature of iron-bearing oxides and their link with the deposition of iron forma-
We also compare them with modern day seawater REE [22] and chemical sediments that best represent the REE signature of seawater at time of precipitation like lime- stone [23,24].
2. Geological Context of the Study Area
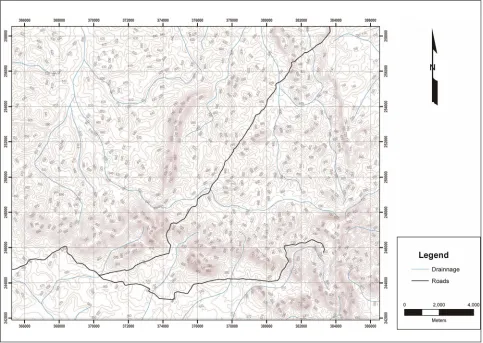
The Njweng prospect is situated in the dense humid equa- torial forest in the East-South-East of Cameroon. It is covered by equatorial climate with 4 seasons (two dry seasons and two wet seasons), and the topography be- longs to that of the central-south plateau of Cameroon with an average elevation of 700 m. The drainage pattern around the ridge is dendritic and oriented from south to the north, and separated by the ridge in two river systems (Karagoua and Bango) that take their sources at Mbarga to drain the area (Figure 1).
The Njweng iron prospect is located within the Ntem complex at the northern extension of the Congo Craton
[image:2.595.57.540.377.720.2]structures in the Ntem complex are an E-W-trending (S1) foliation and numerous granitic plutons that are usually emplaced along a SW-NE-trending (S2) foliation. The S1 foliation dips steeply to the north and is locally deformed into mesoscopic isoclinal D2 folds [27]. The S2 foliation is a regional, steeply dipping planar fabric with variably oriented stretching lineation and large-scale open folds that are associated with N-S-trending sinistral and dextral strike-slip faults and mylonitic (S3) foliation [28]. This S2 foliation development is linked to dome-and-basin tectonics related to diapiric movements [29]. The oldest rocks of the Ntem complex belong to the granite-gneiss assemblage, >3000 Ma [30], followed by granulite-facies metamorphism, granitoid plutonism and charnockitisa- tion at ~2900 - 2500 Ma. A major Eburnean tectono-me- tamorphic event at ~2000 Ma resulted in amphibolite-fa- cies metamorphism. During the Pan-African (~600 Ma), a mobile belt, the Yaoundé series, drifted southward and
Figure 2. Pan-African structural map of Cameroon and location of the study area (modified from [25]). 1: Quaternary sedi- ments; 2: Cameroon Line volcanism; 3: Cameroon Line plutonism; 4: Mesozoic sediments (Benue Trough); 5: Late syntec- tonic subalkaline granitoids; 6: Lom syntectonic basin (meta-sediments, conglomerates, volcanic ashes and lavas); 7: Western Cameroon Domain (WCD; early syntectonic basic to intermediate calc-alkaline intrusions, 660 - 600 Ma); 8a: Poli Group (active margin Neoproterozoic supracrustal and juvenile intrusions), 8b: Yaoundé Group (intracratonic deposits); 9: Mas- senya-Ounianga gravity highs (10 - 30 mgal); 10: Adamawa-Yadé and Nyong Paleoproterozoic remnants; 11: Craton and inferred craton; 12: S2 foliation and L2 lineation trends; 13: F2 upright and overturned antiforms; 14: Syn-D2 main frontal
thrust zone; 15: Syn-D1 thrust zone (separates the LP to MP zone in the North from the HP zone in the South); 16: Syn-D3
sense of shear movement; 17: Syn-D2 sense of shear movement. Large grey arrow represents syn-D1 - 3 regional main stress
plutonism. Itabirite rocks in the Ntem complex are con- sidered to be Archaean in age [31].
The Njweng prospect outcrops as a ridge with a N-S orientation (Figure 3) and is part of a wider iron ore dis-
trict locally termed “the Mbalam Iron Ore District”, that is currently being evaluated by the Cameroon Iron Ore company (CamIron) [32], and which comprises the Mbar- ga deposits, Metzimevin, Mbarga South and Meridional prospects (Figure 2). The main rock types of the Njweng
prospect are metamorphosed chemical sediments (BIFs with varying degrees of magnetite, hematite, and goethite enrichment), metagranitoids and amphibolites. In terms of structure, this prospect depicts a folded structure. The dominant structure in the area is the early N-verging re- cumbent F1 fold which was overprinted by a late W-ver- ging open F2 fold. Both F1 and F2 fold axes are dis- cernable in (Figure 3). Outcrop observations also reveal
this folding in itabirite, and the itabirite banding strikes N-S with a near vertical dips (average 75˚), and a dip direction E or W (Figures 4(a) and (b)).
3. Methods of Study
Selected representative samples of iron ore-bearing fa- cies were chosen for petrographic studies, ore micros- copy, and geochemical analyses following a careful field mapping of the prospect. Polished thin sections were prepared at the Mineral Resources Institute (MRI) of the Technical University of Clausthal in Germany and stud- ied under ore microscope (reflected light in air and oil immersion) both at Clausthal and at University of Buea.
Whole rock geochemical composition of representa- tive samples was obtained at ACME Laboratory in Can- ada using the inductively coupled plasma mass spectro- metry (ICP-MS) method following a lithium metaborate/ tetraborate fusion and nitric acid digestion of a 0.2 g sample. Various standards were used and data quality as- surance was by running these standards between samples as unknowns.
4. Results
4.1. Textures and Ore Mineralogy
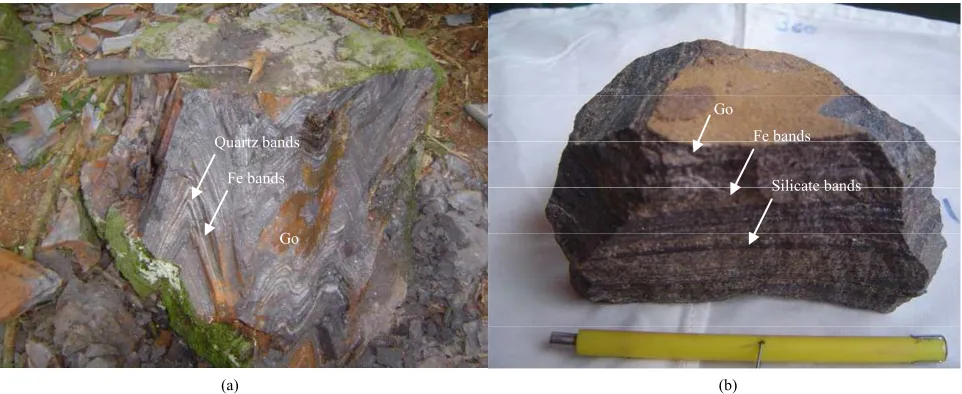
The Njweng protore is essentially an unenriched Banded Iron Formation (BIF) (Figures 4(a) and (b)). It is associ-
ated with spots of enriched martite-goethite mineraliza- tion. Most samples show good Fe oxide-quartz banding and some display microfolding (centimetric-scale) of me- sobands ranging in thickness from ~1 mm and rarely reaching 1 cm (Figure 4(a)). The iron formation covers a
The oxide facies BIF is composed of quartz as the main gangue mineral associated with various iron oxides, prin- cipally martite, goethite and magnetite (Figures 4(a) and 5(a)). Minor phases present include monazite, apatite,
rare pyrite and pyrrhotite. This BIF facies has an almost homogeneous mineral composition, withlittle textural va- riations that permit their differentiation into various sub- types, including granular and massive, specularite (slaty), granular, massive and weakly banded BIF (Figure 5). The
granular and massive type is composed of quartz bands and two ferruginous layers: one with magnetite grains in a brown massive martite matrix, and a second gray to brown massive bands. Both layers display very little quartz. The massive bands are composed of rhythmical gray massive bands and white to yellowish stained silica bands; the granular bands show white silica layers and brown granular ferruginous bands, while the specularite bands type display some white silica and grey shiny slen- der grains of specular hematite rich bands. A poor align- ment of xenomorphic martite, goethite and relict magnet- ite grains is discernable in the weakly banded sub-type BIF. In this facies, iron oxides are disseminated in a lar- gely siliceous matrix that makes up over 60% of the rock. Weathering in both the oxides and silica layers on this facies is similar.
4.1.1.1. Iron Oxide Layers
Two main types of iron oxide layers were discriminated within the BIF: the massive and the granular type bands. The massive iron oxide bands show a dense network of martite crystals interconnected by goethite with some magnetite relicts and rare quartz grains (Figure 5(b)).
The granular iron oxide bands show aggregates of coarse hexagonal and elongated crystals of martite with voids and pseudomorphic relicts of magnetite in the nuclei of large grains (Figure 5(c)). In general the bands are lo-
cally broken and disrupted (Figure 5(d)). Pores and in-
tergranular spaces are often filled by recrystallised quartz and goethite. The martite appears as xenomorphic to sub- euhedral grains with the trellis texture of the original magnetite, and magnetite relicts at the centre of crystals (Figures 5(c) and 6(a)). Euhedral to sub-euhedral hex-
agonal martite crystals pseudomorphed after magnetite are frequent in polished thin sections. A zoning transfor- mation also occurs with magnetite being transformed into goethite by hydration, and subsequently into martite by dehydration (Figure 5(c)). Martite and specular hematite
Go Fe bands Quartz bands
Silicate bands Fe bands
(a) (b)
Figure 4. (a) Intensely folded oxide facies BIF with alternative silica and iron banding, stained by goethite (Go). (b) Banded silicate facies BIF sample with some goethite coating.
Magnetite preferentially forms thin horizontal bands to- wards the centre of the iron-rich layers, and also appears as relicts at the centre of some martite crystals in the boundary of the band (Figure 6(c)). These skeletal relicts
of the original magnetite grains and the xenomorphic shape of martite are widespread in thin sections (Figure 5) and show the advanced state of weathering in the iron
bands. Goethite appears either as small isolated sub-euhe- dral crystals or xenomorphic blasted shapes. Overgrowths of goethite over paragenetically older martite and hema- tite are widespread at the boundary of some martite crys- tals (Figure 6(d)). They fill intergranular spaces between
the martite grains, or in the porous areas at the centre of martite. This texture is locally associated to coarse bla- ded specular hematite.
4.1.1.2. Siliceous Layers
The siliceous layers are essentially composed of quartz with disseminated euhedral or xenomorphic blasted shape martite grains and elongated small needle-like crystals of specularite hematite in a very rich quartz matrix. The martite crystals are porous marking quartz dissolution. Quartz grains are equigranular and granoblastic-polygo- nal with intergranular triple junctions that suggest static recrystallization (Figure 6(b)). Bladed quartz grains are
closely associated to magnetite crystals. The intergranu- lar space is filled by goethite and martite, with xenomor- phic shapes. The martite observed here is similar to that present in iron rich bands, with apatite and monazite grains linked to quartz and magnetite, respectively.
4.1.2. Silicate Facies BIF
The silicate facies (amphibolitic facies) at outcrop level is commonly characterized by abundant brown goethite pseudomorphs after silicate minerals (amphiboles) (Fig-
ure 4(b)). The bands present similar textures as above, in
addition to the alternating white to yellowish silica bands and light green to dark massive iron oxides bands. The common minerals that accompany the silicate in reflected light microscopy are martite, magnetite, goethite, and quartz (Figure 5(f)). In general, the weathering process
that affected iron oxides in the various BIF facies is similar. They show variably hematitized magnetite (mar- titization), plus goethite weathering. The hematitization of magnetite may be incipient or nearly complete with only very tiny relicts of magnetite (Figures 5(c), 6(a) and (c)). The weathering affects preferentially the magnetite
component. The BIF type shows alternating silica and laminae of martite/hematite layers, respectively ranging from 0.41 mm to 1 mm and from 0.51 mm to 0.88 mm for microbands with both sharp and gradational contacts. These layering are sometimes sandwiched by a thin goe- thite veneer (Figure 5(a)). Some iron oxide bands are
porous, probably due to leaching of silica inclusions. A thin limonitic coating interstitial to the goethite grains is observed. No polished section of the enriched martite- goethite mineralization was done.
4.2. Iron Ore Microscopy
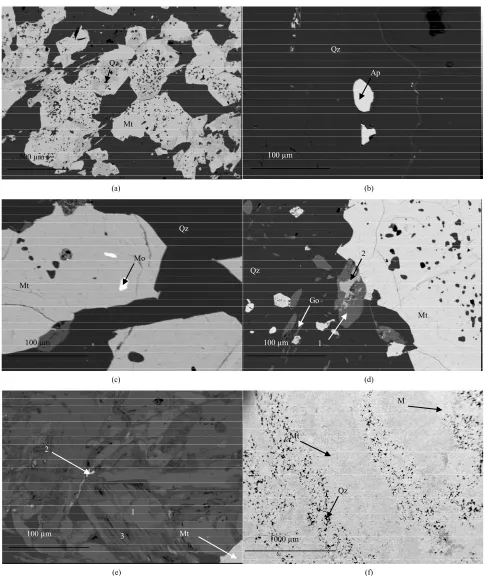
Detailed microscopic observation of the oxide facies BIF layers showed granoblastic and porphyroblastic magnet- ite crystals with poikilitic texture and numerous quartz inclusions (Figure 7(a)). In addition to this, inclusions of
apatite and monazite (Figures 7(b) and (c)) are found in
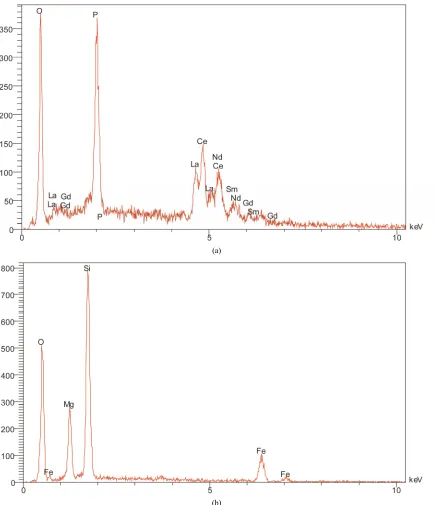
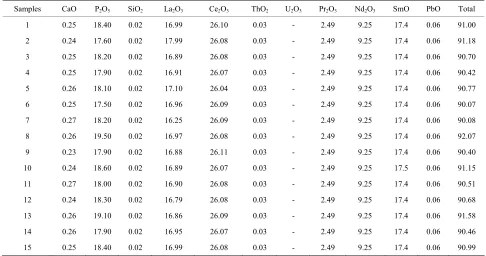
magnetite and quartz, respectively. These represent the main phases bearing REEs. The energy dispersive pattern in the identified monazite shows that it is REE-rich (Fi- gure 8(a) and Table 1).
[image:6.595.58.539.84.281.2]0.381 mm
Mt
M
Go
0.381 mm
M Mt
(a) (b)
0.095 mm
Mt
Go
M
0.357 mm
He
(c) (d)
0.381 mm
Go
He
0.178 mm
Po M
Mt
Am
[image:7.595.57.540.82.650.2](e) (f)
0.095 mm
Mt M
Qz
0.381 mm M
(a) (b)
0.357 mm
Go
M
0.381 mm
Mt
M
Qz
[image:8.595.59.542.85.464.2](c) (d)
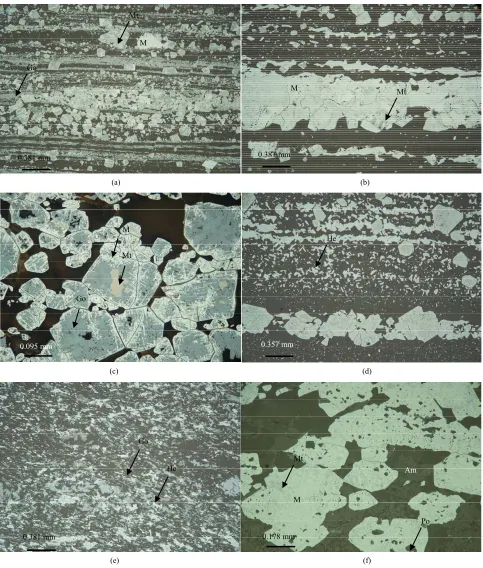
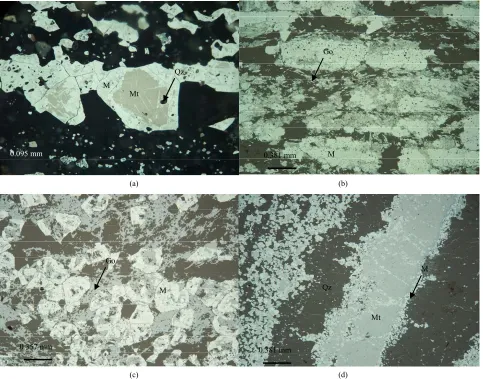
Figure 6. Oil (a) and air (b)-(d) immersion reflected-light photomicrographs of Njweng Itabirite. (a) Relicts of magnetite at centre of martite crystals with trellis texture, quartz (Qz) inclusions, and intergranular space filled by goethite; (b) Mesh of needle-like coarse bladed specularite surrounding the martite crystal; (c) Overgrowth blasted shape goethite (Go) over par- agenetically older martite (M); (d) Magnetite (Mt) bands preferentially forms towards the centre of the iron-rich layers.
sents evidence of their transformation into phosphates and Fe-bearing silicate, respectively (Figures 7(d) and (e)). The silicate minerals have magnetite of inclusions
(Figure 7(e)) indicating that the original mineral was co-
eval with magnetite precipitation. These silicates are Fe- Mg amphibole of the grunerite-cummingstonite series (Table 2). The energy dispersive pattern showed that, the
silicate phase is Si, Mg and Fe dominant (Figure 8(a)
and Table 3). Detailed microprobe data of the silicate
phase and monazite are found in Table 2. The silicates
might be alteration products after evaporites initially pre- sent in the system.
The enriched martite-goethite mineralization, on its own, is very porous and composed of martite and goe- thite with some silica remnants and voids. The minerali- zation consists of relict thin bands of martite and goethite separated from rows of voids due to the leaching of silica (Figure 7(f)).
4.3. Rare Earth Elements Geochemistry
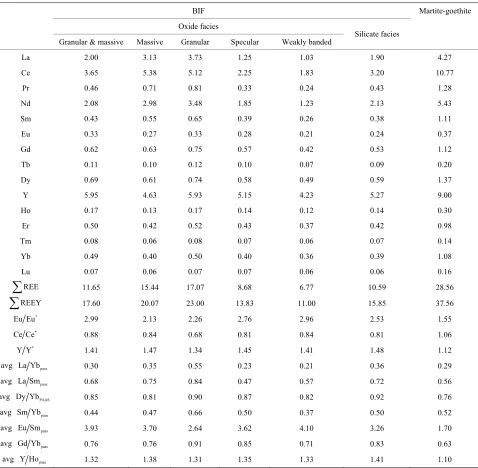
The REEY contents of oxide silicate facies BIF and that of the martite-goethite from Njweng in the Mbalam iron ore district are listed in Table 3 and presented in shale-
normalized diagrams using the Post-Archaean Australian Shale (PAAS) [33] (Figure 9). These data show low
REE 6 24
but which clearly increases with the in- crease in abundance of La, Nd, and Ce in BIFs and in the martite-goethite samples.4.3.1. Oxide Facies BIF
The REE patterns of oxide facies BIF are separated ac- cording to textural varieties as mentioned above. From
Table 3, it appears that, La, Ce, and Nd are the most
Ap Qz
100 µm
Mt Qz
500 µm
(a) (b)
2
1
Mt
Qz
Go
100 µm
Mt
Qz
Mo
100 µm
(c) (d)
1
3 Mt 100 µm
2
Qz
M
Mt
1000 µm
(e) (f)
[image:9.595.55.542.80.656.2](a)
(b)
Figure 8. (a) Energy dispersive (EDS) pattern depicting the composition of the monazite as being Ce-La rich; (b) EDS of the silicate phase showing Si Mg and Fe dominant.
granular and the massive bands to be richer in as compared to the other textural varieties of the oxide facies BIF. All the samples exhibit a decrease in concentration from the LREE to HREE (
REE
PAAS = 0.33) and a depletion of middle REE relatively to heavy HREE (average
average La Yb
PAAS
Yb
Dy ranges from 0.81 to 0.90). This de- pletion occurs in the light rare earth elements group (av- erage PAAS ranges from 0.47 to 0.84), as well as in the HREE group (average
La
= 0.85). All the tex-
tural varieties depict strong positive Eu anomalies ranging from 2.13 to 2.99 (average Eu Eu* = 2.62), and moderate
positive Y anomalies (average Y Y* = 1.42). Ce anomaly
is negative and ranges from 0.68 to 0.88 (average Ce Ce*
= 0.81). It is worth noting that, positive Eu and negative Ce anomalies are more pronounced in the granular and massive as well as in the weakly banded BIF of the oxide facies at Njweng as observed in Table 3, highlighting the
complex behaviour of these two elements in the series.
Sm
PAAS
[image:10.595.81.515.83.588.2]Table 1. Representative microprobe data of monazite from BIF sample of the Njweng define a simple arm.
Samples CaO P2O5 SiO2 La2O3 Ce2O3 ThO2 U2O3 Pr2O3 Nd2O3 SmO PbO Total
1 0.25 18.40 0.02 16.99 26.10 0.03 - 2.49 9.25 17.4 0.06 91.00
2 0.24 17.60 0.02 17.99 26.08 0.03 - 2.49 9.25 17.4 0.06 91.18
3 0.25 18.20 0.02 16.89 26.08 0.03 - 2.49 9.25 17.4 0.06 90.70
4 0.25 17.90 0.02 16.91 26.07 0.03 - 2.49 9.25 17.4 0.06 90.42
5 0.26 18.10 0.02 17.10 26.04 0.03 - 2.49 9.25 17.4 0.06 90.77
6 0.25 17.50 0.02 16.96 26.09 0.03 - 2.49 9.25 17.4 0.06 90.07
7 0.27 18.20 0.02 16.25 26.09 0.03 - 2.49 9.25 17.4 0.06 90.08
8 0.26 19.50 0.02 16.97 26.08 0.03 - 2.49 9.25 17.4 0.06 92.07
9 0.23 17.90 0.02 16.88 26.11 0.03 - 2.49 9.25 17.4 0.06 90.40
10 0.24 18.60 0.02 16.89 26.07 0.03 - 2.49 9.25 17.5 0.06 91.15
11 0.27 18.00 0.02 16.90 26.08 0.03 - 2.49 9.25 17.4 0.06 90.51
12 0.24 18.30 0.02 16.79 26.08 0.03 - 2.49 9.25 17.4 0.06 90.68
13 0.26 19.10 0.02 16.86 26.09 0.03 - 2.49 9.25 17.4 0.06 91.58
14 0.26 17.90 0.02 16.95 26.07 0.03 - 2.49 9.25 17.4 0.06 90.46
[image:11.595.56.540.385.496.2]15 0.25 18.40 0.02 16.99 26.08 0.03 - 2.49 9.25 17.4 0.06 90.99
Table 2. Representative microprobe data for Mg-Fe silica phase in Wt% oxides for the Njweng ridge.
Analyses Na2O MgO Al2O3 SiO2 FeO P2O5 K2O CaO Total
1 0.01 18.03 0.01 57.41 23.45 - 0.01 0.67 99.59
2 0.02 18.14 0.02 55.99 23.25 0.03 - 0.88 98.33
3 0.01 17.98 0.01 55.76 23.51 0.03 - 0.69 97.99
4 0.01 17.91 0.01 57.40 23.52 0.02 0.01 0.67 99.55
5 0.02 18.11 0.01 56.01 23.55 0.03 0.01 0.89 98.63
6 0.03 17.94 0.01 55.77 23.51 0.03 0.01 0.70 98.00
4.3.2. Silicate Facies BIF
REE
REEREE
REE
REE
contents in both the oxide facies (
= 11.92 ppm average) and silicate facies ( =10.59 ppm average) of BIF from the Njweng prospect are al-most similar, (the is rather seen in Table 3).There is no clear-cut relationship between and the facies of iron formation. All the samples exhibit a decrease in concentration from the LREE to HREE (av- erage PAAS= 0.36) and a depletion of middle REE relatively to heavy HREE (average
La Yb
PAAS ranges from 0.92, slightly above that of oxide facies BIFs aver- age 0.85). REE patterns in this facies depict positive Eu (
Dy Yb
*
Eu
Eu = 2.53) and YPAAS (Y Y* = 1.48) anoma- lies, slightly below and above that of the oxide facies respectively, while the Ce values (Ce Ce*
REE
= 0.81) are similar.
contents in the martite-goethite (~28.56 ppm average) are greater than those of BIF facies (~11.25 ppm average) and depict positive Eu (Eu Eu* = 1.55),
Ce (Ce Ce* = 1.06), and Y Y Y*
PASS ( = 1.12) anoma- lies (Table 3 and Figure 9). REE contents in the granular
and the massive bands of the oxide facies BIF are those of the structural facies that approach the martite goethite value with 15.44 ppm and 17.07 ppm respectively. The Ce enrichment in the ore is unique and contrasting with its depletion in the two BIFs facies.
5. Discussion
5.1. Textural and Mineralogical Changes
Granular & massive Massive Granular Specular Weakly banded Silicate facies
La 2.00 3.13 3.73 1.25 1.03 1.90 4.27
Ce 3.65 5.38 5.12 2.25 1.83 3.20 10.77
Pr 0.46 0.71 0.81 0.33 0.24 0.43 1.28
Nd 2.08 2.98 3.48 1.85 1.23 2.13 5.43
Sm 0.43 0.55 0.65 0.39 0.26 0.38 1.11
Eu 0.33 0.27 0.33 0.28 0.21 0.24 0.37
Gd 0.62 0.63 0.75 0.57 0.42 0.53 1.12
Tb 0.11 0.10 0.12 0.10 0.07 0.09 0.20
Dy 0.69 0.61 0.74 0.58 0.49 0.59 1.37
Y 5.95 4.63 5.93 5.15 4.23 5.27 9.00
Ho 0.17 0.13 0.17 0.14 0.12 0.14 0.30
Er 0.50 0.42 0.52 0.43 0.37 0.42 0.98
Tm 0.08 0.06 0.08 0.07 0.06 0.07 0.14
Yb 0.49 0.40 0.50 0.40 0.36 0.39 1.08
Lu 0.07 0.06 0.07 0.07 0.06 0.06 0.16
REE
REEY
11.65 15.44 17.07 8.68 6.77 10.59 28.56
17.60 20.07 23.00 13.83 11.00 15.85 37.56
*
Eu Eu 2.99 2.13 2.26 2.76 2.96 2.53 1.55
*
Ce Ce 0.88 0.84 0.68 0.81 0.84 0.81 1.06
*
Y Y 1.41 1.47 1.34 1.45 1.41 1.48 1.12
avg La Ybpass 0.30 0.35 0.55 0.23 0.21 0.36 0.29
avg La Smpaas 0.68 0.75 0.84 0.47 0.57 0.72 0.56
avg Dy YbPAAS 0.85 0.81 0.90 0.87 0.82 0.92 0.76
avg Sm Ybpaas 0.44 0.47 0.66 0.50 0.37 0.50 0.52
avg Eu Smpaas 3.93 3.70 2.64 3.62 4.10 3.26 1.70
avg Gd Ybpaas 0.76 0.76 0.91 0.85 0.71 0.83 0.63
avg Y Hopaas 1.32 1.38 1.31 1.35 1.33 1.41 1.10
which created the sedimentary structures [36]. This com- positional banding has been interpreted as representing the original sedimentary features [37]. In Mbalam, it has been considered as the only preserved sedimentary fea- ture in the itabirite [38]. The itabirite facies are generally considered to be protore of high grade iron ore [21].
The processes of upgrading BIF to iron ore have re- mained contentious despite the recent progress made to elucidate them [21,39-42] due to the search for proof in identifying the processes responsible for the increase of iron in the ore. Banding relicts in the martite-goethite with microsagging structures indicative of compaction is
a strong indicator of the supergene weathering that per- mits to obtain high grade mineralization [21,43]. Thus this fact points to supergene enriched mineralization in the study area. Similar interpretations of bedded martite- goethite ore bodies in the Hamersley province resulting from the supergene alteration of precursor BIF have been noted [44].
5.2. Changes in Mineral Assemblages
[image:12.595.59.537.110.578.2]Figure 9. Average (Av) values of BIF facies, Enriched martite goethite mineralization, and modern seawater REE normalized against the Post-Archean Australian Shale. BIFs and enriched martite-goethite are plods in ppm while modern seawater is plotted in (pmol/kg).
quartz, monazite and apatite inclusions. Quartz inclu- sions are commonly subhedral suggesting that these BIFs have been metamorphosed and their shape is a product of post-depositional recrystallization [45]. The ubiquitous presence of quartz in magnetite has significance with regards to the development of layering in the BIF. It is here suggested that the BIF was initially essentially cherty with dispersed Fe that aggregated and grew into large crystals during diagenesis [45].
Regardless of the iron oxides sequence in banding, it clearly appears that magnetite is an early oxide phase in the alteration paragenesis. Reflected light photomicro- graphs of BIF and enriched martite-goethite mineraliza- tion show abundant euhedral crystals (octahedral and/or dodecahedral crystals). This crystal habit is very common for magnetite, and suggests that the hematite is pseudo- morph after magnetite, an occurrence referred to as “mar- tite” [46]. This observation indicates that all the BIF samples in this study have undergone considerable sec- ondary oxidation and supergene enrichment. It can then be concluded on the basis of detailed microscopic obser- vations of our samples that magnetite is the primary ox- ide, and hematite is the result of supergene processes of the magnetite alteration. Two paragenetic sequences are observed here: the first and dominant process is the direct transformation from the primary magnetite to martite by oxidation (Figure 6(a)). Such zoning was observed in
previous studies and was considered as the result of chemical weathering [47]. In the second par agenetic se-
quence, the magnetite is first transformed into goethite by hydration then into martite by dehydration (Figure 5(c))
the Njweng ridge (Table 3) are characterized by a low
, a strong depletion in LREE relatively compared to HREE (Figure 9). Iron formations display LREE de-
pletion pattern similar to that of modern deep-marine water with no terrigenous input [12]. A similar trend is observed between the average Njweng BIFs and lime- stone, with depletion of LREE relatively to HREE. This HREE enrichment is a feature of modern seawater [55,56] (Figures 9 and 10), and spider diagrams for the average
pacific seawater confirm this fact (Figure 9). If we cast
our gaze even further back, it would appear that HREE enrichment has been a feature of seawater since at least the late Archaean [57,58] and it corroborates with the spi- der diagram of BIF and enriched martite-goethite. Al- though far more subtle, but possibly significant changes to HREE fractionation cannot be ruled out [6]. It has been suggested that, the small ionic radii of these ele- ments result in stronger complexes which tend to stabi- lize them in solution giving them a stronger complexa- tion [59,60]. Their stronger inorganic complexation makes them to be more stabilized in solution, which is why they are more abundant in seawater compared to the marine clastic sediments. The overall shape of REE pattern is si- milar to that of limestone [23,24] considered as being proxy material of modern seawater (Figure 10). Minera-
logical changes could in addition increase the REE abun- dance during weathering. The release of some elements in REE-rich minerals such as monazite and apatite that have been identified in some samples (Figure 7) may be
as apatite, and xenotime [61,62]. As such, their high abun- dance in some samples would raise difficulties in sam-pling for the REE in order to determine the origin of the BIF from these elements. REE contents of BIF are low when compared to the enriched martite-goethite suggest- ing an enrichment of these elements with phase trans- formations. The positive Ce anomaly obtained in the mar- tite-goethite also supports this fact (Figure 9).
REE
[image:14.595.123.475.497.700.2]5.4. Europium Anomalies
Figure 10 depicts positive Eu anomalies in both Njweng
BIF facies and enriched martite-goethite as well as in limestone. The presence of a positive Eu anomaly in many Archean and Proterozoic iron-formation REE pat- terns was suggested to be the result of the input from sub- oceanic hydrothermal solutions from deep-sea spreading centres into ocean waters (which are considered as the source of the iron as well as of SiO2 of the iron-forma- tions) [63-65]. The positive Eu anomalies also indicate the reducing conditions prevailing during the deposition of this formation. It has been shown that, reduction of Eu does not seem to occur within the ocean basins except by hydrothermal systems [66,67]. The Eu anomaly in both BIF facies and enriched martite-goethite mineralization might thus indicate an input of strongly reducing hydro- thermal solutions into the water from which the BIF pre- cipitated as demonstrated in other areas [6,13,62,68,]. The strong positive Eu anomalies in the BlFs may only result
from an input of Eu-enriched hydrothermal fluids into the water column [12,13,68-70]. The disparate behaviour of Eu from neighbouring REEs under hydrothermal con- ditions is attributed to the reduction of Eu (III) under high temperature (250˚C) and low Eh conditions [71]. Based on REEY anomalies obtained from Njweng sam- ples, it is suggested that the BIF was formed by precipi- tation and deposition from mixed Precambrian seawater and hydrothermal fluids.
When compared with the study area BIF and enriched martite-goethite mineralization, modern seawater spider diagram (Figure 9) does not typically display Eu anom-
aly. The absence of Eu anomaly is a feature of modern seawater, except in near hydrothermal vents [55,56]. The Eh for this system decreases with increasing pH, but will always be well above the redox potential for the stability of divalent Eu. Thus, Eu2+ cannot exist in the depositio- nal environment where the iron-formations were depos- ited. Thus Eu in iron-formations may not have been frac- tionated on the grounds of redox conditions from the other REE. Therefore, Eu anomalies in iron-formations may not give any indication of the composition of the atmos- phere during the Precambrian.
5.5. Yttrium Anomalies
In addition, Y is an element generally found in fluid-re- lated alkaline volcanic rocks, and the positive Y anomaly apart from the Eu anomaly may suggest a volcanic input [72]. The Y anomaly observed is due to Y/Ho fractiona- tion that occurs when REE are transported as aqueous complexes. This characteristic is observed in plotted mo- dern seawater data and limestone (Figures 9 and 10) that
were respectively considered as indicators of modern and ancient seawater.
5.6. Cerium Anomalies
Figure 9 displays negative Ce anomalies for the Njweng
BIF, limestone, and modern seawater. The interpretation of Ce anomalies in BIFs is made difficult by the complex redox behaviour of Ce. As observed at Njweng, the pre- sence of negative Ce anomalies in BIF samples is well established [12,62,73-76]. This implies oxidation and se- gregation of Ce as Ce(IV). Negative Ce anomalies are suggested to be good evidence of the influence of sea- water with a REE pattern similar to modern seawater [56, 77]. It has long been suggested that the negative Ce ano- maly in seawater reflects the oxidation of Ce3+ to much more insoluble Ce4+ [78,79]. This oxidation generally takes place under some specific pH and Eh conditions (pH = 8, Eh = 0.15 − 0.45 volt) [66] and is a common result of weathering. Recent works on negative Ce ano- maly suggested microbial and abiotic origins for this ele- ment [62,80-82]. The range of Ce anomalies observed in
BIFs may result from variable mixing and oxidation pro- cesses on an ocean wide scale, or perhaps mostly local processes, including diagenetic recycling as noted in other areas [83,84]. Ce anomalies in iron formations can also arise from analytical artefacts and diagenetic altera- tion. Therefore, it might reflect metamorphic or recent weathering-related redistribution of REEs between me- tamorphic minerals and compositionally different layers or between the soil horizon and bedrock [85,86].
The enriched martite-goethite mineralization shows a positive Ce anomaly, contrasting with the negative Ce anomaly observed in the BIF at Njweng. This difference could derive from enrichment in REE minerals during weathering, which resulted in enrichment of all the REEs (Figure 9). Monazite alteration in BIF samples increases
Ce in enriched martite-goethite, producing a positive ano- maly [61,62]. However, for the reasons given above, the lack of such anomalies in an iron formation does not ne- cessarily imply that seawater was not depleted in Ce.
It is known that, the modern oceans receive most of their REEs from three sources: the dissolved loads of rivers [87,88], hydrothermal alteration of the oceanic crust [89], and sediments undergoing diagenesis. More- over, iron formation REE are chemical precipitated frac- tion related to the REE of the iron source materials, that of the seawater and both [90]. It’s therefore evident to consider that REE in BIF may not be considered as proxy material of seawater. In addition to this, changes by en- richment or depletion during weathering and metamor- phism are also to be considered. This leads to the conclu- sion that the REE pattern of an iron formation does not appear to be a useful indicator of the REE pattern of sea- water of the same age [90]. Based on this river loads ar- guments, it becomes reasonable to expect the REE pat- tern of Archean “seawater” to be different from that of modern seawater since there is no evidence of their pre- cipitation from a solution dominated by seawater of the same age [90].
6. Conclusions
companied by widespread oxidation, indicate the removal of silica by direct leaching and the formation of the en- riched martite-goethite mineralization.
The Eu anomaly observed are the results of inputs from strongly reducing sub-oceanic hydrothermal solutions from deep-sea spreading centres into ocean waters, as well as a higher heat flow in the oceanic crust during the Archaean. In addition to this anomaly, the positive Y ano- maly combined with that of Eu, and the Y/Ho ratio ob- tained, point to volcanic input in the BIF formation, and REE transportation by aqueous complexes. The LREE depletion, HREE enrichment and positive Eu anomaly showed that, BIFs were formed by precipitation and de- position from mixed Precambrian seawater and hydro- thermal fluids of late Archean to early Proterozoic age. The negative Ce anomalies are due to increasing Ce, re- sulting from microbial and abiotic processes, and attests to the strongly oxidizing conditions in the marine envi- ronment. Positive Ce anomalies in the martite-goethite derived from enrichment in REE minerals during weath- ering. This complex behaviour of Ce does not allow Ce to be considered as indicative of seawater conditions. The change in REE abundance derived from change in seawater composition, various diagenetic or progressive alterations of REE contents with increasing geological time and also reflects the existence of REE-rich minerals such as monazite and apatite.
7. Acknowledgements
This paper is an integral part of the senior author’s Ph.D thesis at the University of Yaounde I, Cameroon. We gratefully acknowledge the Cameroon Iron Ore (CamI- ron) for their logistic support and their permission to work within their permit area. The analytical part of the study was possible thanks to the internship placement offered by CamIron and the facilities of the Mineral Re- sources Institute (MRI) of the Technical University of Clausthal in Germany through Prof. Bernd Lehmann. This thesis is part of the collaboration between the Uni- versity of Buea and the MRI (Iron ore deposits in the Precambrian mineral belt of Cameroon) funded by the Alexander von Humboldt Foundation (AvH) and the support from them is gratefully acknowledged.
REFERENCES
[1] M. Bau, “Scavenging of Dissolved Yttrium and Rare Earths by Precipitating Iron Oxyhydroxide: Experimental Evidence for Ce, Y-Ho Fractionation, and Lanthanide
Water of the Urban Area Berlin, Germany,” Chemie der Erde, Vol. 65, No. 2, 2005, pp. 167-189.
doi:10.1016/j.chemer.2004.08.004
[3] T. Akagi, F. F. Fu and S. Yabuki, “Absence of Ce Anom- aly in the REE Patterns of Peat Moss and Peat Grass in the Ozegahara Peatland,” Geochemical Journal, Vol. 36, No. 2, 2002, pp. 113-118. doi:10.2343/geochemj.36.113 [4] E. D. Goldberg, M. Koide and R. H. Schmitt, “Rare Earth
Distributions in Marine Environment,” Journal of Geo-physical Research, Vol. 68, 1963, pp. 4209-4217. doi:10.1029/JZ068i014p04209
[5] D. Z. Piper, “Rare Earth Elements in the Sedimentary Cycle: A Summary,” Chemical Geology, Vol. 14, No. 4, 1974, pp. 285-343. doi:10.1016/0009-2541(74)90066-7 [6] M. Bau and P. Möller, “Rare Earth Element Systematics
of the Chemically Precipitated Component in Early Pre- cambrian Iron-Formations and the Evolution of the Ter- restrial Atmosphere-Hydrosphere-Lithosphere System,” Geochimica et CosmochimicaActa, Vol. 57, No. 10, 1993, pp. 2239-2249. doi:10.1016/0016-7037(93)90566-F [7] R. Bolhar, A. Hofmann, J. Woodhead, J. Hergt and P.
Dirks. “Pb- and Nd Isotope Systematics of Stromatolitic Limestones from the 2.7 Ga Ngezi Group of the Belingwe Greenstone Belt: Constraints on Timing of Deposition and Provenance,” Precambrian Research, Vol. 114, No. 3-4, 2002, pp. 277-294.
doi:10.1016/S0301-9268(01)00229-7
[8] R. Bolhar, B. S. Kamber, S. Moorbath, C. M. Fedo and M. J. Whitehouse, “Characterisation of Early Archaean Che- mical Sediments by Trace Element Signatures,” Earth and Planetary Science Letters, Vol. 222, No. 1, 2004, pp. 43-60. doi:10.1016/j.epsl.2004.02.016
[9] G. A. Shields and G. R. Webb, “Has the REE Composi- tion of Seawater Changed over Geological Time?” Che- mical Geology, Vol. 204, No. 1-2, 2004, pp. 103-107. doi:10.1016/j.chemgeo.2003.09.010
[10] M. J. Van Kranendonk, G. E. Webb and B. S. Kamber, “New Geological and Trace Element Evidence from 3.45 Ga Stromatolitic Carbonates in the Pilbara Craton: Sup- port of a Marine, Biogenic Origin and for a Reducing Ar- chaean Ocean,” Geobiology, Vol. 1, No. 2, 2003, pp. 91- 108. doi:10.1046/j.1472-4669.2003.00014.x
[11] G. E. Webb and B. S. Kamber, “Rare Earth Elements in Holocene Reefal Microbialites: A New Shallow Seawater Proxy,” Geochimica et CosmochimicaActa, Vol. 64, No. 9, 2000, pp.1557-1565.
[12] C. Klein and N. J. Beukes, “Geochemistry and Sedimen- tology of a Facies Transition from Limestone to Iron-For- mation Deposition in the Early Proterozoic Transvaal Supergroup, South Africa.” Economic Geology, Vol. 84, No. 7, 1989, pp. 1733-1774.
doi:10.2113/gsecongeo.84.7.1733
tion of Precambrian Seawater—Evidence from REEs in Banded Iron Formations,” Geochimica et Cosmochimica Acta, Vol. 54, No. 11, 1990, pp. 2965-2977.
doi:10.1016/0016-7037(90)90114-Z
[14] M. Bau and, P. Dulski, “Distribution of Yttrium and Rare-Earth Elements in the Penge and Kuruman Iron- Formations, Transvaal Supergroup, South Africa,” Pre- cambrian Research, Vol. 79, No. 1, 1996, pp. 37-55. doi:10.1016/0301-9268(95)00087-9
[15] R. Frei, P. S. Dahl, E. F. Duke, K. M. Frei, T. R. Hansen, M. M. Frandsson and L. S. Jensen, “Trace Element and Isotopic Characterization of Neoarchean and Paleopro- terozoic Iron Formations in the Black Hills (South Dakota, USA): Assessment of Chemical Change During 2.9 - 1.9 Ga Deposition Bracketing the 2.4 - 2.2 Ga First Rise of Atmospheric Oxygen,” Precambrian Research, Vol. 162, No. 3-4, 2008, pp. 441-474.
doi:10.1016/j.precamres.2007.10.005
[16] A. Bekker, J. F. Slack, N. Planavsky, B. Krapež, A. Hof- mann, K. O. Konhauser and O. J. Rouxel, “Iron Forma- tion: The Sedimentary Product of a Complex Interplay Among Mantle, Tectonic, Oceanic and Biospheric Proc- esses,” Economic Geology, Vol. 105, No. 3, 2010, pp. 467-508. doi:10.2113/gsecongeo.105.3.467
[17] Y. Kato, I. Ohta, T. Tsunematsu, Y. Watanabe, Y. Isozaki, S. Maruyama and N. Imai, “Rare Earth Elements Varia- tions in Mid-Achean Banded Iron Formations: Implica- tions for the Chemistry of Ocean and Plate Tectonics,” Geochimica et Cosmochimica Acta, Vol. 62, No. 21-22, 1998, pp. 3475-3496.
doi:10.1016/S0016-7037(98)00253-1
[18] J. Dymond, J. B. Corliss, G. R. Heath, C. W. Field, E. J. Dasch and H. H. Vieh, “Origin of Metalliferous Sedi- ments from the Pacific Ocean,” Geological Society of America Bulletin, Vol. 84, No. 10, 1973, pp. 3355-3372. doi:10.1130/0016-7606(1973)84<3355:OOMSFT>2.0.C O;2
[19] R. M. Sherrell, M. P. Field and G. Ravizza, “Uptake and Fractionation of Rare Earth Elements on Hydrothermal Plume Particles at 9˚45'N, East Pacific Rise,” Geochimica et Cosmochimica Acta, Vol. 63, No. 11-12, 1999, pp. 1709-1722. doi:10.1016/S0016-7037(99)00182-9
[20] G. B. Morey, “High-Grade Iron Ore Deposits of the Me- sabi Range, Minnesota: Products of a Continental-Scale Proterozoic Ground-Water Flow System,” Economic Ge- ology, Vol. 94, No. 1, 1999, pp. 133-142.
doi:10.2113/gsecongeo.94.1.133
[21] D. Taylor, H. J. Dalstra, A. E. Harding, G. C. Broadbent, and M. E. Barley, “Genesis of High-Grade Hematite Ore Bodies of the Hamersley Province, Western Australia,” Economic Geology, Vol. 96, No. 4, 2001, pp. 837-873. [22] J. Zhang and Y. Nozaki, “Rare Earth Elements and Yt-
trium in Seawater: ICP-MS Determinations in the East Caroline, Coral Sea, and South Fiji Basins of the Western South Pacific Ocean,” Geochemica et Cosmochimica Acta, Vol. 60, No. 23, 1996, pp. 4631-4644.
doi:10.1016/S0016-7037(96)00276-1
[23] B. Jacobsens and M. R. Pimentel-Klose, “A Nd Isotopic Study of the Hamersley and Michipicoten Banded Iron
Formations: The Source of REE and Fe in Archean oceans,” Earth and Planetary Science Letters, Vol. 87, No. 1-2, 1988, pp. 29-44.
doi:10.1016/0012-821X(88)90062-3
[24] B. Jacobsens and M. R. Pimentel-Klose, “Nd Isotopic Variations in Precambrian Banded Iron Formations,” Geophysical Research Letters, Vol. 15, No. 4, 1988, pp. 393-396. doi:10.1029/GL015i004p00393
[25] S. F. Toteu, J. Penaye and Y. P. Djomani, “Geodymanic Evolution of the Pan-African Belt in Central Africa with Special Reference to Cameroon,” Canadian Journal of Earth Sciences,Vol. 41, No. 1, 2004, pp. 73-85.
doi:10.1139/e03-079
[26] H. Mvondo, S. Owona, J. Mvondo Ondoa and J. Essono, “Tectonic Evolution of the Yaounde Segment of the Neo- proterozoic Central African Orogenic Belt in Southern Cameroon,” Canadian Journal of Earth Sciences, Vol. 44, No. 4, 2007, pp. 433-444. doi:10.1139/e06-107
[27] C. E. Suh, A. R. Cabral and E. Ndime, “Geology and Ore Fabrics of the Nkout High-Grade Haematite Deposit, Southern Cameroon,” In: T. Angerer, S. Hagemann, C. A. Rosière, Eds., The Origin of Enriched Iron and Manga- nese Ore Deposits, Smart Science for Exploration and Mining, Townsville,2009,pp. 558-560.
[28] C. K. Shang, W. Siebel, M. Satir, F. Chen and J. O. Mvondo, “Zircon Pb-Pb and U-Pb Systematics of TTG Rocks in the Congo Craton: Constraints of Crustal For- mation, Crystallization and Pan-African Lead Loss,” Bul- letin Geosciences, Vol. 79, No. 4, 2004, pp. 205-219. [29] R. Tchameni, K. Mezger, N. E. Nsifa and A. Pouclet,
“Crustal Origin of Early Proterozoic Syenites in the Congo Craton (Ntem complex), South Cameroon,” Lithos, Vol. 57, No. 1, 2001, pp. 23-42.
doi:10.1016/S0024-4937(00)00072-4
[30] S. F. Toteu, W. R. Van Schmus, J. Penaye and J. B. Nyobe “U/Pb and Sm/Nd Evidence for Eburnean and Pan-African High-Grade Metamorphism in Cratonic Rocks of Southern Cameroon,” Precambrian Research, Vol. 67, No. 3-4, 1994, pp. 321-347.
doi:10.1016/0301-9268(94)90014-0
[31] M. Caen Vachette, Y. Vialette, J.-P. Bassot and P. Vidal, “Apport de la Géochronologie à la Connaissance de la Géologie Gabonaise,” Chronique de la Recherche Mi- nière, Vol. 491, 1988, pp. 35-54.
[32] Sundance Resources Limited. http://intranet/SitePages/Default.aspx
[33] S. R. Taylor and S. M. McLennan, “The Continental Crust: Its Composition and Evolution,” Blackwell, Ox- ford, 1985, p. 312.
[34] E. A. Gaucher, et al., “Palaeotemperature Trend for Pre- Cambrian Life Inferred from Resurrected Proteins,” Na- ture, Vol. 451, No. 7179, 2008, pp. 704-707.
doi:10.1038/nature06510
[35] F. Robert and M. Chaussidon, “A Paleotemperature Curve for the Precambrian Oceans Based on Silicon Iso-topes in Cherts,” Nature, Vol. 443, No. 7036, 2006, pp. 969-972. doi:10.1038/nature05239
of the Precambrian Hamersley Group, Western Austra- lia,” Geological Survey of Western Australia Bulletin,Vol. 119, 1970, pp. 1-366.
[38] J. M. Allen and M. P. Simpson, “Petrography of Meta- morphosed Banded Iron Formation and Associated Schists from the Mbarga Iron Deposit, Mbalam Project Area, Republic of Cameroon,” John Allen and Associates Ltd Report (Unpublished), 2008, p. 45.
[39] N. H. S. Olivier, J. S. Cleverley, G. M. Dipple and G. C. Broadbent, “Giant BIF Hosted Haematite Ores: Geo- chemical and Isotopic Modelling of Meteoric and Basinal Fluid-Rock Reactions,” Proceedings of Biennial Meeting of the Society for Geology Applied to Mineral Deposits, Dublin, 2007, pp. 1219-1222.
[40] A. D. Weeb, G. R. Dicksens and N. H. S. Oliver, “From Banded Iron-Formation to Iron Ore: Geochemical and Mineralogical Constraints from across the Hamersley Province, Western Australia,” Chemical Geology, Vol. 197, No. 1-4, 2003, pp. 215-251.
doi:10.1016/S0009-2541(02)00352-2
[41] W. S. Thorn, G. C. Hagemann and M. E. Barley, “Petro- graphic and Geochemical Evidence for Hydrothermal Evolution of the North Deposits, Mt. Tom Price, Western Australia,” Mineralium Deposita, Vol. 39, No. 7, 2004, pp. 766-783. doi:10.1007/s00126-004-0444-x
[42] R. C. Figueiredo e Silva, S. C. Hagemann, L. M. Lobato, and T. Venermann, “Iron Oxide Paragenesis Quartz Vein Chronology and Hydrothermal Fluid Evolution at the Gi- ant North Range Carajás Iron Deposits in Brazil,” Pro- ceedings of the 9th Biennial Meeting of the Society for Geology Applied to mineral Deposits, Dublin, 2007, pp. 1223-1226.
[43] R. C. Morris, “Genesis of Iron Ore in Banded Iron-For- mation by Supergene and Supergene Metamorphic Pro- cesses—A Conceptual Model,” In: K. H. Wolff, Ed., Handbook of Strata-Bound and Stratiform ore Deposits, Elsevier, Amsterdam, 1985. pp. 73-235.
[44] J. M. F. Clout, “Upgrading Processes in BIF-Derived Iron Ore Deposits—Implication for Ore Genesis and Down- stream Processing,” Proceedings of Iron Ore 2002 Con- ference, Perth, 9-11 September 2002, pp. 237-241. [45] C. Klein and Bricker, “Some Aspects of the Sedimentary
and Diagenetic Environment of Proterozoic Banded Iron- Formation,” Economic Geology, Vol. 72, No. 8, 1977, pp. 1457-1470. doi:10.2113/gsecongeo.72.8.1457
[46] C. Klein and E. A. Ladeira “Petrography and Geochemis- try of the Least Altered Banded Iron-Formation of the Ar- chean Carajás Formation, Northern Brazil,” Economic Geology, Vol. 97, No. 3, 2002, pp. 643-651.
[47] C. A. Rosiere, “Strukturelle und Texturelle Untersu- chungen in der Eisenerzlagerstaette ‘Pico de Itabira’, bei Itabirito, Minas Gerais,” Brasilien: Claustheler Geowis- senschaftliche Dissertationen, Vol. 9, 1981, p. 302. [48] R. C. Morris, “A Textural and Mineralogical Study of the
and Structural Characteristics of the Martitization Proc- ess,” American Journal of Science, Vol. 266, No. 6, 1968, pp. 482-496. doi:10.2475/ajs.266.6.482
[50] R. C. Morris, “Genetic Modelling for Banded Iron-For- mation of the Hamersley Group, Pilbara Craton, Western Australia,” Precambrian Research, Vol. 60, No. 1-4, 1993, pp. 243-286. doi:10.1016/0301-9268(93)90051-3 [51] A. Kappler, C Pasquero, K. O. Konhauser and D.K.
Newman, “Deposition of Banded Iron Formations by Anoxygenic Phototrophic Fe(II)-Oxidizing Bacteria,” Ge- ology, Vol. 33, No. 11, 2005, pp. 865-868.
doi:10.1130/G21658.1
[52] K. O. Konhauser, et al., “Decoupling Photochemical Fe(II) Oxidation from Shallow-Water BIF Deposition,” Earth and Planetary Science Letters, Vol. 258, No. 1-2, 2007, pp. 87-100. doi:10.1016/j.epsl.2007.03.026
[53] H. P. Eugster and I.-M. Chou, “The Depositional Envi- ronments of Precambrian Banded Iron-Formations,” Eco- nomic Geology, Vol. 68, No. 7, 1973, pp. 1144-1168. doi:10.2113/gsecongeo.68.7.1144
[54] P. S. Braterman, A. G. Cairns-Smith and R. W. Sloper, “Photooxidation of Hydrated Fe2++ Significance for Ban-
ded Iron Formations,” Nature, Vol. 303, No. 5913, 1983, pp. 163-164. doi:10.1038/303163a0
[55] H. Elderfield and M. J. Greaves, “The Rare Earth Ele- ments in Seawater,” Nature,Vol. 296, No. 5854, 1982, pp. 214-219. doi:10.1038/296214a0
[56] H. J. W. De Baar, M. P. Bacon, P. G. Brewer and K. W. Bruland, “Rare Earth Elements in the Pacific and Atlantic Oceans,” Geochimica et CosmochimicaActa, Vol. 49, No. 9, 1985, pp. 1943-1959.
doi:10.1016/0016-7037(85)90089-4
[57] M. Bau and P. Dulski, “Distribution of Yttrium and Rare- Earth Elements in the Penge and Kuruman Iron-Forma- tions, Transvaal Supergroup, South Africa,” Precambrian Research, Vol. 79, No. 1, 1996, pp. 37-55.
doi:10.1016/0301-9268(95)00087-9
[58] B. S. Kamber and G. E. Webb, “The Geochemistry of Late Archaean Microbial Carbonate: Implications for Ocean Chemistry and Continental Erosion History,” Geo- chimica et CosmochimicaActa, Vol. 65, No. 15, 2001, pp. 2509- 2525. doi:10.1016/S0016-7037(01)00613-5
[59] E. D. Goldberg, M. Koide, R. A. Schmitt and R. H. Smith, “Rare Earth Distributions in the Marine Environment,” Journal of Geophysical Research, Vol. 68, 1963, pp. 4209-4217. doi:10.1029/JZ068i014p04209
[60] D. R. Turner, M. Whitfield and A. G. Dickson, “The Equilibrium Speciation of Dissolved Components in Freshwater and Seawater at 25˚C and 1 atm Pressure,” Geochimica et CosmochimicaActa, Vol. 45, No. 6, 1981, pp. 855-881. doi:10.1016/0016-7037(81)90115-0
Iron-Formation: Facts and Problems, Elsevier, Amster- dam, 1983, pp. 513-534.
[62] J. L. Graf, “Rare Earth Elements, Iron Formations and Seawater,” Geochimica et CosmochimicaActa, Vol. 42, No. 12, 1978, pp. 1845-1850.
doi:10.1016/0016-7037(78)90239-9
[63] R. F. Dymek and C. Klein, “Chemistry, Petrology and Origin of Banded Iron-Formation Lithologies from the 3800 Ma Isua Supracrustal Belt,” West Greenland: Pre- cambrian Research, Vol. 39, No. 4, 1988, pp. 247-302. doi:10.1016/0301-9268(88)90022-8
[64] C. Klein and N. J. Beukes, “Time Distribution, Stratigra- phy, and Sedimentologic Setting, and Geochemistry of Precambrian Iron-Formation,” In: J. W. Schopf and C. Klein, Eds., The Proterozoic Biosphere: A multidiscipli- nary study,Cambridge University Press, New York, 1992, pp. 139-146.
[65] F. O. Raposo, E. A. Ladeira, “Petrologia de Formações Ferríferas e Itabiritos do Quadrilátero Ferrífero, Minas Gerais, Brasil,” 40thCongresso Brasileiro de Geologia,
Sociedade Brasileira de Geologia, Núcleo de Minas
Gerais, Belo Horizonte, 1998, p. 158.
[66] B. J. Fryer, “Rare Earth Elements in Iron-Formation,” In: A. F. Trendall and R. C. Morris, Eds., Iron-Formations: Facts and Problems, Elsevier, Amsterdam, 1983, pp. 345-358. doi:10.1016/S0166-2635(08)70048-3
[67] A. Michard, F. Albarede, G. Michard, J. F. Minster and J. L. Charlou, “Rare-Earth Elements and Uranium in High- Temperature Solutions from East Pacific Rise hydrother- mal Vent Field,” Nature, Vol. 303, 1983, pp. 795-797. doi:10.1038/303795a0
[68] A. Danielson, P. Moller and P. Dulski, “The Europium Anomalies in Banded Iron Formations and the Thermal History of the Oceanic-Crust,” Chemical Geology, Vol. 97, No. 1-2, 1992, pp. 89-100.
doi:10.1016/0009-2541(92)90137-T
[69] C. Alibert and M. T. McCulloch, “Rare Earth Element and Neodymium Isotopic Compositions of Banded Iron Formations and Associated Shales from Hamersley, Western Australia,” Geochimica et CosmochimicaActa, Vol. 57, No. 1, 1993, pp. 187-204.
doi:10.1016/0016-7037(93)90478-F
[70] J. F. Slack, T. Grenne, A. Bekker, O. J. Rouxel and P. A. Lindberg, “Suboxic Deep Seawater in the Late Paleopro- terozoic: Evidence from Hematitic Chert and Iron Forma- tion Related to Seafloor-Hydrothermal Sulfide Deposits, Central Arizona, USA,” Earth and Planetary Science Let- ters, Vol. 255, No. 1-2, 2007, pp. 243-256.
doi:10.1016/j.epsl.2006.12.018
[71] G. Klinkhammer, H. Elderfield and A. Hudson, “Rare- Earth Elements in Seawater Near Hydrothermal Vents,” Nature, Vol. 305, No. 5931, 1983, pp. 185-188.
doi:10.1038/305185a0
[72] J. L. Evans, “The Geology and Geochemistry of the Dyke Lake Area (parts of 23J/8, 9), Labrador,” Mineral Devel- opment Division, Newfoundland Department of Mines and Energy, 1978, p. 39.
[73] K. Laajoki, “Rare-Earth Elements in Precambrian Iron Formations in Vaydankyla, South Puolanka Area, Fin-
land,” Bulletin of the Geological Society of Finland, Vol. 47, No. 1-2, 1975, pp. 93-107.
[74] B. J. Fryer “Rare Earth Evidence in Iron Formations for Changing Precambrian Oxidation States,” Geochimica et CosmochimicaActa, Vol. 41, No. 3, 1977, pp. 361-367. doi:10.1016/0016-7037(77)90263-0
[75] B. J. Fryer, “Trace Element Geochemistry of the Soko- man Iron Formation,” Canadian Journal of Earth Sci- ences, Vol. 14, No. 7, 1977, pp. 1598-1610.
doi:10.1139/e77-136
[76] T. J. Barrett, P. W. Fralick and I. Jarvis, “Rare-Earth Ele- ment Geochemistry of Some Archean Iron Formations North of Lake Superior, Ontario,” Canadian Journal of Earth Sciences,Vol. 25, No. 4, 1988, pp. 570-580. doi:10.1139/e88-055
[77] H. J. W. De Baar, M. P. Bacon and P. G. Brewer, “Rare Earth Distributions with Positive Ce Anomaly in the Western North Atlantic Ocean,” Nature, Vol. 301, No. 5898, 1983, pp. 324-327. doi:10.1038/301324a0
[78] C. R. German and H. Elderfield, “Application of the Ce- Anomaly as a Paleoredox Indicator: The Ground Rules,” Paleoceanography, Vol. 5, No. 5, 1990, pp. 823-833. doi:10.1029/PA005i005p00823
[79] R. Byrne and E. Sholkovitz, “Marine Chemistry and Geo- chemistry of the Lanthanides,” In: K. A. Gschneider Jr. and L. Eyring, Eds., Handbook on the Physics and Chem- istry of the Rare Earths, Elsevier, Amsterdam, 1996, pp. 497-593.
[80] J. W. Moffett, “Microbially Mediated Cerium Oxidation in Seawater,” Nature, Vol. 345, No. 6274, 1990, pp. 421- 423. doi:10.1038/345421a0
[81] D. Koeppenkastrop and E. H. DeCarlo, “Sorption of Rare Earth Elements from Seawater onto Synthetic Mineral Particles—An Experimental Approach,” Chemical Geol- ogy, Vol. 95, No. 3-4, 1992, pp. 251-263.
doi:10.1016/0009-2541(92)90015-W
[82] H. J. W. De Baar, M. P. Bacon, P. G. Brewer and W. Brulank, “Rare Earth Elements in the Pacific and Atlantic Oceans,” Geochimica CosmochimicaActa, Vol. 49, No. 9, 1985, pp. 1943-1959. doi:10.1016/0016-7037(85)90089-4 [83] H. J. W. De Baar, C. R. German, H. Elderfield and P. Van
Gaans, “Rare Earth Element Distributions in Anoxic Wa- ters of the Cariaco Trench,” Geochimica et Cosmochi- micaActa, Vol. 52, No. 5, 1988, pp. 1203-1219. doi:10.1016/0016-7037(88)90275-X
[84] R. Germanc and H. Elderfield, “Rare Earth Elements in Saanich Inlet, British Columbia, a Seasonally Anoxic Ba- sin,” Geochimica CosmochimicaActa, Vol.53, No. 10, 1989, pp. 2561-2571. doi:10.1016/0016-7037(89)90128-2 [85] J. J. Braun, M. Pagel, J. P. Muller, P. Bilong, A. Michard
and B. Guillet, “Cerium Anomalies in Lateritic Profiles,” Geochimica et Cosmochimica Acta, Vol. 54, 1990, pp. 781-789.
[88] S. J. Goldstein and S. B. Jacobsen, “REE in the Great Whale River Estuary, NW Quebec,” Earth and Planetary Science Letters, Vol. 88, No. 1-2, 1988, pp. 241-252. doi:10.1016/0012-821X(88)90081-7
![Figure 2. Pan-African structural map of Cameroon and location of the study area (modified from [25])](https://thumb-us.123doks.com/thumbv2/123dok_us/173485.511391/3.595.65.534.83.605/figure-pan-african-structural-cameroon-location-study-modified.webp)