Solid-state NMR proves the presence of penta-coordinated Sc
site in MIL-100(Sc)
R. Giovine,
[a]C. Volkringer,
[a],[b]S. E. Ashbrook,
[c]J. Trébosc,
[a]D. McKay,
[c]T. Loiseau,
[a]J.-P.
Amoureux,
[a],[d]O. Lafon,
[a],[b]F. Pourpoint,*
[a]Abstract: Advanced solid-state NMR methods and first-principles calculations demonstrate for the first time the formation of penta-coordinated scandium sites. These coordinatively unsatured sites were shown during the thermal activation of scandium-based Metal-Organic Frameworks (MOFs). 45Sc NMR experiment allows their
specific observation in activated Sc3BTB2 and MIL-100(Sc) MOFs.
The assignment of the ScO5 groups is supported by the DFT
calculations of NMR parameters. The presence of ScO5 Lewis acid
sites in MIL-100(Sc) explains furthermore its catalytic activity. We also introduce the first NMR experiment to probe 13C-45Sc distances.
This advanced solid state NMR pulse sequence allows us to demonstrate the shrinkage of the MIL-100(Sc) network when the activation temperature raises.
Introduction
Metal-Organic Frameworks (MOFs) materials offer rich physical and chemical properties due to their adjustable architectures and porosity.[1] Thus, they present possible applications in
multiple domains including gas storage, heterogeneous catalysis, drug delivery… Amongst the wide variety of MOFs, MIL-100 compound exhibits a porous framework incorporating large cavities with diameter up to 34 Å, related to the MTN zeolite topology (ZSM-39). Firstly reported with chromium(III),[2] MIL-100
has then been isolated with other trivalent metals, such as iron,[3]
aluminium,[4] vanadium,[5] scandium[6, 7] or indium.[8] These MOFs
have been widely investigated owing to their numerous interesting properties including (i) high surface areas, (ii) Lewis-acidity, and (iii) remarkable thermal stability.[4, 9] In particular, the
Lewis acidity of activated MIL-100(Al or Cr) has been ascribed to the presence of penta-coordinated metal sites (AlO5 or CrO5), [9-11] whichare generated upon thermal activation. The CrO
5 sites
were detected by CO sorption Infra-Red (IR) study,[9, 11] whereas
the AlO5 ones were observed either by solid-state Nuclear
Magnetic Resonance (NMR)[12] or IR[13] spectroscopy.
Conversely, to the best of our knowledge, the nature of Lewis acid sites in MIL-100(Sc) has remained elusive.[14, 15] IR and H
2
adsorption studies have recently demonstrated the formation of five-fold coordinated scandium atoms, ScO5, upon the thermal
activation of another MOF: [Sc3O(BTB)2(H2O)3](OH)(H2O)5(DMF),
with H3BTB = 1,3,5-tris(4-carboxyphenyl) benzene, called
Sc3BTB2 hereafter.[16] Nevertheless, the Lewis acidity of this
MOF has not been investigated and hence it has not been possible to relate the Lewis acidity of Sc-based MOFs to the formation of ScO5 sites.
45Sc solid-state NMR a priori looks to be a promising technique
to study the local environment of Sc atoms. 45Sc nucleus has
favorable NMR properties, including 100% natural abundance and a gyromagnetic ratio close to that of 13C, γ(45Sc) ≈
0.967γ(13C).[6, 17, 18] Furthermore, 45Sc chemical shifts are known
to be very sensitive to the coordination number of the scandium[17, 19, 20] and their assignment can be supported by
Density Functional Theory (DFT) calculations,[19, 21, 22], notably in
Sc-based MOFs.[15] For Sc nuclei surrounded by similar atoms, it
has been shown that the 45Sc isotropic chemical shift decreases
when the coordination number of the scandium site increases.[17, 22] Nevertheless, the 45Sc isotropic chemical shift is also quite
sensitive to the other structural differences, such as bond angles and bond distances[19, 20] and hence the shift regions of the
different Sc coordinations in different families of materials overlap heavily. Furthermore, this spin-7/2 isotope is subject to large quadrupolar interactions [19, 20] and hence the second-order
quadrupolar broadening can obscure the chemical shift information. Such quadrupolar interaction is especially large for asymmetrical Sc environments, such as ScO5. An additional
difficulty for the NMR detection of 45ScO
5 sites is the low
concentration of those sites, since most materials contain mainly six, seven or eight-coordinated scandium environments.[17, 20]
Despite these difficulties, penta-coordinated Sc sites have been
recently observed by solid-state NMR in Sc-doped BaZrO3
containing oxygen vacancies.[16] However, in MOFs, only
hexa-coordinated Sc sites have been seen by solid-state NMR so far.[6, 15]
The NMR observation of carbon-scandium proximities would also provide valuable information about the structure of Sc-based MOFs. However, an instrumental limitation of NMR spectroscopy is that usual multiple channels NMR probes cannot be tuned simultaneously to two close Larmor frequencies, such as those of 13C and 45Sc isotopes (100.6 and 97.2 MHz,
respectively at the magnetic field of 9.4 T). Therefore, to the best of our knowledge, 13C-45Sc double resonance experiments have
not been reported so far. Nevertheless, we have demonstrated
[a] R.G., Prof C.V., Dr J.T., Dr T.L., Prof J.-P.A., Prof O.L., Dr F.P. Univ. Lille, CNRS, ENSCL, Centrale Lille, Univ. Artois, UMR 8181 -
UCCS -Unité de Catalyse et Chimie du Solide, F-59000 Lille, France [email protected]
[b] Prof C.V, Prof O.L.,
Institut Universitaire de France, 1 rue Descartes, 75231 Paris Cedex 5, France
[c] Prof S.E.A., Dr D. MK
EaStCHEM and School of Chemistry, University of St. Andrews, Purdie Building, North Haugh, St. Andrews, Fife, KY16 9ST, Scotland
[d] Prof J.-P.A.
Bruker, Biospin, Wissembourg, France
recently that the use of a frequency splitter[23] can circumvent
this limitation since this device allows tuning and matching a single probe channel to two close frequencies. We have notably used such device to acquire double-resonance 27Al-13C[24, 25] and 13C-51V[26] solid-state NMR experiments.
Herein, we demonstrate the formation of ScO5 sites during the
thermal activation of Sc3BTB2 using 1H and 45Sc NMR at high
magnetic field. The assignment of penta-coordinated Sc site is supported by DFT calculations. Furthermore, during the thermal activation of MIL-100(Sc), we also observe 45Sc NMR signals at
similar chemical shifts, which demonstrate the presence of penta-coordinated scandium species, which can react as Lewis acid sites. We report furthermore the first NMR observation of
13C-45Sc proximities in activated MIL-100(Sc). These
double-resonance 13C-45Sc experiments allow observing the shrinkage
of MOFs structure upon its thermal activation.
Results and Discussion
1. Structure and X-Ray diffraction of Sc
3BTB
2and MIL-100(Sc)
Figure 1. Representation of (a) the MTN topology of MIL-100(Sc), (b) the structure of Sc3BTB2 (c) the trigonal trimer of scandium; (d) the trimesate
ligand found in the MIL-100(Sc) structure; and (e) the 1,3,5-tris(4-carboxyphenyl)benzene ligand found in the Sc3BTB2 structure.
The structures of Sc3BTB2 and MIL-100(M) (M= metal) have
been solved by X-ray diffraction (XRD) of single-crystals.[2, 27]
The building unit of Sc3BTB2 and MIL-100(Sc) consists in a
trimer of corner sharing ScO6 octahedra linked by a µ3-oxo
ligand. Thus, each Sc3+ ion is hexa-coordinated to: (i) one µ 3-O,
(ii) four oxygen atoms from carboxylate groups, and (iii) a terminal hydroxyl group or a terminal water molecule (Fig. 1c). Carboxylate ligands bridge the corner sharing ScO6 octahedra of
the trimer. Conversely, the ligands differ between Sc3BTB2 and
MIL-100(Sc). The former is built up from 1,3,5-tris(4-carboxyphenyl)benzene (Fig. 1e) and the latter from trimesic acid (Fig. 1d). The crystal structures of Sc3BTB2 and
MIL-100(Sc) also differ. The Sc3BTB2 crystallizes in the hexagonal
space group P6̅2c forming hexagonal channels with a diameter of approximately 23 Å (Fig. 1b). Its unit cell contains two crystallographically inequivalent scandium sites. Conversely, MIL-100(Sc) adopts the topology corresponding to the MTN
zeolite (Fig. 1a) and its unit cell includes seven
crystallographically inequivalent scandium sites.[16]
X-ray thermodiffraction analysis allows probing modifications of the long-range positional order versus temperature for Sc3BTB2
and MIL-100(Sc) (Fig. S4 and S5, respectively). Up to 400°C, no drastic change occurs in the diffractogram of Sc3BTB2 indicating
that the crystal structure of this MOF is preserved up to this temperature. Above 400°C, the diffraction peaks vanish because of the ligand decomposition, which results in a collapse of the crystal structure. The rehydration of the different compounds activated at different temperatures does not perturb the 3D organization of the structure, since their corresponding powder X-ray diffraction patterns are similar (Fig. S6).
For MIL-100(Sc), no significant change occurs in terms of diffractogram upon heating up to 220°C (blue curves in Fig. S5). Above 220°C, diffraction Bragg peaks progressively broaden and decrease in intensity suggesting the formation of defects (green curves). At 300°C, diffraction peaks vanish, which indicates the collapse of the MIL-100(Sc) framework (red curves).
2. Solid-state NMR spectra of Sc
3BTB
22.1. 1D NMR spectra
As already shown for MIL-100(Al or Cr), the penta-coordinated metal sites cannot be observed by diffraction techniques owing to their lack of long-range order.[9-11, 27] Their observation hence
requires techniques, such as IR and NMR, which can probe the local structure at atomic level.[9, 11-13] Fig. 2 displays the 45Sc and 1H NMR spectra of Sc
3BTB2 as-synthesized materials (Fig. 2a)
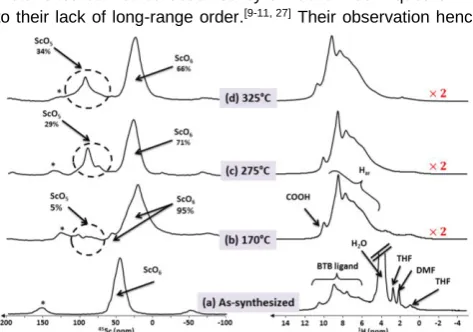
[image:2.595.307.544.500.666.2]Figure 2. 45
Sc (left) and 1
H (right) NMR spectra of Sc3BTB2: (a)
as-synthesized; (b-d) after thermal treatment under vacuum of one night at (b) 170, (c) 275 and (d) 325 °C. The spectra were recorded at 18.8 T and a MAS frequency of νR = 20 kHz. Spinning side bands are labeled with *. The vertical
scale of the (b-d) 1H spectra is multiplied by 2 compared to that in (a).
45Sc NMR spectrum of the as-synthesized material shows a
single resonance around 50 ppm, assigned to a scandium species in an octahedral environment (ScO6). This assignment is
in agreement with the literature.[6, 15] The resolution does not
allow distinguishing the two scandium crystallographic sites, even if the line-shape differs from the typical powder pattern of a single 45Sc site and must be produced by overlapping signals
from distinct Sc local environments. This line subsumes the contributions of scandium sites attached to terminal hydroxo and aqua ligands in the trinuclear μ3-oxo-centered inorganic sub-unit.
When the temperature increases at 170°C (Fig. 2b), a high field shift of the most intense 45Sc signal is observed. This shift is
tentatively ascribed to the evacuation of the pores and the flips
of the ligand phenyl rings around the single bonds between sp2
hybridized carbon atoms (Fig. 1e). For the terephtalic ligand, such phenyl flips have been observed using 2H NMR.[28]
Moreover, the lineshape of ScO6 signal at 170°C is broader than
for the as-synthesized material. Such broadening stems from a distribution in the orientation of the phenyl ring at higher
temperature. Weak and deshielded 45Sc peaks are also
observed at 170°C. Their intensities grow when the temperature raises (compare Figs. 2c-d) to reach 34% of the total integrated intensity at 325°C. It has been shown that the isotropic chemical shift of 45Sc nuclei increases for lower coordination number,[20, 22]
and especially the 45Sc signals of ScO
5 sites are more
deshielded than those of ScO6 ones.[29] Therefore these sites
can be assigned to penta-coordinated scandium. This attribution is in agreement with the literature where the ScO5 sites have
been evidenced by IR and H2 adsorption in activated
Sc3BTB2.[16] But to the best of our knowledge, the NMR
observation of ScO5 site in MOFs has not been reported so far.
Furthermore, the fraction of 34% of penta-coordinated scandium is in agreement with the structure (Fig. 3) and with results already published for analogous MOFs.[3, 9, 10] As stated above,
the slight disorder and the emergence of the penta-coordinated sites observed by NMR do not lead to main changes in the long-range order of the structure according to the XRD (Fig. S4).
Figure 3.Illustration of the dehydration process in scandium trimer Sc3(µ3-oxo)
and the formation of the penta-coordinated Sc site.
1H NMR spectrum of the as-synthesized material is dominated
by a high intensity water signal resonating at 3.7 ppm (Fig. 2a). To better display, its intensity has been cut. Two other groups of signals are observed in the spectrum. Between 0 and 3 ppm, low intensity signals are assigned to residual solvent or
impurities trapped into the pores, while between 5 and 12 ppm, signals are assigned to the ligand. The more precise assignment of those resonances requires 2D correlation spectra and is beyond the scope of this article. When the temperature increases to 170°C (Fig. 2b), the water signal dramatically decreases and the intensities of the peaks resonating between 0 and 3 ppm strongly decrease. This observation is consistent with volatiles species trapped into the pores (solvent), which are evacuated at high temperature. At 170°C, a broad peak is observed at 3.8 ppm and is ascribed to H2O and OH attached to
Sc atoms. The intensity of this peak decreases at 275 and 325°C, which is consistent with the elimination of aqua ligand (see Fig. 3). Conversely the signals resonating between 5 and 12 ppm are barely affected by the thermal activation, which suggests that the integrity of the ligand is preserved up to 325°C. This NMR observation confirms the XRD data of Fig. S4.
2.2. 2D MQ-MAS spectra
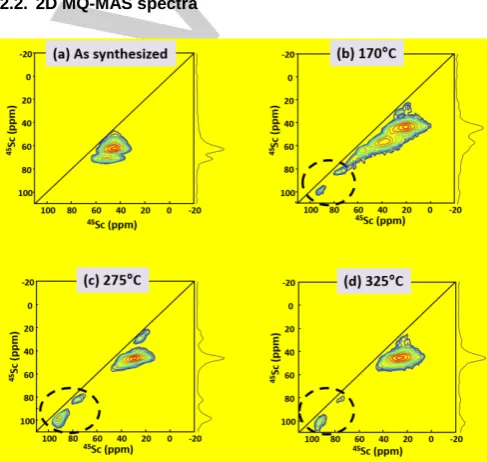
Figure 4.45Sc 3Q-MAS sheared 2D spectra of (a) as-synthesized Sc 3BTB2,
and (b-d) after thermal treatment at: (b) 170, (c) 275, and (d) 325 °C. Spectra were recorded at 18.8 T and νR = 20 kHz. The peaks inside the black circles
correspond to ScO5 sites.
The resolution of 45Sc NMR experiments is drastically improved
by acquiring 3Q-MAS 2D spectra (Fig. 4), to the extent that the two crystallographic-distinct sites of ScO6 are observable in the
spectrum of the as-synthesized material (Fig. 4a). The fits of this spectrum (Fig. S9) lead to the quadrupolar parameters reported in Table S1. The relatively high CQ values (11.7 and 13.5 MHz)
suggest a non-symmetrical octahedral environment for the scandium sites. At higher temperature (170°C, Fig. 4b), a broader distribution of quadrupolar parameters and chemical shifts is observed. At least six different scandium sites can be distinguished (Fig. S10, Table S2). Amongst them the two most deshielded signals at 77 and 92 ppm, which experience a smaller quadrupole interaction with CQ ≈ 8.0 MHz, can be
[image:3.595.305.549.278.509.2]increasing the temperature at 275°C (Fig. 4c, Fig. S11 and Table S3) and 325°C (Fig. 4d, Fig. S12 and Table S4), the intensity of those deshielded signals increases in agreement with the 1D spectra (Fig. 2b, c and d), whereas the CQ and δiso
values remain similar. This result suggests an increase of the amount of ScO5 in the material. To summarize, in Sc3BTB2,
hexa- and penta-coordinated scandium sites exhibit different ranges for the NMR parameters CQ and δiso (see Table 1). It is
noted that in the 3Q-MAS 2D spectrum of the 170°C material, the peak resonating at 66 ppm cannot be safely attributed to ScO5 or ScO6 since its quadrupolar parameters and isotropic
chemical shift are not characteristic of neither scandium site.
Table 1. Ranges of isotropic chemical shifts and CQ values of the penta-
and hexa-coordinated sites experimentally observed in Sc3BTB2.
Site ScO5 ScO6
δiso (ppm)
70-100 20-60
CQ / MHz ≈ 8 9-14
3.
Calculation of NMR parameters of ScO
5and
ScO
6sites
First-principles calculations of 45Sc NMR parameters in
Sc-based MOFs were carried out to further support the assignment of ScO5 signal. However, the large number of atoms in the unit
cell of Sc3BTB2 and MIL-100(Sc) precludes DFT calculations
using CASTEP code to converge within reasonable amount of time. Therefore, the DFT calculations were carried out on the MIL-88(Sc) compound. The crystalline structure of this MOF (Fig. S18a) is built from the same Sc trimers as Sc3BTB2 and
MIL-100(Sc) but with the 2,5-dihydroxyterephtalate ligand (Fig. S18b). However, its structure can be described by a much smaller unit cell. We performed first the calculations on the unmodified MIL-88(Sc) structure (see Table S5).[30] The difference in δ
iso
between ScO6 sites, (a,d) on the one hand and (b,c,e,f) on the
other hand, is about 6-7 ppm, which is similar to that between the two ScO6 sites of Sc3BTB2 (see Table S1). The calculated
CQ values of ScO6 site in MIL-88(Sc) are comparable to those
measured for similar Sc environments in Sc3BTB2 (see Table
S1). Calculations were also performed on the modified
MIL-88(Sc) structure in which a H2O ligand had been removed from
the structure in order to form a five-fold coordinated scandium (see Table S6). For such structure, the DFT calculations predict distinct chemical shifts for the five ScO6 sites contained within
the unit cell. The δiso of (a) and (f) sites are about 8-9 ppm higher
than that of (d) site and 17-19 ppm higher than that of (b) and (c) sites. Such differences are similar to the one measured for the three most shielded ScO6 sites of Sc3BTB2 heated at 275°C
(see Table S3). The calculated CQ values of ScO6 site in
[image:4.595.306.545.406.597.2]modified MIL-88(Sc) agree reasonably well with those measured for those sites in Sc3BTB2 heated at 170, 275 or 325°C (see
Table S1 to S4). Furthermore, the DFT calculations predict a δiso
for the ScO5 site, which is 74 ppm higher than that of the most
shielded ScO6 site. Such prediction agrees with the measured
isotropic chemical shift difference between sites (a) and (f) in Sc3BTB2 heated at 275°C (see Table S3) as well as sites (a) and
(d) in Sc3BTB2 heated at 325°C (see Table S4). Furthermore,
the higher isotropic chemical shift of ScO5 site with respect to
ScO6 one is consistent with the already reported increase in
isotropic chemical shift for decreasing coordination number of Sc atom.[17, 22] The calculated C
Q values of ScO5 site in modified
MIL-88(Sc) is significantly higher than that measured for those sites in Sc3BTB2 heated at 170, 275 or 325°C (see Table S1 to
S4). Such discrepancy can stem from (i) the different ligands in Sc3BTB2 and MIL-88(Sc) and (ii) the absence of NMR signals for 45Sc nuclei subject to large C
Q values in the 3Q-MAS 2D spectra,
from which the experimental CQ value is measured. The
3Q-MAS experiment does not excite efficiently nuclei subject to large quadrupolar interaction. Experimentally, the number of inequivalent 45Sc sites in Sc
3BTB2 heated at 170 and 275°C
exceeds that predicted by DFT calculations for modified MIL-88(Sc). Such discrepancy stems from the structural differences between MIL-88(Sc) and Sc3BTB2 as well as the lack of
periodicity of ScO5 defects in the Sc3BTB2 crystal contrary to the
modified MIL-88(Sc) structure used for the DFT calculations.
4.
Solid-state NMR spectra of MIL-100(Sc)
4.1 1D NMR spectra
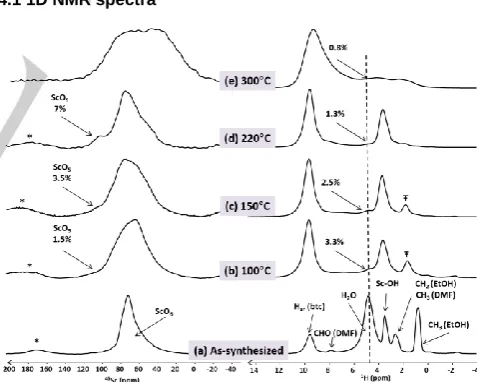
Figure 5. 45
Sc (left) and 1
H (right) NMR spectra of MIL-100(Sc): (a) as-synthesized and (b-d) after thermal treatment of one night at (b) 100, (c) 150, (d) 220, and (e) 300°C. The spectra were recorded at 18.8 T with a MAS frequency of νR = 20 kHz. The fraction of integrated intensity corresponding to 45ScO
5 signal after deconvolution is indicated in (b-d) on the left. The
integrated intensity of the water 1H signal after deconvolution is also indicated
on the right spectra and is normalized with respect to that of water 1H signal in
(a). * and Ŧ label the spinning sidebands and an impurity signal, respectively.
Fig. 5 shows the 45Sc and 1H NMR spectra of MIL-100(Sc)
as-synthesized (Fig. 5a) and after thermal treatment at temperature
of the as-synthesized material is similar to that already reported and it exhibits a broad and asymmetric line-shape resonating around 70 ppm (Fig. 5a), which is assigned to ScO6 sites.[6, 15]
The seven crystallographically inequivalent sites for the scandium are not resolved. As stated for the Sc3BTB2 material,
the asymmetric line-shape is attributed to the distribution of quadrupolar and chemical shift parameters. Thermal activation at temperatures ranging from 100 to 220°C produces a broadening of the ScO6 signal (Fig.5b-e) due to a possible
increase in the quadrupolar interaction. Moreover, a weak resonance at about 100 ppm becomes more intense for higher activation temperature. The deconvolution of the 45Sc signals is
shown in Fig. S7 for MIL-100(Sc) activated at 220°C. Thus, the signal with a resonance frequency higher than ScO6 site is
assigned to ScO5 environment since: (i) the results obtained in
the first part of this article prove that the isotropic chemical shift of ScO5 is higher than that corresponding to ScO6 sites, (ii) in
MIL-100(Al or Cr), thermal activation removes the aqua ligands of AlO6 sites and hence forms Lewis acid AlO5 or CrO5 sites, and
activated MIL-100(Sc) is also a Lewis acid catalyst,[14, 15] and (iii)
this signal cannot correspond to a 45Sc satellite transition since a
corresponding peak is observed in the 3Q-MAS spectrum (see below). As seen in Fig. 5, the integrated intensity fraction corresponding to the most deshielded 45Sc signal increases from
100 to 220°C. This result indicates an increasing amount of ScO5 defects at higher activation temperature, up to 7 % of
scandium sites. Nevertheless, the fraction indicated in Fig. 5 is much lower than that found in Sc3BTB2 and MIL-100(Al) for
penta-coordinated Sc or Al species, respectively.[10] This may be
due to the less thermally stable structure of MIL-100(Sc), which collapses at 220 °C, while this temperature is required for Sc3BTB2 and MIL-100(Al) in order to reach 30 % of ScO5 and
AlO5 site, respectively. The 45Sc NMR spectrum of MIL-100(Sc)
activated at 300°C displays a very broad line-shape, which indicates a large distribution of local Sc environments. Such distribution is consistent with the collapse of the MOF framework observed by X-ray diffraction (Fig. S5).
Fig. 5 also shows the 1H NMR spectra of MIL-100(Sc) after
different thermal treatments. Multiple resonances are observed in the 1H NMR spectrum of the as-synthesized material (Fig. 5a),
in agreement with the previously published 1H NMR spectrum of
the analogous MIL-100(Al).[10] Upon heating, the intensity of
water and solvent 1H signals strongly decreases, showing that
thermal activation removes the physisorbed molecules in the pores. As seen in Fig. 5, thermal activation at 100°C results in a 30-fold decrease in the amount of water in MIL-100(Sc). Such dehydration at moderate temperature corresponds to the evacuation of physisorbed water,[10] which is pursued at higher
temperatures (Fig. 5c-d). This water reduction at high temperature corresponds to the loss of aqua ligands, in agreement with the formation of ScO5 sites (see above).
Moreover, the activated MIL-100(Sc) displays an additional 1H
signal at 1.7 ppm (indicated with Ŧ), which is ascribed to impurities coming from the degradation of the DMF. This signal decreases for increasing activation temperature. The activated MIL-100(Sc) also displays a 1H signal at 3.5 ppm ascribed to
Sc-OH sites. The Sc-OH signals in activated MIL-100(Sc) are broader than in the as-synthesized sample since in the latter the
exchange between OH protons and physisorbed molecules reduce 1H-1H dipolar coupling. The dramatic broadening of the 1H signals after thermal activation at 300°C (Fig. 5e) confirms
the collapse of the MIL-100(Sc) structure.
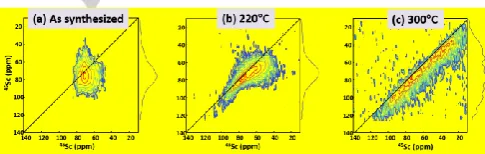
4.2 2D 3Q-MAS NMR spectra
Proof of the presence of ScO5 sites can be confirmed by the
high resolution 45Sc 3Q-MAS 2D spectra (Fig. 6). The one of the
as-synthesized MIL-100(Sc) (Fig. 6a) displays a broad distribution of isotropic shifts due to the unresolved seven scandium sites, in contrast with Sc3BTB2 that exhibits only two
crystallographic sites (Fig.4a). The 3Q-MAS spectrum of the MIL-100(Sc) activated at 220°C (Fig. 6b) permits to resolve the signals of ScO5 and ScO6 sites. With respect to the
as-synthesized sample, the ScO6 signal (i) exhibits a narrower
distribution of isotropic shifts and (ii) corresponds to a larger quadrupole interaction, since the removal of physisorbed molecules within the pores reduces the structural disorder and increases the electric field gradients for ScO6 sites. The 3Q-MAS
spectrum of the MIL-100(Sc) activated at 300°C (Fig. 6c) confirms the broad distribution of 45Sc environments produced
by the collapse of the MOF structure.
As a conclusion, the formation of ScO5 in thermally activated
MIL-100(Sc) is confirmed by solid-state NMR upon temperature by removing a water molecule (Fig. 5). The presence of this coordinatively unsatured site explains the Lewis acidity already observed in this material.[14, 15]
Figure 6.45Sc 3Q-MAS sheared 2D spectra at 18.8 T of (a) as-synthesized
MIL-100(Sc), and after thermal treatment at (b) 220 and (c) 300°C.
4.3 2D D-HMQC NMR spectra
The proximities between 1H and 45Sc nuclei have been probed
by45Sc-{1H} D-HMQC 2D spectra (Fig. 7). In those spectra, the
most intense correlation peak is that between the btc ligand and the ScO6 sites. A cross-peak between the signals of Sc-OH
groups and ScO6 sites is also detected. This cross-peak is weak
in the as-synthesized material since the proton exchange between OH groups and physisorbed water and ethanol molecules decreases the 1H-45Sc dipolar couplings. In the
MIL-100(Sc) heated at 220°C, the cross-peak between Sc-OH proton and ScO6 sites becomes more intense since the physisorbed
[image:5.595.305.548.400.477.2]Figure 7. 45Sc-{1H} D-HMQC 2D spectra of (a) as-synthesized MIL-100(Sc),
and after thermal treatment at (b) 220, and (c) 300 °C. 2D spectra were recorded at 18.8 T with a spinning speed of R = 20 kHz.
4.4 13C-{45Sc} S-RESPDOR NMR spectra
1H → 13C CPMAS spectra exhibit three resonances
corresponding to the three distinct carbon sites of the btcligand (Fig. S8), consistently with the previously published spectra.[6]
The 13C signals are only marginally modified for increasing
activation temperature up to 220°C. However, at 300°C a dramatic broadening occurs owing to the collapse of the MOF framework (see above). Thus, thermal activation up to 220°C leads to the formation of ScO5 sites (Fig. 5), but the integrity of
[image:6.595.48.289.84.203.2]the ligand is preserved below 220°C (Fig. S8).
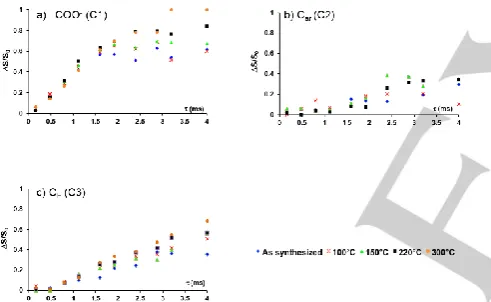
Figure 8. Comparison between the 13C-{45Sc} SFAM-RESPDOR curves at 9.4
T and νR = 12.5 kHz for the three carbon sites: a) C3, b) C2 and c) C1 of
as-synthesized MIL-100(Sc) (blue diamonds), and after thermal treatment at 100 (red crosses), 150 (green triangles), 220 (black squares) and 300°C (orange circles). The S/N of the C2 signal of the sample heated at 300°C is too low to measure the SFAM-RESPDOR fraction.
Probing 13C-45Sc proximities is useful to detect changes in the
structure of Sc-based MOFs during the heating. To this end, the
13C-45Sc distances were measured by SFAM-RESPDOR
experiments.[24] Fig. 8 displays the 13C-{45Sc} S-RESPDOR
signal fractions, ΔS/S0, as a function of the recoupling time for
each of the three carbons of MIL-100(Sc) after thermal activation at different temperatures. Those heteronuclear experiments between isotopes with close Larmor frequencies were performed
using a frequency splitter,[23] and a SFAM-RESPDOR sequence
suitable for the splitter (see Fig. S1).[24] The comparison of the 13C-{45Sc} SFAM-RESPDOR fractions for the three carbon sites
shows that the dephasings of 13C transverse magnetization
under 13C-45Sc dipolar couplings are the fastest for COO- site,
the slowest for Car, and intermediate for CH. These results
suggest that d(Sc…COO-) < d(Sc…CH) < d(Sc…Car). It is noted that a low
S/N is obtained for the Car site due to the smaller efficiency of
the cross polarization for the quaternary carbon (Fig. S8). Thus, the ΔS/S0 fraction of this site exhibits a lower accuracy. For each
materials, the uncertainties of the signal fraction are reported in the Fig. S13-S17 using the S/N and the equation 4 of the ref.[24]
Obviously for each carbon sites, the ΔS/S0 fractions globally
increase for higher activation temperature. These NMR observations indicates shorter distances between the 13C and 45Sc nuclei at higher temperature and are consistent with the
shrinkage of the unit cell of MIL-100(Sc) at higher temperature. Such shrinkage has already been reported for MIL-100(Cr).[9]
Conclusions
Solid-state NMR has demonstrated the formation of ScO5 in
Sc3BTB2 and MIL-100(Sc) upon thermal activation. To the best
of our knowledge, this result represents the first NMR observation of these sites in Sc-based MOFs. In agreement with the already reported decrease in the 45Sc isotropic chemical shift
for higher coordination number, the ScO5 signal is more
deshielded than the ScO6 one. The assignment of ScO5 signal is
supported by DFT first-principles calculations. The formation of ScO5 sites is concomitant with the decrease of water 1H NMR
signal. Thus, the ScO5 sites are produced from ScO6 one by the
removal of an aqua ligand. The formation of ScO5 sites in
activated MIL-100(Sc) explains the Lewis acidity of this material.
1H NMR also shows the evacuation of the physisorbed
molecules from the pores, whereas 45Sc NMR indicates a
change in the local environment of ScO6 sites in activated MOFs.
Moreover, 13C-45Sc proximities have been probed for the first
time using NMR. Even if 13C and 45Sc isotopes exhibit close
Larmor frequencies the combination of a frequency splitter and an adapted NMR pulse sequence has permitted the estimate of
13C-45Sc distances in MIL-100(Sc). This technique has enabled
to detect a shrinkage of the structure when the temperature increases.
Experimental Section
Synthesis of materials
Sc3BTB2: It was synthesized, based on an upscale version of the
procedure reported in the literature[16] using ScCl3.xH2O (0.27 g, 1.35
mmol) and H3BTB (0.20 g, 0.45 mmol) dispersed in a mixture of N,N
’-dimethylformamide (DMF, 6 mL), tetrahydrofuran (THF, 8 mL), CH2Cl2 (6
mL), H2O (6 mL) and HNO3 (69.5%, 6 drops). The reaction was carried
out in a 125 mL Teflon-liner within a Parr-type autoclave heated at 120°C for 48 h and then cooled down to room temperature over a period of 12 h.
MIL-100(Sc): This compound was synthesized according to the
procedure reported in the literature and Sc(NO3)3.3H2O was used as the
scandium source.[6]
[image:6.595.49.295.355.506.2]Thermodiffractions of Sc3BTB2 and MIL-100(Sc) were performed under 5
L.h-1 air flow in an Anton Paar HTK1200N of a D8 Advance Bruker
diffractometer (- mode, CuKα1/α2 radiation) equipped with a Vantec1
linear position sensitive detector (PSD). Each powder pattern was
recorded in the range 6-60° for 2 (at intervals of 20°C between RT and
800°C) with a 1s/step scan, corresponding to an approximate duration of
27 min. The heating rate between two patterns was 5°C.min-1.
The PXRD analysis for the Sc3BTB2 rehydrated sample was carried out
on a Bruker D8 Advance diffractometer (CuKα radiation) equipped with a
Lynx Eye® fast detector. Each pattern was recorded in the 2 range 5-50°
with a 0.3 s/step scan.
Sample preparation for NMR measurements
Sc3BTB2. As described in the literature,[16] as-synthesized product was
first soaked in acetone during 96 h, and then degassed under vacuum
(10-6 bar) at the desired temperature (170, 275 or 325°C) overnight. The
resulting product was then cooled down to room temperature and transferred in an argon glovebox to be packed in a 3.2 mm zirconia rotor, which was closed with a Vespel cap.
MIL-100(Sc). As-synthesized samples were packed in a 3.2 mm zirconia rotor without a cap and heated in an oven at the desired temperature (100, 150, 220 or 300°C) for one night. At the end of the night, the rotor was closed with a Vespel cap.
NMR experiments
The employed NMR pulse sequences are depicted in Figs. S1-S3 of the
Electronic Supporting Information. The 1H and 13C chemical shifts were
referenced to tetramethylsilane (TMS), whereas the 45Sc chemical shifts
were referenced to 1M Sc(NO3)3.3H2O aqueous solution.
For both MIL-100(Sc) and Sc3BTB2 samples, 1H, 45Sc and 45Sc-1H NMR
experiments were carried out using a Bruker Avance III 18.8 T (800 MHz for proton) spectrometer equipped with a 3.2 mm double resonance
probe spinning at a Magic-Angle Spinning (MAS) frequency of R = 20
kHz. In the 1H experiments, a DEPTH sequence was used to remove the
background signal,[31] and the RF-amplitude was 73 and 71 kHz for
MIL-100(Sc) and Sc3BTB2 respectively. The 45Sc NMR spectra were acquired
using direct excitation under MAS (DEMAS) using a 45Sc pulse lasting
0.93 µs and an RF amplitude of 67 kHz for MIL-100(Sc) and 1 µs and an
RF amplitude of 62.5 kHz for Sc3BTB2. The 1H DEMAS spectra result
from averaging 16 transients with a recovery delay RD = 5 s, i.e. an
experimental time of 80 s. The 45Sc DEMAS spectra result from
averaging 1024 transients with a recovery delay RD = 0.5 s, i.e. an
experimental time of 8 min 32 s.
For the dipolar-mediated Heteronuclear Multiple-Quantum Correlation (D
-HMQC) 2D experiments with 45Sc detection and 1H indirect detection
(45Sc-{1H}), the heteronuclear coherence transfer is mediated by 1H-45Sc
dipolar interactions, which are reintroduced by the SR421
symmetry-based recoupling sequence.[32] This recoupling scheme suppresses the
homonuclear 1H-1H dipolar interactions in the first-order average
Hamiltonian.[33] 1H RF amplitudes for the 90° pulses and the SR421
recoupling were equal to rf = 71 and 40 kHz (twice R), respectively. The
RF amplitude of the 45Sc pulses selective of the Central Transition (CT)
was equal to 18 kHz. Each of the two dipolar recoupling periods, rec/2,
was equal to 600 µs = 12TR (where TR corresponds to a rotor period). No
1H dipolar decoupling was applied during the acquisition. Spectra were
recorded with an accumulation of 600 transients and a recovery delay of
RD = 1 s, leading to an experimental time of 8 hours.
45Sc triple-quantum (3Q-MAS) 2D experiments were acquired using a
z-filtered pulse sequence.[34] Excitation and reconversion pulses lasted 3.5
and 1.0 µs, respectively, with rf = 62.5 kHz for Sc3BTB2 and 3.6 and 1.2
µs with rf = 52 kHz for MIL-100(Sc). The CT selective /2 last pulse
employed rf = 7.6 and 9 kHz for MIL-100(Sc) and Sc3BTB2, respectively.
The recovery delay, the number of transients and the experimental time
were (0.5 s, 960, 6h30) for Sc3BTB2 and (2 s, 504, 12 h) for MIL-100(Sc).
The 45Sc quintuple-quantum MAS (5Q-MAS) spectra of MIL-100(Sc)
were also acquired (not shown) but they exhibit similar resolution as the 3Q-MAS ones and lower signal-to-noise ratio (S/N).
The 1H 13C cross-polarization (CPMAS) 1D experiments and the
Resonance-Echo Saturation-Pulse DOuble-Resonance (RESPDOR) one
with 13C detection and 45Sc as dephaser nuclei (13C-{45Sc}) were
performed on a 9.4 T Bruker spectrometer (400 MHz for proton) equipped with an AVANCE-II console. Spectra were recorded with a 3.2 mm three-channels HXY probe used in double-resonance mode and the
rotor was spun at νR = 12.5 kHz. For the 1H 13C CPMAS 1D
experiments of MIL-100(Sc), the recovery delay was RD = 2 s, the
contact time was CP = 3 ms, the 13C RF field was 94 kHz, and the 1H RF
field amplitude was linearly ramped from 50 to 100 kHz. SPINAL-64 1H
decoupling with 80 kHz rf was applied during the acquisition of 13C
spectra.[35] The number of scans was NS = 512, which lead to 17 minutes
experimental time.
13C-{45Sc} RESPDOR experiments employ Simultaneous Frequency and
Amplitude Modulation (SFAM1) scheme[36] as heteronuclear dipolar
recoupling and are denoted SFAM-RESPDOR hereafter. The SFAM1
heteronuclear recoupling has been chosen because it is robust and efficient when the irradiated spins are not subject to large homo-nuclear
dipolar couplings, as it is the case here for the 13C nuclei in this
isotopically unmodified MOFs. In RESPDOR experiments, the RF field
amplitude of 45Sc saturation pulse was 50 kHz, and the sum of the two
dipolar SFAM1 recoupling periods, rec, was varied from 0 to 4 ms.
Continuous wave 1H decoupling with an RF field amplitude of 80 kHz was
applied during SFAM1 recoupling periods. SPINAL-64 1H decoupling with
rf = 80 kHz was also applied during acquisition. The recovery delay of
this experiment was RD = 2 s. The number of scans was NS = 2048 and
the experiments lasted for 23 hours.
First-principles calculations
Calculations were performed with the CASTEP DFT code (version 8)[37]
using the GIPAW (gauge including projected augmented wave)
algorithm.[37, 38] Perdew-Burke-Ernzerhof generalized gradient
approximation[39] was used and the valence electrons were described by
ultra-soft pseudopotentials.[40] The integrals over the first Brillouin zone
were performed using a Monkhorst-Pack grid[41] and k point spacing was
0.04 2π Å-1. The cut-off energy used was 60 Ry. Scalar relativistic effects
were included at the zero-order relativistic approximation (ZORA)
level.[42] A semi-empirical dispersion correction (SEDC) scheme was
used.[43] DFT calculations were first performed on the already published
structure of MIL-88(Sc),[30] which contains six ScO6 sites. Then, the
crystallographic data of MIL-88(Sc) containing ScO5 sites were derived
by removing one H2O molecule from the MIL-88(Sc) unit cell. This
modified unit cell contains five ScO6 sites and one ScO5 site.
Geometry optimizations of the structures were performed using a
variable unit cell with an energy tolerance of 0.0001 eV. The 45Sc
isotropic chemical shifts were referenced by converting the absolute
magnetic shielding iso,iinto the chemical shift δiso,i = ref,i - iso,i so that
δiso(45Sc) = -48.2 ppm for ScPO4.
Acknowledgements
contract ANR-14-CE07-0009-01. Laurence Burylo and Frédéric Capet are also acknowledged for the help with the X-Ray Diffraction.
Keywords: MOF • MIL-100(Sc) • ScO5 • DFT • 13C-45Sc
[1] H. C. Zhou, J. R. Long, O. M. Yaghi, Chem. Rev. 2012, 112, 673-1268; J. R. Long, O. M. Yaghi, Chem. Soc. Rev. 2009, 38, 1207-1508.
[2] C. Serre, F. Millange, S. Surble, G. Ferey, Angew. Chem.-Int. Ed.
2004, 43, 6286-6289.
[3] P. Horcajada, S. Surble, C. Serre, D.-Y. Hong, Y.-K. Seo, J.-S. Chang, J.-M. Greneche, I. Margiolaki, G. Férey, Chem. Commun.
2007, 2820-2822.
[4] C. Volkringer, D. Popov, T. Loiseau, G. Férey, M. Burghammer, C. Riekel, M. Haouas, F. Taulelle, Chem. Mater. 2009, 21, 5695-5697. [5] A. Lieb, H. Leclerc, T. Devic, C. Serre, I. Margiolaki, F. Mahjoubi, J.
S. Lee, A. Vimont, M. Daturi, J. S. Chang, Microporous
Mesoporous Mater. 2012, 157, 18-23.
[6] J. P. S. Mowat, S. R. Miller, A. M. Z. Slawin, V. R. Seymour, S. E. Ashbrook, P. A. Wright, Microporous Mesoporous Mater. 2011,
142, 322-333.
[7] Y. T. Li, K. H. Cui, J. Li, J. Q. Zhu, X. Wang, Y. Q. Tian, Chin. J.
Inorg. Chem. 2011, 27, 951-956.
[8] F. Zhang, X. Q. Zou, W. Feng, X. J. Zhao, X. F. Jing, F. X. Sun, H. Ren, G. S. Zhu, J. Mater. Chem. 2012, 22, 25019-25026. [9] A. Vimont, J. M. Goupil, J. C. Lavalley, M. Daturi, S. Surble, C.
Serre, F. Millange, G. Férey, N. Audebrand, J. Am. Chem. Soc.
2006, 128, 3218-3227.
[10] M. Haouas, C. Volkringer, T. Loiseau, G. Férey, F. Taulelle, J.
Phys. Chem. C 2011, 115, 17934-17944.
[11] A. Vimont, H. Leclerc, F. Mauge, M. Daturi, J. C. Lavalley, S. Surble, C. Serre, G. Férey, J. Phys. Chem. C 2007, 111, 383-388. [12] C. Volkringer, D. Popov, T. Loiseau, N. Guillou, G. Férey, M.
Haouas, F. Taulelle, C. Mellot-Draznieks, M. Burghammer, C. Riekel, Nature Mater. 2007, 6, 760-764.
[13] C. Volkringer, H. Leclerc, J. C. Lavalley, T. Loiseau, G. Férey, M. Daturi, A. Vimont, J. Phys. Chem. C 2012, 116, 5710-5719. [14] J. Perles, M. Iglesias, C. Ruiz-Valero, N. Snejko, Chem. Commun.
2003, 346-347; L. Mitchell, P. Williamson, B. Ehrlichova, A. E. Anderson, V. R. Seymour, S. E. Ashbrook, N. Acerbi, L. M. Daniels, R. I. Walton, M. L. Clarke, P. A. Wright, Chem. Eur. J. 2014, 20, 17185-17197; Y. Cao, Z. Q. Zhu, J. N. Xu, L. Wang, J. Y. Sun, X. B. Chen, Y. Fan, Dalton Trans. 2015, 44, 1942-1947.
[15] L. Mitchell, B. Gonzalez-Santiago, J. P. S. Mowat, M. E. Gunn, P. Williamson, N. Acerbi, M. L. Clarke, P. A. Wright, Catal. Sci.
Technol. 2013, 3, 606-617.
[16] I. A. Ibarra, X. Lin, S. Yang, A. J. Blake, G. S. Walker, S. A. Barnett, D. R. Allan, N. R. Champness, P. Hubberstey, M. Schroeder, Chem. Eur. J. 2010, 16, 13671-13679.
[17] N. Kim, C. H. Hsieh, J. F. Stebbins, Chem. Mater. 2006, 18, 3855-3859.
[18] N. Kim, J. F. Stebbins, Chem. Mater. 2009, 21, 309-315. [19] A. J. Rossini, R. W. Schurko, J. Am. Chem. Soc. 2006, 128,
10391-10402.
[20] M. D. Alba, P. Chain, P. Florian, D. Massiot, J. Phys. Chem. C
2010, 114, 12125-12132.
[21] C. V. Chandran, J. Cuny, R. Gautier, L. Le Polles, C. J. Pickard, T. Brauniger, J. Magn. Reson. 2010, 203, 226-235.
[22] T. Brauniger, A. J. Hofmann, I. L. Moudrakovski, C. Hoch, W. Schnick, Solid State Sci. 2016, 51, 1-7.
[23] J. Haase, N. J. Curro, C. P. Slichter, J. Magn. Reson. 1998, 135, 273-279.
[24] F. Pourpoint, J. Trébosc, R. M. Gauvin, Q. Wang, O. Lafon, F. Deng, J. P. Amoureux, ChemPhysChem. 2012, 13, 3605-3615. [25] F. Pourpoint, Y. Morin, R. M. Gauvin, J. Trébosc, F. Capet, O.
Lafon, J. P. Amoureux, J. Phys. Chem. C 2013, 117, 18091-18099; F. Pourpoint, A. S. Lilly Thankamony, C. Volkringer, T. Loiseau, J. Trébosc, F. Aussenac, D. Carnevale, G. Bodenhausen, H. Vezin, O. Lafon, J. P. Amoureux, Chem. Commun. 2014, 50, 933-935.
[26] F. Pourpoint, J. Yehl, M. Li, R. Gupta, J. Trébosc, O. Lafon, J.-P. Amoureux, T. Polenova, ChemPhysChem 2015, 16, 1619-1626. [27] C. Volkringer, T. Loiseau, M. Haouas, F. Taulelle, D. Popov, M.
Burghammer, C. Riekel, C. Zlotea, F. Cuevas, M. Latroche, D. Phanon, C. Knofelv, P. L. Llewellyn, G. Férey, Chem. Mater. 2009,
21, 5783-5791.
[28] D. I. Kolokolov, H. Jobic, A. G. Stepanov, V. Guillerm, T. Devic, C. Serre, G. Ferey, Angew. Chem.-Int. Ed. 2010, 49, 4791-4794. [29] I. Oikawa, H. Takamura, Chem. Mater. 2015, 27, 6660-6667. [30] P. D. C. Dietzel, R. Blom, H. Fjellvag, Dalton Trans. 2006,
2055-2057.
[31] D. G. Cory, W. M. Ritchey, J. Magn. Reson. 1988, 80, 128-132. [32] A. Brinkmann, A. P. M. Kentgens, J. Am. Chem. Soc. 2006, 128,
14758-14759.
[33] O. Lafon, Q. Wang, B. W. Hu, F. Vasconcelos, J. Trébosc, S. Cristol, F. Deng, J. P. Amoureux, J. Phys. Chem. A 2009, 113, 12864-12878.
[34] J. P. Amoureux, C. Fernandez, S. Steuernagel, J. Magn. Reson.
1996, 123, 116-118.
[35] B. M. Fung, A. K. Khitrin, K. Ermolaev, J. Magn. Reson. 2000, 142, 97-101.
[36] R. Q. Fu, S. A. Smith, G. Bodenhausen, Chem. Phys. Lett. 1997,
272, 361-369.
[37] C. J. Pickard, F. Mauri, Phys. Rev. B 2001, 63, 245101(245101-245113).
[38] C. Bonhomme, C. Gervais, F. Babonneau, C. Coelho, F. Pourpoint, T. Azais, S. E. Ashbrook, J. M. Griffin, J. R. Yates, F. Mauri, C. J. Pickard, Chem. Rev. 2012, 112, 5733-5779; T. Charpentier, Solid
State Nucl. Magn. Reson. 2011, 40, 1-20; S. E. Ashbrook, D.
McKay, Chem. Commun. 2016, 52, 7186-7204.
[39] J. P. Perdew, K. Burke, M. Ernzerhof, Phys. Rev. Lett. 1996, 77, 3865-3868.
[40] D. Vanderbilt, Phys. Rev. B 1990, 41, 7892-7895.
[41] H. J. Monkhorst, J. D. Pack, Phys. Rev. B 1976, 13, 5188-5192. [42] T. F. G. Green, J. R. Yates, J. Chem. Phys. 2014, 140.
[43] D. V. Dudenko, J. R. Yates, K. D. M. Harris, S. P. Brown,
Entry for the Table of Contents
FULL PAPER
Text for Table of Contents
R. Giovine, C. Volkringer S. E. Ashbrook J. Trébosc, D. McKay, T. Loiseau, J.-P. Amoureux, O. Lafon, F. Pourpoint*
Page No. – Page No.