FIBRE ARCHITECTURE DESIGN OF 3D WOVEN COMPOSITE WITH
GENETIC ALGORITHMS—A UNIT CELL BASED OPTIMISATION
FRAMEWORK AND PERFORMANCE ASSESSMENT
Xuesen Zeng1, Andrew Long2, Ian Ashcroft3 and Prasad Potluri4
1Division of Materials, Mechanics and Structures, University of Nottingham University Park, Nottingham, NG7 2RD, United Kingdom
Email:[email protected]
Webpage: http://www.nottingham.ac.uk/engineering/people/xuesen.zeng
2Division of Materials, Mechanics and Structures, University of Nottingham University Park, Nottingham, NG7 2RD, United Kingdom
Email: [email protected]
Webpage: https://www.nottingham.ac.uk/engineering/people/andrew.long
3Division of Manufacturing and Process Technologies, University of Nottingham University Park, Nottingham, NG7 2RD, United Kingdom
Email: [email protected]
Webpage: https://www.nottingham.ac.uk/engineering-rg/manufacturing/3dprg/people/ian.ashcroft
4School of Materials, University of Manchester Manchester, M13 9PL, United Kingdom Email: [email protected]
Webpage: http://www.manchester.ac.uk/research/prasad.potluri
Keywords:
3D woven composites, design optimisation, Genetic Algorithm, unit cellABSTRACT
There are vast possibilities in fibre architecture design of 3D woven reinforcement. This paper considers the application of Genetic Algorithm (GA) in 3D woven composites optimisation. A set of real and integral variables, representing 3D fibre architecture, are formulated into a mixed integer Genetic Algorithm. The objective function is evaluated through automation of the unit cell based finite element analysis, by using the open source pre-processor TexGen and the commercial solver ABAQUS. The mixed integer Genetic Algorithm is adapted to a micro-population, aiming to improve computational efficiency. The study uses statistical tests to quantify the performance of the Genetic Algorithm schemes and the choice of parameters. The proposed approach was applied to the optimisation of 3D woven composites for maximum buckling resistance for the case of a landing gear brace. This study demonstrated that the optimisation converged to the optimum design within 20 iterations, considering 300 out of 7000 permissible solutions. In terms of buckling performance, the optimum design performed twice as well as cross-ply laminated composites and at least 50% better than known orthogonal 3D woven composites.
1 INTRODUCTION
To date, engineers and researchers have used a limited number of 3D woven fibre architectures – broadly being weave variants of orthogonal, angle-interlock and layer-to-layer. However, fibre architecture in 3D weaving appears to have infinite design options. Further progress in 3D woven composites will require full exploitation of such design freedom. It will be a key step change to tailor the 3D fibre architecture to the optimum, with an aim to maximize the weight saving for a specific application. This study presents a numerical approach to optimize 3D woven composites, incorporating the techniques of meso-scale unit cell FE analysis and Genetic Algorithms.
A number of previous studies focused on the optimisation problems in laminate composites design. Ghiasi and co-authors provided an extensive review of optimization methods for two types of laminate composites design problems, namely constant stiffness design and variable stiffness design [1, 2]. Constant stiffness design considers laminate composites as uniform material, which can be represented by one unit cell. Variable stiffness design considers property variations in laminate composites structure, which would require multiple representative unit cells. The present study on optimizing 3D woven composites falls into the category of constant stiffness design, as a single unit cell is sufficient to represent the bulk composite. Whilst laminate composites design benefits from the availability of well-established close-form analytical solutions, no similar analytical tool is available for 3D woven composites. Hence, the gradient based optimization methods, being applied in laminate design, are not feasible in the design of 3D woven composites. Amongst the direct search methods, Genetic Algorithms are one of the most accessible and popular methods, because they are simple and flexible to implement. A recent review on laminate composites design highlighted that Genetic Algorithms suffered problems with computational cost, premature convergence, and dependency on the choice of parameters such as population size [1]. An early study of GA application in 3D woven fabrics was reported in 1995 by Okumura et. al [3]. The 3D woven composites were represented by an assembly of 8 pre-defined sub-cells. Each sub-cell contained one straight yarn in a varied orientation. The design optimization became a combinational problem of sub-cell selections. With a limited number of predefined sub-cells, the three designs resulted from the optimisation did not resemble 3D woven fibre architecture, but were closer to unidirectional laminate and discontinuous long fibre composites. With advancing modelling tools, Bakar and co-workers used more realistic unit cell models generated with TexGen for optimizing 2D woven composites [4]. The reported optimum design was realistic and manufacturable. Yet the study had its limitation in formulation of weave pattern search, which was based on a number of known weave styles. This meant that the design space was not fully explored. The performance of the used Genetic Algorithm was not discussed in this work.
In short, there is very limited knowledge on the formulation and performance of Genetic Algorithms for the constant stiffness design of 3D woven composites. The present study aims to implement a versatile formulation for optimising 3D woven composites. The novel aspects of the proposed formulation are the adaptation of a mixed integer Genetic Algorithm [5] with a micro-population [6], and the parameterization of the unit cell modelling of 3D woven composites [7]. The approach is applied to the optimization of the buckling resistance of an aircraft land gear brace. The study uses statistical tests [8] to quantify the performance of the different Genetic Algorithm schemes and the choice of parameters. The study clearly demonstrates the suitable GA scheme and its parameters that would be computationally efficient in the constant stiffness design of 3D woven composites.
2 OPTIMISATIONFRAMEWORK
2.1 Design space – unit cell
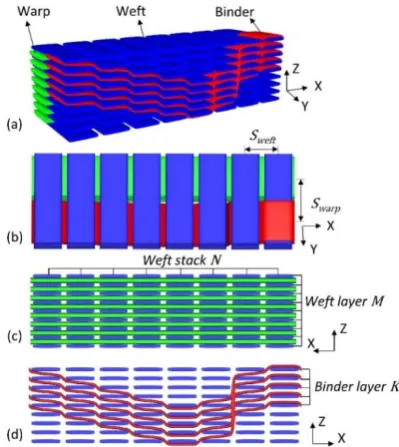
design. Figure 1 (d) shows one of the possible binder paths overcrossing weft yarns in layers 𝑀 = 9 and stacks 𝑁 = 8. The binder yarn path is described here by a binary matrix (𝑀 + 1) × 𝑁, where the value 1 indicates binder overcrossing a weft yarn and the value 0 indicates absence of binder. For example, the binder path in Figure 1 (d)is expressed in a binary matrix 10 × 8. In each column, the number of elements with the value 1 indicates the number of binder layer 𝐾 = 5. The binder path is
𝑃 =
[
0 0 0 0 0 0 0 1 1 0 0 0 0 0 1 1 1 1 0 0 0 0 1 1 1 1 1 0 0 0 1 1 1 1 1 1 0 1 1 1 1 1 1 1 1 1 1 0 0 1 1 1 1 1 0 0 0 0 1 1 1 1 0 0 0 0 0 1 1 1 0 0 0 0 0 0 1 0 0 0]
. (1)
[image:3.595.200.400.394.618.2]Without constraints, the number of unique binary matrices, for example of 𝑃10×8, is 210×8. Many of these matrices do not represent feasible or unique binder paths in 3D woven reinforcements. We apply the following constraints to the matrix P in dimension (𝑀 + 1) × 𝑁, in order to narrow the realistic design space for the optimisation search. Two composites panels will have identical mechanical properties when their binder paths 𝑃1 and 𝑃2 exhibit mirror symmetry, i.e. either 𝑃1(𝑖,𝑗)= 𝑃2(𝑀+1−𝑖,𝑗) or 𝑃1(𝑖,𝑗)= 𝑃2(𝑖,𝑁−𝑗). The number of binder layers 1 ≤ 𝐾 ≤ 𝑀 undulate in the same way. This means the binder tows have the same yarn path relative to each other. To ensure the woven fabric does not fall apart, at least one binder needs to float over the top/bottom surfaces, i.e. at least one element in Row 1 and Row M+1 of the binary matrix P has the value 1.
Figure 1: Design parameters for 3D woven composites
2.2 Optimisation driver – Genetic Algorithms
As described in Section 2.1, the design variables in 3D woven materials are a mixture of integer values (Weft stack, N, Weft layer, M, Binder layer, K, Bind path, P) and real values (yarn space, Sweft
The MI-LXPM algorithm by Deep et. al [5] is briefly introduced here. A general optimisation problem is expressed as:
minimise 𝑓(𝑋, Y),
subject to 𝑔𝑗 (𝑋,Y) ≤ 0, 𝑗=1,..𝐽,
ℎ𝑘 (𝑋, Y) = 0, 𝑘=1,…𝐾, (2)
𝑋𝐿 ≤ 𝑋 ≤ 𝑋𝑈,
Y𝐿 ≤ Y ≤ Y𝑈: integer.
Above, X is a vector of real value variables and Y is a vector of integer value variables. The function 𝒇(𝑋, Y) is the objective function, while 𝑔𝑗 (𝑋,Y) is the j th inequality constraints and ℎ𝑘 (𝑋, Y) is k th
equality constraints. The variable vectors X and Y are in the respective ranges of [𝑋𝐿, 𝑋𝑈] and [Y𝐿, Y𝑈].
The constraints 𝑔𝑗 (𝑋,Y) and ℎ𝑘 (𝑋, Y) in Equation 2 are handled by a parameter-less penalty
function[10]. The equality constraints ℎ𝑘 (𝑋, Y) are converted to inequality constraints by using a tolerance. 𝑔𝑗 (𝑋, Y) and ℎ𝑘 (𝑋, Y) are collectively referred to 𝜙𝑗(𝑋, 𝑌). The penalty applies as
𝑝𝑒𝑛𝑎𝑙𝑡𝑦(𝑋, 𝑌) = {𝑓(𝑋, 𝑌) 𝑖𝑓(𝑋, 𝑌) 𝑖𝑠 𝑓𝑒𝑎𝑠𝑖𝑏𝑙𝑒𝑓
𝑤𝑜𝑟𝑠𝑡 + ∑𝑚𝑗=1|𝜙𝑗(𝑋, 𝑌)| 𝑜𝑡ℎ𝑒𝑟𝑤𝑖𝑠𝑒, (3) where fworst is the objective function value of the worst feasible solution in the current population.
To facilitate an effective search over the design space, each iteration in the genetic algorithm sifts through a fixed number of diversified candidates and carries the fittest candidate(s) to the next generation, evolving towards the optimum solution(s). The iteration involves a set of genetic operators. The MI-LXPM algorithm implements the following operators that requires no parameter input from the user.
Selection applies binary tournament technique [11] to randomly pick two solutions in the current iteration and select the better performing solution for the Laplace crossover operation.
Laplace crossover uses two selected solutions (𝑥1(X, Y), 𝑥2(X, Y) ) in the current iteration to create two new solutions (𝑦1(X, Y), 𝑦2(X, Y) ) for the next iteration. Laplace crossover use a random number
that follows the Laplace distribution:
𝛽𝑖 = {𝑎 − 𝑏 log 𝑢𝑖 𝑟𝑖 ≤ 0.5
𝑎 + 𝑏 log 𝑢𝑖 𝑟𝑖 > 0.5, (4)
where βi is a random number, dependent on random number ui and ri. And 𝑎 is the location parameter
and b >0 is the scaling parameter with integer value if the decision variable is integer otherwise with real value. The crossover results in two new solutions as:
𝑦𝑖1= 𝑥 𝑖 1+ 𝛽
𝑖|𝑥𝑖1− 𝑥𝑖2|
𝑦𝑖2= 𝑥𝑖2+ 𝛽𝑖|𝑥𝑖1− 𝑥𝑖2|. (5)
To ensure the integer restriction for the variables Y, the new solutions 𝑦𝑖 from Equation 5 are truncated to 𝑦̅𝑖.
𝑦̅ = 𝑦𝑖 𝑖, if 𝑦𝑖 is integer; otherwise,
𝑦̅ = {𝑖 [𝑦𝑖]
[𝑦𝑖] + 1, either value with a 50-50 chance, where [𝑦𝑖
Mutation does not apply in the present study, as there is sufficient diversity introduced by using the crossover operator. This is particularly the case for the micro Genetic Algorithm which has a small population.
Elitism warrants a solution 𝑥(𝑋, 𝑌) with the best value of 𝑝𝑒𝑛𝑎𝑙𝑡𝑦(𝑋, 𝑌) calculated from Equation
3 to survive the current iteration onto the next iteration. Elite count is the number of solutions that are allowed to descend to the next iteration. This is an important parameter to be specified by a user. The sensitivity of elite count on the optimization convergence is investigated later in this study.
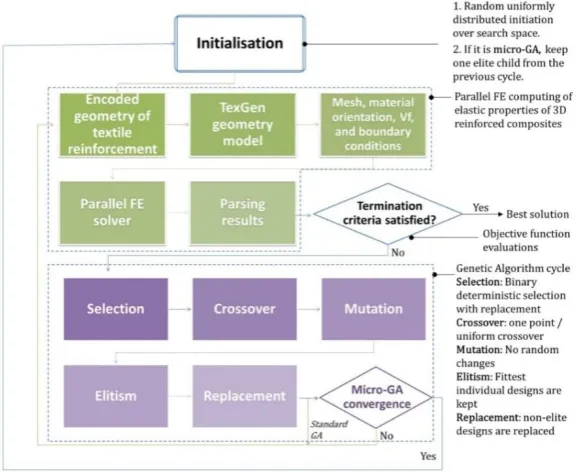
The MI-LXPM genetic algorithm typically requires a large population size (i.e. 15 - 200). To evaluate the objective function for each individual of the population, in the case of 3D woven composites design, the finite element analysis requires a reasonably large amount of computing time and computer memory. Evaluation of the objective function is ideal to be computed in parallel. For a large population size, the parallel computing demands a High Performance Computing cluster. A smaller population size is desirable for running the optimisation task on a desktop workstation. For this reason, we adapt the standard MI-LXPM to a micro-Genetic Algorithm (µGA) with a population of 5 individuals. The adapted µGA scheme applies the same operators described above. With a smaller population, the diversity in the µGA is encouraged by the more frequent population initialisation than the standard MI-LXPM. The population initialisation happens only once at a start point of the standard MI-MI-LXPM. The population is randomly generated obeying a uniform distribution over the entire search space. The evolution of subsequently new populations follows the rules of the described operators. On the other hand, the µGA scheme uses population initialisation in every iteration. The µGA scheme first checks the convergence of the population after going through the operators of selection, Laplace crossover and elitism. If the population is not converged, it keeps only one elite individual, while replacing the rest of the population by the random initialisation. By implementing both the standard MI-LXPM and the µGA schemes, we investigate their comparative performance in Section 4.
Figure 2: Optimisation flow chart for 3D woven reinforcement design
2.3 Comparative evaluation methods on GA performance
In Section 2.2, we introduced two Genetic Algorithm schemes suitable for 3D woven composite designs under a given application. Although the algorithms use the parameter-less genetic operators, users still have to set values of population size and elite count for the standard MI-LXPM. The µGA scheme has these two parameters fixed. Yet, both schemes need to set the stall count as convergence criteria. It becomes important to quantitatively evaluate the different GA schemes and their parameters. Such study ultimately helps non-experienced users to choose a more reliable and efficient algorithm. Non-parametric statistical tests were proposed for comparison of genetic algorithms [8, 13]. We adopt the Sign test and the Wilcoxon signed-rank test in this study because they are easy to perform, sensitive, robust, and suitable for pairwise comparison.
Sign test counts the number of cases on which one algorithm outperforms the other. The number of winning (S) is assumed to be a binomial distribution. Given n as the number of optimisation experiments for each algorithm, the winning algorithm is determined as being significantly better with a p-value < 0.05, if the number of winning is
𝑆 ≥𝑛2+ √𝑛. (6)
Wilcoxon signed-rank test is safe and robust for pairwise comparison, particularly when the distribution of differences between pairs may be non-normally distributed. The test has the hypothesis that the difference (𝑑 = 𝑝1 − 𝑝2) between the members of each pair (𝑝1, 𝑝2) has a median of zero. This implies that the two algorithms perform equally in finding the optimum.
The Wilcoxon signed-rank test starts by ranking the differences (𝑑) regardless to the sign of the difference, i.e. the absolute differences. All zero differences are ignored for the pairs with equal members, 𝑝1= 𝑝2. Subsequently the original signs are affixed to the rank numbers. All pairs with equal absolute differences (ties) get the same rank: all are ranked with the mean of the rank numbers that would have been assigned if they would have been different. All positve ranks (W+) and all negative ranks (W-) are summed and the total number of pairs (N) are determined.The level of significance is listed in
the table of critical Wilcoxon values [14]
by:The test result from Equation 7 will show which of the pairs performs better (sign + and –), if the level of significance is ≤ 0.1. On the other hand, 𝑝 − 𝑣𝑎𝑙𝑢𝑒 ≥ 0.1 would indicate the two algorithms would have the same statistical performance.
3 CASE STUDY
3.1 Problem definition
The selected case study for the 3D woven composites optimisation was inspired by their recently certified application of 3D woven composite in Boeing-787 landing gear braces, as manufactured by
Messier-Dowty
. The braces connect to the rest of the landing gear system by pin joints. The load path of the braces is relatively simple, i.e. compression and tension during normal service conditions. 3D woven composites are employed in the brace design for the advantages of weight saving and corrosion resistance over steel. As the current study is set out in search of optimum material design, with less concern of structural topology, the brace geometry is simplified as a cylinder with constant cross-section, simply supported at both ends.Under compression load, the cylindrical shell may fail either by ultimate material collapse (governed by the compressive strength) or by buckling. The Euler critical load for a simply supported beam under compression is
PEuler =π 2𝐸I
L2 , (8)
where E is the Young’s modulus, I is the moment of cross-sectional area of the brace, and L is the brace length.
For the practical calculation of the buckling limit of an orthotropic composite shell, the Engesser formula gives a close estimation, as suggested in [15, 16]:
PEngesser= PEuler
1+2PEuler/AG, (9)
where 𝐴 is the cross-sectional area of the brace, and 𝐺 is the in-plane shear modulus.
The stability theory by Shanley [17]suggests that the inelastic buckling occurs at the intermediate slenderness ratio due to the influence of transverse shear deformation. For composite materials, the shear modulus has a significant influence on the buckling resistance, as indicated by the Engesser equation (Eq. 9). The buckling performance can also be expressed as a monotonically increasing function of one dimensionless buckling coefficient β [18]:
𝛽 = 𝐷12+2𝐷66
(𝐷11𝐷22)1/2 (10)
where 𝐷𝑖𝑗 are flexural stiffnesses of a composite. 𝛽 is typically smallest for cross-ply laminates while maximum for angle-ply laminates with 45o degree ply angles. It reaches a unit value 1 when the composite is quasi-isotropic. Since a 3D woven reinforce has 0/90 in-plane cross-ply layups, 𝛽 is expected to be smallest. However, with waviness and crimp introduced by binder yarns, the bucking coefficient 𝛽 can increase substantially close to an isotropic material.
3.2 Objective function
An objective function is formulated for a simple design scenario, with constant thickness and fixed in-plane stiffness in weft direction. The optimisation task sets out to maximise the buckling coefficient, with the design variables of binder yarns. It starts with specifying the weft stack 𝑁 = 4, weft layer 𝑀 = 5, and yarn spacing 𝑆𝑤𝑒𝑓𝑡 = 𝑆𝑤𝑎𝑟𝑝 = 1.67 𝑚𝑚, which meets the design brief with constant composites thickness 3.0 mm and weft stiffness 62.9 GPa. The corresponding design space for the binder is expressed as a set of inequality constraints as:
𝐦𝐢𝐧
𝒙 −𝜷(𝒙), (11)
𝑥1+ 2𝑥3≤ 8 𝑥1+ 2𝑥4≤ 8 𝑥1+ 2𝑥5≤ 7 𝑥1+ 2𝑥6≤ 7 ,
and
𝑥1∈ [1,2,3,4] 𝑥2∈ [1,2,3] 𝑥3, 𝑥4, 𝑥5, 𝑥6≥ 0
𝑥1, 𝑥2, 𝑥3, 𝑥4, 𝑥5, 𝑥6 : 𝑖𝑛𝑡𝑒𝑔𝑒𝑟 .
Here β is the buckling dimensionless parameter calculated by Equation 10. The variable 𝑥 is a vector of six geometric variable of 3D weave architecture, i.e.
𝑥1: number of binder layers 𝑥2: binder path
𝑥3 ,𝑥4: Upper binder locations 𝑥5, 𝑥6: Lower binder locations .
4 RESULTS
4.1 Optimisation convergence
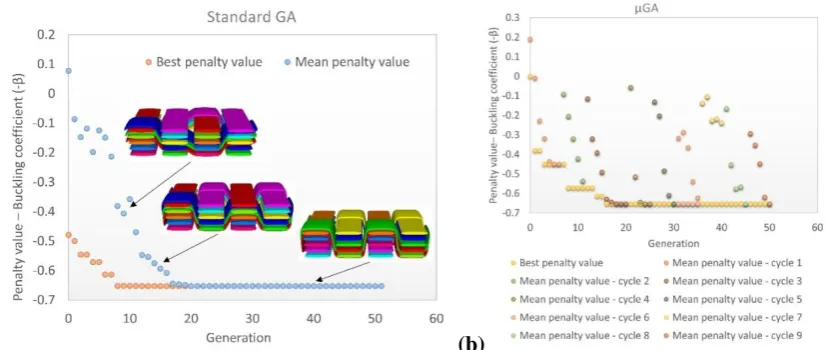
Genetic Algorithms drive the optimisation search based on the penalty value rather than an objective function value (Equation 3). Figure 3 plots the penalty value, buckling coefficient β versus number of generation, indicating the optimisation convergences. The Best penalty value is the elite solution within the current generation, while the Mean penalty value is the average penalty value over the entire current population. The mean penalty value indicates whether the population has no more diversity and the optimum solution is ultimately converged. Figure 3(a) shows that the standard MI-LXPM, with a population size of 15 and a termination criterion after 50 generations, converged to the optimum design within 20 iterations, after assessing 300 out of 7000 permissible designs. Both the best and mean penalty values show a direct decent towards the converged optimum within a small number of generations. When the FE evaluations ran in parallel on a High Performance Computing cluster – each evaluation took 7 minutes, the run time of 20 generations to convergence were 140 minutes. However, on a desktop PC using 5 CPUs, each generation with a population size of 15 required 3 batches of 5 parallel FE analysis. The computational time tripled to 420 minutes. This was the original motivation to implement the µGA with a small population size of 5. Figure 3(b) shows the convergence of the µGA after 42 generations. The required computational time was 294 minutes, which is 43% faster than the standard GA. The µGA had a clear advantage over the standard GA, when the optimisation ran on a desktop PC. A quantitative comparison is presented in Section 4.2 for the robustness of the µGA and the standard GA.
(a) (b)
Figure 3: Convergence of the objective function – buckling coefficient versus the number of generations: (a) the standard genetic algorithm; (b) the micro-genetic algorithm.
4.2 Effect of GA parameters
Examining the response of the objective function, i.e. buckling coefficient, to the variables of the 3D weave architecture revealed that the optimisation problem (Eq. 11) is highly non-linear. The Genetic Algorithms do not guarantee to find the absolute global optimum, when the solution is converged by the end of the optimisation. Hence, the performance of Genetic Algorithms is to assess the likelihood in finding the optimum value(s). Such assessment provides a critical basis to choose a GA scheme and its parametric values for the given optimisation problem. The statistical tests, Sign test and Wilcoxon signed-rank test described in Section 2.3, were applied to quantify the comparative performances of the used GA schemes and their parameters. For each of the standard GA and the µGA with a fixed set of parameters, the study ran 300 repeats of the optimisation procedure, resulting in 300 optimised values of 𝛽. To compare the optimisation performance, two sets of 300 optimum values paired up for Sign test and Wilcoxon signed-rank test.
The unit cell based FE analysis was the most time-consuming component within the optimisation iteration (~7 minutes using Intel i7 CPU 3.20GHz). In order to run 300 repeats of the optimisation procedures at different settings within reasonable time, the FE analyses were completed and tabulated corresponding to each exhaustive 3D weave designs prior the parametric study. During the optimisation iterations, the objective function was evaluated by searching tabulated values according to the design variables, instead of time-consuming FE analyses.
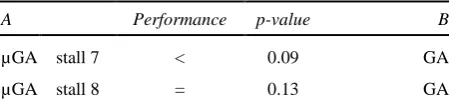
The study compared five pairs of main options in the GA implementation. The results by Sign test is listed in Table 1 and the results by Wilcoxon signed-rank test is listed in Table 2. Both Sign test and Wilcoxon signed-rank test make effective comparisons of the performance of the genetic algorithms. In some cases, Wilcoxon signed-rank test is more sensitive and definitive than Sign test. The comparative study made the following findings. First, the relative performance of the µGA can be inferior, equal or superior to the standard GA, dependent on the convergence criteria – the stall count. Second, the effect of stall count converges to a value of 14 for the µGA. Third, elite count from 1 to 3 does not affect the performance of the standard GA. It shall be noted that elite count of 1 is most effective to preserve population diversity. Fourth, the most efficient stall count is 15 for the standard GA. Fifth, the population size of 28 leads to the performance convergence of the standard GA.
A Wins(>) Loses (<) Level of
significance B
µGAstall 7 133 167 0.05 GA
µGAstall 8 134 166 0.1 GA
µGAstall 10 159 141 - GA
µGAstall 12 165 135 0.1 GA
µGAstall 14 174 126 0.01 GA
µGAstall 16 186 114 0.001 GA
A Wins(>) Loses
(<)
Level of
significance B
µGAstall 2 44 256 0.001 µGA stall 16
µGAstall 3 50 250 0.001 µGA stall 16
µGAstall 4 64 236 0.001 µGA stall 16
µGAstall 5 65 235 0.001 µGA stall 16
µGAstall 6 84 216 0.001 µGA stall 16
µGAstall 7 96 204 0.001 µGA stall 16
µGAstall 8 102 198 0.001 µGA stall 16
µGAstall 9 111 189 0.001 µGA stall 16
µGAstall 10 122 178 0.001 µGA stall 16
µGAstall 12 131 169 0.05 µGA stall 16
µGAstall 14 141 159 - µGA stall 16
A Wins(>) Loses (<) Level of
significance B
GAelite 1 158 142 - GA elite 3
GAelite 2 147 153 - GA elite 3
A Wins(>) Loses (<) Level of
significance B
GAstall 10 150 150 - GA stall 30
GAstall 15 169 131 0.05 GA stall 30
GAstall 20 157 143 - GA stall 30
A Wins(>) Loses (<) Level of
significance B
[image:10.595.185.410.719.773.2]GApopulation 14 64 236 0.001 GA population 32 GApopulation 16 82 218 0.001 GA population 32 GApopulation 18 94 206 0.001 GA population 32 GApopulation 20 109 191 0.001 GA population 32 GApopulation 24 131 169 0.05 GA population 32 GApopulation 28 142 158 - GA population 32
Table 1. Sign test results with a sample size = 300 for A-vs-B paired optimisation parameters: µGA vs GA, stall count in µGA, elite count in GA, stall count in GA and population size in GA.
A Performance p-value B
µGA stall 7 < 0.09 GA
µGA stall 9 = 0.98 GA
µGA stall 10 > 0.08 GA
µGA stall 12 > 0.002 GA
µGA stall 14 > <0.001 GA
µGA stall 16 > <0.001 GA
A Performance p-value B
µGA stall 2 < <0.001 µGA stall 16 µGA stall 3 < <0.001 µGA stall 16 µGA stall 4 < <0.001 µGA stall 16 µGA stall 5 < <0.001 µGA stall 16 µGA stall 6 < <0.001 µGA stall 16 µGA stall 7 < <0.001 µGA stall 16 µGA stall 8 < <0.001 µGA stall 16 µGA stall 9 < <0.001 µGA stall 16 µGA stall 10 < <0.001 µGA stall 16 µGA stall 12 < 0.005 µGA stall 16
µGA stall 14 = 0.19 µGA stall 16
A Performance p-value B
GA elite 1 = 0.13 GA elite 3
GA elite 2 = 0.75 GA elite 3
A Performance p-value B
GA stall 10 = 0.99 GA stall 30
GA stall 15 > 0.08 GA stall 30
GA stall 20 = 0.44 GA stall 30
A Performance p-value B
[image:11.595.179.410.72.672.2]GA population 14 < <0.001GA population 32 GA population 16 < <0.001GA population 32 GA population 18 < <0.001GA population 32 GA population 20 < <0.001GA population 32 GA population 24 < 0.003 GA population 32 GA population 28 = 0.37 GA population 32
Table 2. Wilcoxon signed-rank test results with a sample size = 300 for A-vs-B paired optimisation parameters: µGA vs GA, stall count in µGA, elite count in GA, stall count in GA and population size
in GA. The symbols “<” and “>” indicate clear winning performance by one parametric setting over the other, with a level of significance ≤0.1, while “=” indicates little statistical difference between the
5 CONCLUSIONS
The study successfully implemented an optimization framework for constant stiffness design of 3D woven composites. A mixed range of real and integer parameters enabled to generate realistic geometric unit cell model of 3D woven composites in TexGen. Automated TexGen interface with the solver ABAQUS made it computationally efficient to evaluate the relationship between 3D woven fibre architecture and the elastic properties of 3D woven composites. A case study set to optimize the buckling efficient of 3D woven composites in a landing gear brace. The MI-LXPM Genetic Algorithm and its adaptation to a micro-population proved to be efficient and robust, as the Sign test and Wilcoxon signed-rank test assessed the performance of the Genetic Algorithms in the case study. The optimized 3D woven composites improved the buckling coefficient by doubling that of cross-ply composites, and 50% higher than that of conventional 3D orthogonal woven composites.
ACKNOWLEDGEMENTS
This work was supported by the Engineering and Physical Sciences Research Council - United Kingdom [grant number: EP/IO33513/1], through the Fellowship at EPSRC Centre for Innovative Manufacturing in Composites.
REFERENCES
[1] Ghiasi H, Pasini D, Lessard L. Optimum stacking sequence design of composite materials Part I: Constant stiffness design. Composite Structures. 2009;90(1):1-11.
[2] Ghiasi H, Fayazbakhsh K, Pasini D, Lessard L. Optimum stacking sequence design of composite materials Part II: Variable stiffness design. Composite Structures. 2010;93(1):1-13.
[3] Okumura T, Yokoyama A, Nagai K, Maekawa Z. Optimum design of weaving structure of 3-D woven fabric composites by using genetic algorithms. Composite Structures. 1995;32(1–4):417-26.
[4] Abu Bakar IA, Kramer O, Bordas S, Rabczuk T. Optimization of elastic properties and weaving patterns of woven composites. Composite Structures. 2013;100(0):575-91.
[5] Deep K, Singh KP, Kansal M, Mohan C. A real coded genetic algorithm for solving integer and mixed integer optimization problems. Applied Mathematics and Computation. 2009;212(2):505-18.
[6] Coello Coello Coello C, Toscano Pulido G. A Micro-Genetic Algorithm for Multiobjective Optimization. In: Zitzler E, Thiele L, Deb K, Coello Coello C, Corne D, editors. Evolutionary Multi-Criterion Optimization: Springer Berlin Heidelberg; 2001. p. 126-40.
[7] Zeng XS, Brown LP, Endruweit A, Matveev M, Long AC. Geometrical modelling of 3D woven reinforcements for polymer composites: Prediction of fabric permeability and composite mechanical properties. Compos Part a-Appl S. 2014;56:150-60.
[8] Derrac J, García S, Molina D, Herrera F. A practical tutorial on the use of nonparametric statistical tests as a methodology for comparing evolutionary and swarm intelligence algorithms. Swarm and Evolutionary Computation. 2011;1(1):3-18.
[9] Li S, Zhou C, Yu H, Li L. Formulation of a unit cell of a reduced size for plain weave textile composites. Computational Materials Science. 2011;50(5):1770-80.
[10] Deb K. An efficient constraint handling method for genetic algorithms. Computer Methods in Applied Mechanics and Engineering. 2000;186(2):311-38.
[11] Goldberg DE, Deb K. A comparative analysis of selection schemes used in genetic algorithms. Urbana. 1991;51:61801-2996.
[12] Doitrand A, Fagiano C, Irisarri FX, Hirsekorn M. Comparison between voxel and consistent meso-scale models of woven composites. Composites Part A: Applied Science and Manufacturing. 2015;73(0):143-54. [13] Badalló P, Trias D, Marín L, Mayugo JA. A comparative study of genetic algorithms for the multi-objective optimization of composite stringers under compression loads. Composites Part B: Engineering. 2013;47(0):130-6. [14] Zar J. Biostatistical Analysis. 2010.
[15] KARDOMATEAS GA, SIMITSES GJ. Comparative studies on the buckling of isotropic, orthotropic, and sandwich columns. Mechanics of Advanced Materials and Structures. 2004;11(4-5):309-27.
[16] Beghini A. Which formulation allows using a constant shear modulus for small-strain buckling of soft-core sandwich structures? Journal of applied mechanics. 2005;72(5):785-7.
[17] Gere JM. Mechanics of Materials: Brooks/Cole; 2004.