Modelling the coupling between intracellular calcium release
and the cell cycle during cortical brain development
Duncan S. Barrack
a,b,n, Rüdiger Thul
b, Markus R. Owen
b aHorizon Digital Economy Research Institute, University of Nottingham, Nottingham NG7 2TU, UK
bSchool of Mathematical Sciences and Centre for Mathematical Medicine and Biology, University of Nottingham, Nottingham, UK
H I G H L I G H T S
We present a new model for ATP mediated coupling of calcium and cell cycle dynamics.
Bifurcation analysis shows region of multistability offixed points and limit cycles.
Continuation and simulations reveal weak dependence of cell cycle period on calcium.
Multistability allows cycling cells to recruit quiescent cells onto the cell cycle.
Such recruitment could explain observed increases in cell proliferation rate.
a r t i c l e i n f o
Article history:
Received 5 April 2013 Received in revised form 28 November 2013 Accepted 3 January 2014 Available online 13 January 2014
Keywords:
Cell cycle Calcium dynamics Radial glial cells Bifurcation analysis
a b s t r a c t
Most neocortical neurons formed during embryonic brain development arise from radial glial cells which communicate, in part, via ATP mediated calcium signals. Although the intercellular signalling mechan-isms that regulate radial glia proliferation are not well understood, it has recently been demonstrated that ATP dependent intracellular calcium release leads to an increase of nearly 100% in overall cellular proliferation. It has been hypothesised that cytoplasmic calcium accelerates entry into S phase of the cell cycle and/or acts to recruit otherwise quiescent cells onto the cell cycle. In this paper we study this cell cycle acceleration and recruitment by forming a differential equation model for ATP mediated calcium-cell cycle coupling via Cyclin D in a single radial glial calcium-cell.
Bifurcation analysis and numerical simulations suggest that the cell cycle period depends only weakly on cytoplasmic calcium. Therefore, the accelerative impact of calcium on the cell cycle can only account for a small fraction of the large increase in proliferation observed experimentally. Crucially however, our bifurcation analysis reveals that stablefixed point and stable limit cycle solutions can coexist, and that calcium dependent Cyclin D dynamics extend the oscillatory region to lower Cyclin D synthesis rates, thus rendering cells more susceptible to cycling. This supports the hypothesis that cycling glial cells recruit quiescent cells (in G0phase) onto the cell cycle, via a calcium signalling mechanism, and that this may be the primary means by which calcium augments proliferation rates at the population scale. Numerical simulations of two coupled cells demonstrate that such a scenario is indeed feasible.
&2014 Elsevier Ltd. All rights reserved.
1. Introduction
Radial glial cells are transient cells, only present in the mammalian brain for a brief period during embryonic develop-ment. During this time they give rise to neurons (Noctor et al., 2001) and in doing so play a major role in the development of the neocortex. A recent study reveals that calcium waves which propagate through the ventricular zone of the embryonic brain enhance radial glial cell proliferation (Weissman et al., 2004). In this study Weissman et al. hypothesised that ATP mediated
calcium release in radial glia may accelerate G1 progression of the cell cycle and/or act to recruit cells otherwise destined to enter the G0resting phase on to the cell cycle.
The radial glial cell cycle, like that of any eukaryotic cell, can be broken down into several phases (Murray and Hunt, 1993). G1 phase is the period of greatest growth and is the longest phase, approximately half the total cell cycle period in most cell types. It is when a cell pauses during G1that it enters the quiescent state, G0. Otherwise, G1 is followed by S phase, during which DNA replication occurs, and then G2, during which the cell prepares for mitosis (M phase). Shortly after M phase, the parent cell separates into two daughter cells, completing the cell cycle.
The cell cycle is controlled by a large number of biochemical regulators including Cyclins and Cyclin dependent kinases (Cdks). Cdks phosphorylate target proteins when paired up with respective Contents lists available atScienceDirect
journal homepage:www.elsevier.com/locate/yjtbi
Journal of Theoretical Biology
0022-5193/$ - see front matter&2014 Elsevier Ltd. All rights reserved.
http://dx.doi.org/10.1016/j.jtbi.2014.01.004
nCorresponding author at: Horizon Digital Economy Research Institute, University
of Nottingham, Nottingham NG7 2TU, UK. Tel.:þ44 115 8232554.
E-mail address:[email protected](D.S. Barrack).
Cyclin partners. Phosphorylated proteins facilitate numerous cell cycle events including DNA replication and chromosome condensa-tion. There is usually a constant amount of Cdks during the cell cycle and consequently Cdk activity is highly dependent upon the avail-ability of their Cyclin partners which are produced and degraded as needed (Nigg, 1995).
Numerous studies using different cell types suggest that the activity of Cyclin D, which plays a crucial role in driving the cell through G1(Baldin et al., 1993) and towards S phase, increases in the presence of active calcium/calmodulin dependent kinases (CaMK) (Kahl and Means, 2003, 2004; Morris et al., 1998; Tombes et al., 1995; Rasmussen and Rasmussen, 1995) and this is thought to be a major pathway by which intracellular calcium release can affect the cell cycle. Calcium, via CaMK, can also aid M phase entry and progression by increasing the activity of the cell cycle phosphatase Cdc25 at the G2/M phase transition (Patel et al., 1999; Swanson et al., 1997; Kahl and Means, 2003) or by indirectly affecting Cdk1 activity during M phase (Suprynowicz et al., 1994). In radial glia, calcium release is initiated by the binding of extracellular adenosine triphosphate (ATP) to P2Y1 receptors, which leads, via a G-protein cascade, to inositol 1,4,5-trispho-sphate (IP3) mediated calcium release from the endoplasmic reticulum (ER) into the cytosol (Weissman et al., 2004). ATP is released from cells through hemichannels (Li et al., 1996) which allow for molecular transport between the cytosol and the extra-cellular space. Hemichannels, formed via the separation of gap junctions between adjacent cells, assemble sometime between G1 and early S phase (Bittman and LoTurco, 1999; Goto et al., 2002; Weissman et al., 2004). InFig. 1, we summarise how ATP leads to the release of calcium in radial glia and the effect of calcium on G0 and G1phases of the cell cycle.
AlthoughWeissman et al. (2004)did not measure directly the increase in cell proliferation rate in the presence of ATP mediated calcium signalling, their results allow us to obtain an estimate for the increase. In their experiments, Bromodeoxyuridine (BrdU) was added to cultures of radial glia which had been exposed to suramin over an observation period of one hour. BrdU, which is incorporated into DNA by cycling cells during S phase, serves as a
marker of proliferation. Suramin, an ATP receptor antagonist, acted to abolish ATP mediated calcium release in radial glial. Weissman et al. observed that, during the hourly period, the proportion of cells labelled with BrdU (and hence having entered S Phase) was 54.7% that of the case where the ATP receptors of cells were allowed to function as normal. Therefore 45.3% of the cells which entered S phase during the hourly observation period for the case with normally functioning ATP receptor activity would not have done so if it were not for ATP mediated calcium. Under the assumption that the number of cells which have entered S phase over a short period of time can be used as a proxy for the radial glial proliferation rate, this corresponds to an increase of 82.8% (45.3/54.7) in the rate of proliferation brought about by ATP mediated calcium. An approximate doubling in cellular prolifera-tion rate of radial glia is consistent with other studies conducted on neural progenitor cells. In particular, Mishra et al. (2006) demonstrated that, over a 7 day period, the total cell count of wild type murine sub-ventricular zone progenitor cells in which ATP mediated calcium release was permitted was approximately double that of cells in which P2Y1ATP receptors were knocked out. In this paper, to investigate how calcium signals lead to an increase in overall cellular proliferation, we couple an existing cell cycle model to a modified model for ATP mediated calcium release. We consider two forms of coupling in order to capture different ATP release patterns. Furthermore, because calcium spikes are rapid compared to the period of cell cycle oscillations, we incorporate time averaged calcium dynamics into the model (See Appendix Afor details). Although several deterministic models of the cell cycle exist (seeCsikász-Nagy, 2009for an excellent review) and more recently a number of models for ATP mediated calcium signalling in astrocytes have been developed (Bennett et al., 2005; Stamatakis and Mantzaris, 2006; Wang et al., 2007), to our knowledge, ours is the first model which couples cell cycle dynamics to mechanistic calcium release (but seeDupont, 1998 for a model that couples prescribed calcium spikes to meiotic cell division). Analysis of our model suggests that the modulations in cell cycle period brought about by calcium can only account for a small proportion of the increase in cellular proliferation observed experimentally. However, bifurcation results and simulation results of two cell systems indicate that the possibility for cycling cells to recruit quiescent cells onto the cell cycle via ATP mediated calcium release is viable and this process could be the dominant mechanism by which intracellular calcium impacts proliferation rates within a population of cells.
The paper is structured as follows. InSection 2, we present the single cell model and inSection 3we study the dynamics of it via bifurcation analysis and numerical simulations. We conclude with a discussion inSection 4.
2. Model formulation
We couple the model of Obeyesekere et al. (1999) for the mammalian cell cycle to an adapted version of the model of Bennett et al. (2005)for ATP mediated calcium release, to form a model for coupled calcium-cell cycle dynamics in a single non-differentiating radial glial cell. The cell cycle model of Obeyesekere et al. is given by
dD
dt¼adGFdDED; ð1Þ
dE
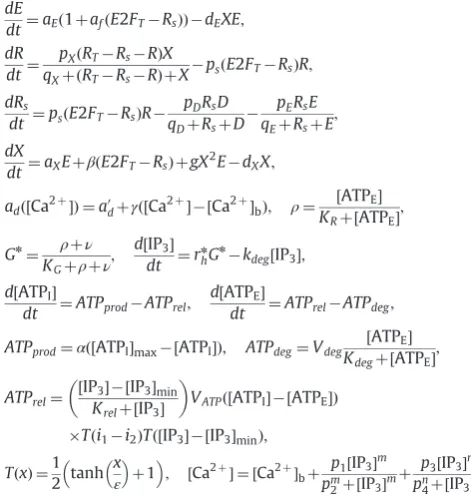
dt¼aEð1þafðE2FTRsÞÞdEXE; ð2Þ
dR
dt¼
pXðRTRsRÞX
qXþðRTRsRÞþX
psðE2FTRsÞR; ð3Þ
ATP Store Ca2+ Store GTP GDP PLC Ca2+ G G1 S M G2 H emich
annel opening P2Y1
G0
ATP ATP
[image:2.595.69.249.470.638.2]IP3
Fig. 1.Schematic illustration of how ATP causes calcium to be released and how
dRs
dt ¼psðE2FTRsÞR
pDRsD
qDþRsþD
pERsE
qEþRsþE; ð
4Þ
dX
dt¼aXEþβðE2FTRsÞþgX
2E
dXX: ð5Þ
In this system of ordinary differential equations (ODEs),DandE are, respectively, the average concentrations of active Cyclin D/Cdk4 and Cyclin E/Cdk2 dimers. Cdks are assumed to be available in abundance and as soon as Cyclins are produced they bind to their respective Cdk partners (henceforth, we use the phrases‘active Cyclin’and‘active Cyclin/Cdk dimers’ interchange-ably).R is retinoblastoma tumour suppressor protein (RB) in its unphosphorylated form andRsis RB bound to the E2F transcrip-tion factor. Like the Cdks, the total concentratranscrip-tions of RB (RT) and E2F (E2FT) are assumed to be constant throughout the cell cycle.X is the‘cell progression indicator’(CPI) which indirectly represents the kinases, phosphatases and proteases responsible for driving the cell through the S, G2 and M phases of the cell cycle. In lumping together various cellular processes in this manner, the dimensionality of the model can be reduced without loosing too much accuracy.
In Eq.(1), growth factor activity (GF) (Aktas et al., 1997; Sherr, 1994) stimulates Cyclin D production with rate parameter ad and, based on evidence that Cyclin/Cdk complexes can promote Cyclin degradation in G1(Lanker et al., 1996), it is assumed that Cyclin E indirectly promotes Cyclin D degradation with rate constantdD. This latter assumption is consistent with experiments showing that Cyclin E/Cdk2 can phosphorylate the Cdk inhibitor p27kip1, marking it for degradation (Sheaff et al., 1997). As p27kip1is an essential activator of
Cyclin D dependent kinases (Cheng et al., 1999), Cyclin E/Cdk2 can indirectly inhibit Cyclin D/Cdk4 activity via this pathway. In Eq.(2), free E2F (E2FTRs), liberated from RB/E2F complexes, acts to promote Cyclin E production with rate parameters aE and af and the CPI degrades Cyclin E with rate constant dE. The terms in Eqs. (3) and (4) represent dephosphorylation of RB and binding of unphosphorylated RB to the E2F transcription factor. In Eq.(3)the CPI dephosphorylates RB according to Michaelis–Menten type kinetics with maximum rate parameterpXand Michaelis constant qX. In Eq.(4)both active Cyclin D and active Cyclin E phosphorylate RB with maximum rate parameters pD and pE respectively and Michaelis constantsqDandpErespectively. Although Cyclin D and Cyclin E phosphorylate free RB which is not in a complex with E2F as well these pathways are not included in the model and their omission has no effect on the results of the cell cycle model (Obeyesekere et al., 1999). Additionally, in Eq.(4)RB/E2F (Rs) forms via binding of free E2F to RB with rate constantps. In Eq.(5), the CPI, which decays at ratedX, is produced in response to Cyclin E (with rate parameteraX), free E2F (with rate parameter β) and, in an auto-catalytic manner, by itself and active Cyclin E (with rate parameterg). We chose the model of Obeyesekere et al. primarily because it includes Cyclin D (a key target of CaMK signalling). In addition this model is low dimensional which renders it an ideal starting point for coupling cell cycle and intracellular calcium dynamics for the
first time. To the best of our knowledge the only other models which incorporate Cyclin D are due toNovak and Tyson (2004), Swat et al. (2004), Chauhan et al. (2008, 2011), Gérard and Goldbeter (2009)and Pfeuty (2012). However these models are significantly more complex. For example the model by Novak and Tyson has more than four times as many variables and three times as many parameters as the model of Obeyesekere et al. and the model by Gérard and Goldbeter has nearly eight times as many variables and more than nine times as many parameters. The model of Chauhan et al. includes regulatory pathways specific to mammalian liver damage and because of this it is not a suitable model for the radial glial cell cycle.
As there is evidence that calcium, via the activation of CaMK, increases Cyclin D activity in several cell types (Kahl and Means, 2003, 2004; Morris et al., 1998; Tombes et al., 1995; Rasmussen and Rasmussen, 1995) we make Cyclin D synthesis an increasing function of calcium in the cell. In addition calcium interacts with other cell cycle proteins such as Cdc25 (Patel et al., 1999; Kahl and Means, 2003) and Cdk1 (Suprynowicz et al., 1994). However we do not consider the impact of calcium on these proteins here as their effect is either felt at the entry to, or during M phase and the focus of this work is on the effect of calcium on the G0/G1 and G1/S transitions in radial glia. For these transitions, Cyclin D which drives G1 progression is the key cell cycle protein. We use the following coupling for calcium and the Cyclin D synthesis rate termadfrom Eq.(1):
adð½Ca2þÞ ¼a0dþγð½Ca
2þ½Ca2þ
bÞ: ð6Þ
In this expression γ is the strength of the coupling to the intracellular calcium concentration and ½Ca2þ
b is a constant
representing the steady state cytosolic concentration of calcium for the calcium release model (Eq.(15)).
On the grounds that radial glial cells and astrocytes share many molecular and cellular characteristics (Gotz and Barde, 2005), such as ATP dependent intracellular calcium release (Fam et al., 2003; Hung and Colicos, 2008), we model ATP mediated calcium release in radial glia by adapting the model ofBennett et al. (2005)for ATP mediated calcium waves in astrocytes. In the model of Bennett et al. extracellular ATP receptor and G-protein activity are described by
ρ¼ ½ATPE
KRþ½ATPE
and Gn¼Kρþν
Gþρþν: ð
7Þ
In Eq.(7),ρis the fraction of bound P2Y1receptors,½ATPEthe
concentration of extracellular ATP andKRthe dissociation constant for ATP receptor binding.Gnis the proportion of active G-protein, ν is the background G-protein activation in the absence of ATP and KG is the dissociation constant. IP3 and ATP dynamics are modelled by
d½IP3
dt ¼r
n
hGnkdeg½IP3; ð8Þ
d½ATPI
dt ¼ATPprodATPrel; ð9Þ
d½ATPE
dt ¼ATPrelATPdeg: ð10Þ
In this set of ODEs,rn
handkdegare, respectively, the production and degradation rates of IP3 (½IP3). ATPprod, an addition to the original model of Bennett et al. in which intracellular ATP production is not considered, is the production of intracellular ATP (½ATPI).ATPrelis the ATP release into extracellular space and ATPdeg the degradation of extracellular ATP. The expressions for these three terms are given by
ATPprod¼αð½ATPImax½ATPIÞ; ð11Þ
ATPdeg¼Vdeg ½
ATPE
Kdegþ½ATPE; ð
12Þ
ATPrel¼ ½
IP3½IP3min
Krelþ½IP3
VATPð½ATPI
½ATPEÞTði1i2ÞTð½IP3½IP3minÞ: ð13Þ
In Eq. (11), α is the rate constant for ATP production and
½ATPImaxthe maximum intracellular concentration of ATP. Eq.(12)
describes extracellular ATP degradation which is modelled accord-ing to Michaelis–Menten kinetics with parametersVdeg andKdeg. Following experimental evidence (Bennett et al., 2005) the
ð½IP3½IP3minÞ=ðKrelþ½IP3Þ term from Eq.(13) ensures that ATP
release is dependent upon IP3with a sensitivity concentration of Krel.ð½ATPI½ATPEÞmodels passive transport through open
hemi-channels and VATP is the rate constant for ATP release when hemichannels are open. In keeping with the model of Bennett et al., the IP3concentration must exceed a threshold value½IP3min
before ATP is released. For our model, we introduce the functionT into Eq.(13)to model both switch-like IP3dependent ATP release and switch-like hemichannel opening, withTdefined by
TðxÞ ¼1
2 tanh x ε þ1
; ð14Þ
whereεis a stiffness parameter. In Eq.(13),i1andi2are either the concentration, or the parameter representing the critical concen-tration, of one of the cell cycle variables from(1)–(5). Ifi1(resp. i2) is a variable, then hemichannel opening and subsequent ATP release occurs when that variable exceeds (falls below) a threshold parameteri2(i1). As different proteins peak and dip at different times during the cell cycle, the choice of i1 andi2 allows us to model ATP release at specific times.
Evidence from the literature suggests that hemichannel open-ing and consequent ATP release occurs in G1or S phase of the cell cycle. With this in mind, we consider two model variants. In the
first variant, ATP release occurs towards mid G1phase, and in the second, release occurs later, towards the G1/S phase transition. As Cyclin D peaks during G1phase before dropping off in S phase in the mammalian cell cycle (Chen et al., 2005; Stacey, 2003; Yang et al., 2006), we model ATP release during mid G1phase by setting i1¼Dandi2¼Dcin Eq.(13), whereDcis the critical concentration of Cyclin D which must be exceeded for ATP to be released. We refer to this model as the‘Cyclin D dependent ATP release model variant’. Late G1 phase is associated with low concentrations of bound RB/E2F (Greenblatt, 2005; Sinal and Woods, 2005; Veylder et al., 2003), so we model the release of ATP at the G1/S transition by choosing i1¼Rsc and i2¼Rs, where Rsc is the critical Rs concentration below which ATP is released. We refer to this as the‘Rsdependent ATP release model variant’.
Bennett et al. use a model for calcium release originally developed by Li and Rinzel (1994)where IP3 stimulates intracellular calcium release. As extracellular calcium does not contribute to calcium elevations in radial glia (Weissman et al., 2004), this model is sufficient to describe calcium dynamics in our study. In the calcium release model, for certain parameter values, release is oscillatory with period of oscillation of the order of seconds. Such a time scale is consistent with the oscillatory period of calcium release in radial glia (Weissman et al., 2004). However, in this paper we are interested in the effect calcium has on the cell cycle which has a period of oscillation of the order of tens of hours. Because of this, and for the reason that no process is slaved to the fast calcium oscillations, as detailed inAppendix A, we replace oscillatory calcium release with a functional fit to give the following expression for IP3 dependent calcium release from the ER:
½Ca2þ ¼ ½Ca2þbþ
p1½IP3m
pm
2þ½IP3mþ
p3½IP3n
pn
4þ½IP3n: ð
15Þ
This simplification gives a considerable saving in computational simulation time, but minimal loss of accuracy, as illustrated in Appendix A.
To summarise the dynamics outlined above, theTði1i2Þterm
in Eq. (13)regulates hemichannel opening and ATP release. The point during the cell cycle at which this occurs is determined by the cell cycle variables, whose dynamics are governed by Eqs.(1)– (5). Extracellular ATP leads to an increase in the number of bound receptors (ρ in Eq. (7)), which in turn leads to an increase in G-protein activity (Gnin Eq.(7)). This results, via IP3production (Eq.(8)), in the release of calcium from internal stores (Eq.(15)).
Cytosolic calcium then acts to increase Cyclin D activity (Eq.(6)). ATP release is triggered by one of the cell cycle variables either exceeding or falling below a critical value (Eq. (13)) and the process begins anew. For readability the model equations are reproduced in Appendix B. The model is also publicly available for download in SMBL format from the BioModels database (BioModels ID: MODEL1401200000 and MODEL1401200001). A wiring diagram of all model variables is included inAppendix C and inAppendix Dwe provide the parameter values used in our model with details of their derivation.
3. Model analysis
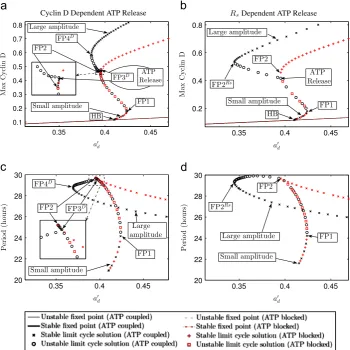
In this section, we subject both model variants to bifurcation analysis and numerical simulations in order to uncover their dynamics. We begin by conducting bifurcation analysis using the intrinsic Cyclin D synthesis ratea0d as the control parameter. a0d plays a crucial role in our model as it affects the frequency of oscillation of the cell cycle and can control whether the model oscillates at all.Fig. 2shows bifurcation diagrams for the Cyclin D dependent ATP release and Rs dependent ATP release model variants for coupled ATP mediated calcium-cell cycle dynamics in a single radial glial cell (black symbols). We refer to this version as the ‘ATP coupled’ case. For purposes of comparison, an uncoupled cell cycle model without ATP mediated calcium-cell cycle coupling (achieved by setting the value for extracellular ATP ([ATPE]) to 0) is also included (red symbols). We refer to this version as the‘ATP blocked’case and regard it as equivalent to the case in the experiment conducted by Weissman et al. (2004) where ATP receptor activity of radial glia was suppressed through the exposure of cells to suramin. We also note that the ATP blocked case is equivalent to the original cell cycle model of Obeyesekere et al. (1999). By comparing the cell cycle period of the ATP blocked case to the period of the model for the ATP coupled case, we will be able to determine the effect calcium has on the cell cycle period and, in turn, on the cellular proliferation rate of radial glia. For the ATP blocked case a supercritical Hopf bifurcation (HB) ata0
d0:410 leads to the creation of stable small amplitude oscillations. These are connected to a branch of stable large amplitude oscillations, with higher Cyclin D concentrations, via two saddle node bifurcations (FP1 at a0d0:424 and FP2 at a0d0:395). For the Cyclin D dependent ATP release variant of the ATP coupled case (Fig. 2(a and c), black symbols) additional pairs of saddle node bifurcations (FP3D at a0
d0:396 and FP4
D at
a0
d0:385) are created on the stable large amplitude solution branch. ForRsdependent ATP release (Fig. 2(b and d)), the saddle node bifurcation point from which large amplitude oscillations emerge occurs at a lower value fora0
d(FP2
Rsata0
d0:345) than is the case for the ATP blocked case. The pattern of behaviour for the Cyclin D dependent ATP release model variant, where additional pairs of saddle node bifurcations are present (FP3Dand FP4D), can also be seen for the Rs dependent variant. Which form is seen depends on whether ATP release begins on the unstable branch of oscillatory solutions between FP1 and FP2 or branch of stable solutions beyond FP2. Only when a cell is on the branch of large amplitude limit cycle solutions can it be regarded as cycling (Obeyesekere et al., 1999).
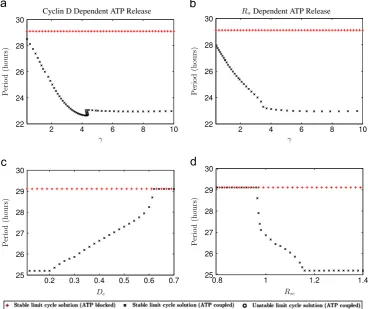
proliferation brought about by ATP mediated calcium release of only 6.63% (i.e. 1.81/27.29) and 8.38% (2.25/26.85) respectively. In order to investigate more deeply the impact of calcium on cell cycle period we investigate how the period of oscillation of the large amplitude limit cycle solutions inFig. 2depends upon the calcium coupling strengthγand the critical concentrations,Dcand Rsc, at which ATP is released in both model variants. Bifurcation results are shown inFig. 3and, for all cases, the cell cycle period either has a local minimum (Fig. 3(a) at γ4:25 h1μM1) or reaches an asymptotic value (Fig. 3(b–d)). For the parameter ranges illustrated in Fig. 3 the minimum cell cycle period is approximately 22.6 (a), 23.0 (b), 25.2 (c) and 25.2 (d) h. This represents a decrease in cell cycle period compared to the ATP blocked case of 6.5 (22:2%), 6.1 (21:1%), 3.9 (13:4%), 3.9 (13:4%) h respectively. However, for all these cases, such extreme parameter values lead to the saturation of the extracel-lular space with ATP for the entire, or almost the entire, period of the cell cycle. This is physically unrealistic as a constantly high ATP concentration is inconsistent with evidence from studies con-ducted on astrocytes in which it was demonstrated that the concentration of extracellular ATP rises and falls during the cell cycle according to a circadian rhythm (Womac et al., 2009; Marpegan et al., 2011).
In order to obtain an increase in the proliferation rate of 82.8% with ATP coupling, a reduction in cell cycle period of 45.3%
compared to the ATP blocked case would be required. Therefore, when compared to the experimental work of Weissman et al. (from which the 82.8%figure was obtained) it becomes apparent that, for the results ofFig. 3, the decrease in period of cell cycle oscillations brought about by calcium can only, by itself, account for a small proportion of the experimentally observed large increase in overall cellular proliferation. However, the bifurcation results inFig. 2(a and b) are consistent with the hypothesis that cycling cells may induce quiescent cells onto the cell cycle and this could be the primary means by which calcium signalling augments cellular proliferation. In particular, fromFig. 2(a and b), it can be seen thatfixed point solutions (which correspond to the quiescent G0state (Obeyesekere et al., 1999)) and high amplitude limit cycle solutions (which correspond to the cycling state) coexist. ATP release from a cycling cell could induce calcium release in a dormant cell in G0. Provided the calcium signal is of sufficient strength it could lift the quiescent cell onto the branch of limit cycle solutions. This could, in turn, lead to a large increase in cellular proliferation. We discuss this possibility further later in this section.
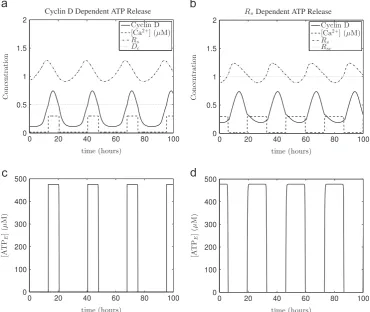
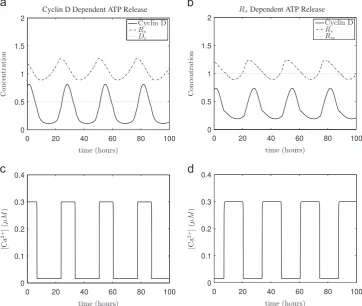
[image:5.595.127.478.58.408.2]Next, to illustrate the large amplitude limit cycle solutions detected by the bifurcation analysis, we present the results of numerical simulations inFig. 4. Oscillations in the model variables are clearly identifiable. ATP release duration is approximately 7.6 h in the Cyclin D dependent variant and approximately 13.7 h for the
Fig. 2.Bifurcation diagrams of system(1)–(15)for ATP mediated calcium-cell cycle coupling in single radial glia showing maximum Cyclin D concentration and period of
oscillation of limit cycle solutions as a function of the intrinsic Cyclin D synthesis ratea0
d. (a, c) correspond to the Cyclin D dependent ATP release model variant ðði1;i2Þ ¼ ðD;DcÞÞand (b, d) to theRsdependent ATP release model variantðði1;i2Þ ¼ ðRsc;RsÞÞ. Superimposed on all plots are the results for the ATP blocked case with no ATP mediated calcium-cell cycle coupling (achieved by setting½ATPE ¼0). FP1, FP2, FP3D, FP4Dand FP2Rscorrespond to fold or saddle node bifurcation points, while HB corresponds to a Hopf bifurcation point. Points at which ATP is released in both variants are also indicated. Note, in (a) release, which occurs on the branch of unstable limit cycle solutions, is coincident with the bifurcation point FP3D. The insets in (a, c) show details around FP2 and FP3D. Parameter values as inTables D1–D3except fora0
dwhich is as shown. (For interpretation of the references to colour in the text, the reader is referred to the web version of this paper.)
Rsdependent model variant. Although the literature is bereft of studies on the duration of ATP release in radial glia, studies of astrocytes suggest that ATP release can last from approximately 6 to 14 h (Womac et al., 2009; Marpegan et al., 2011), which is consistent with the aforementioned results for our model. The results inFig. 4also serve to illustrate that the timing and duration of ATP mediated calcium release differ between both variants. Although it is possible to vary parameter values so that the duration of ATP and calcium release is identical in both model variants, this will not yield identical cell cycle periods. Because the impact of calcium on the cell cycle dynamics is nonlinear, as well as duration, the timing of calcium release influences the dynamics. To illustrate the nonlinear effect of calcium, inFig. 5is shown an example where different underlying calcium dynamics give the same global response in the model. In particular, the duration of ATP mediated calcium release differs between both variants (9.9 h and 13.7 h for the Cyclin D dependent model andRsdependent model variants respectively), but its affect on cell cycle period (which is 26.9 h in both cases) is identical.
To determine whether our observations that the cell cycle period shows a weak dependence on intracellular calcium are robust we carry out numerical simulations to investigate whether the oscillatory period shows a greater sensitivity to calcium when we change all parameter values which control various factors in our model such as IP3and ATP production (rn
handαrespectively) and degradation (kdegandKdeg;Vdegrespectively). For each simula-tion wefirst generate a vectorPj¼ ðP1;…;λjPj;…;P42Þ, where the
Pi,i¼1;…;42, refer to the baseline parameter values as indexed in Tables D1–D3. We then form another vectorPj;k¼ ðP1;…;λjPj;…;λk Pk;…;P42Þwherekaj. In both these vectors all entries correspond
to the baseline values given inTables D1–D3except for aλjfold change of Pjin Pj and Pj;k as well as aλk fold change ofPkin
Pj;k. We then compute the maximal change in cell cycle period brought about by ATP mediated calcium release compared to the ATP blocked case, for afixed value ofλj, by varyingλkover a large range, i.e.
LkðλjÞ ¼max
λk
L0ðPjÞLðPj;kÞ L0ðPjÞ
:
Here,L0ðPjÞcorresponds to the cell cycle period computed for the parameter regimePjfor the ATP blocked case. Similarly,LðPj;kÞ denotes the cell cycle period for the ATP coupled case for the parameter setPj;k.
Before presenting the results where all model parameters are varied from their baseline values we first illustrate the above procedure by choosing Pj¼Kdeg and Pk¼γ. Fig. 6 shows the proportional reduction in cell cycle periodðL0ðPjÞLðPj;kÞÞ=L0ðPjÞ as a function ofλj and λk. Our goal is to obtain the maximum reductionLkðλjÞover all values ofλkwhich is indicated by the green line in thefigure.
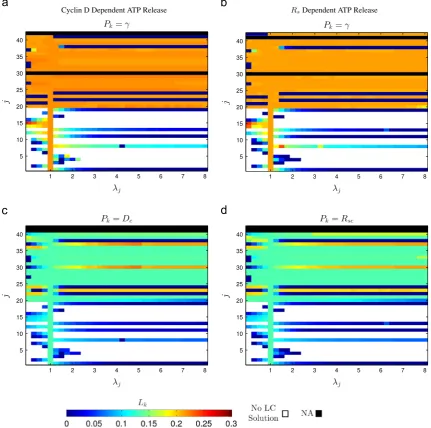
[image:6.595.108.477.60.369.2]The results where each parameter is varied, in turn, from its baseline value are shown inFig. 7where our choice ofPkmirrors our choice of the control parameters for the bifurcation analysis (seeFig. 3). ForPk¼γ(a,b) the results are very similar for both the model variants. In both cases the proportional reduction in period is relatively modest with a mean reduction over all parameter sets Pjfor which limit cycle solutions exist of 0.158 (a) and 0.156 (b). For the instances wherePk is chosen to be the threshold para-metersDc(c) andRsc(d), the results for both model variants are again very similar. Here, the mean proportional reduction in period is again relatively low (0.110 in (c) and 0.108 in (d)). These values are slightly lower than that was the case for the results in (a,b) reflecting the fact that the thresholds do not have as great an impact on cell cycle period as the calcium coupling strengthγ.
Fig. 3.Plots of the period of oscillation of the large amplitude stable limit cycle solutions shown inFig. 2as a function of the calcium coupling strengthγ(a, b), and of the
These results suggest that our finding from the bifurcation analysis, that calcium mediated cell cycle acceleration is unlikely to account for a significant increase in cellular proliferation, is robust for our model.
We conclude our analysis byfirst discussing and then demon-strating that cell cycle recruitment of a quiescent cell by a proliferating cell via an ATP mediated calcium signalling mechan-ism is viable and this could be the dominant mechanmechan-ism by which calcium increases proliferation rates. In order to describe, in detail, how this is achieved, we refer to the bifurcation diagrams inFig. 2 (a and b). In thisfigure the cell cycle dynamics of the ATP blocked case (red symbols) are equivalent to the dynamics of the original cell cycle model of Obeyesekere et al., which exhibits an area of multistability where limit cycle solutions andfixed point solutions coexist. Obeyesekere et al. (1999) showed that, whilst keeping parameter valuesfixed, increasing the Cyclin E concentration can stop a cell from cycling by driving the system from the branch of limit cycle solutions to thefixed point solution branch. Clearly, the converse is also true, i.e. it is possible to drive a cell from the branch offixed point solutions to the branch of high amplitude limit cycle solutions, for example by changing the Cyclin D concentration. Moreover,Fig. 2shows that ATP mediated calcium signalling acts to increase the area of multistability. This has important biological implications in that it suggests that ATP mediated calcium-cell cycle coupling can make cells more suscep-tible to cycling. In particular, cells can cycle for values ofa0d for which they would not in the absence of ATP mediated calcium signalling. For example, for the Cyclin D dependent model variant (Fig. 2(a)), high amplitude stable limit cycle solutions exist for 0:385oa0
do0:395, but do not exist for these value in the absence of coupling. Similarly, for theRsdependent model (Fig. 2(b)), limit
cycle solutions exist for 0:345oa0
do0:395, but vanish when ATP mediated calcium coupling is switched off. We believe that the area of multistability is relevant to the process of a cycling radial glial cell inducing a quiescent cell into G1phase of the cell cycle via ATP mediated calcium signals. In particular, let us consider a multicellular model. Quiescent cells would have initial conditions such that they sit on the stablefixed point solution branch within the area of multistability. A cycling cell, whose initial conditions are such that it sits on the high amplitude limit cycle branch, may be able to recruit quiescent cells to which it is coupled on to the upper limit cycle branch. Recruitment would be facilitated via the release of ATP from the cycling cell which would induce calcium release in the quiescent cells. Calcium elevations in the quiescent cells would, in turn, lead to an increase in Cyclin D activity which could sweep the cells up onto the high amplitude branch of limit cycle solutions.
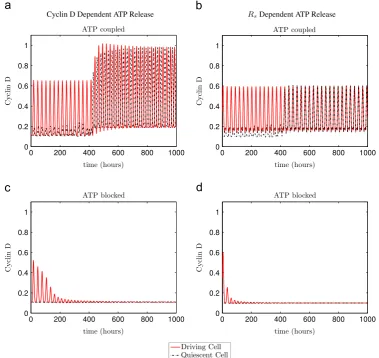
We demonstrate the viability of this scenario inFig. 8which shows simulations for systems of two cells in which extracellular ATP is allowed to diffuse through extracellular space according to
d½ATPE;1
dt ¼ATPrel;1ATPdeg;1þDATPð½ATPE;2½ATPE;1Þ; ð16Þ
d½ATPE;2
dt ¼ATPrel;2ATPdeg;2þDATPð½ATPE;1½ATPE;2Þ; ð17Þ
[image:7.595.117.488.60.372.2]where subscripts indicate the cell number andDATPis a diffusion parameter. Parameter values are chosen such that both cells lie within the area of multistability for the single cell model for the ATP coupled case, but outside the area of multistability for the ATP blocked case. Two scenarios are considered for both model variants. In the first, ATP mediated calcium coupling is enabled
Fig. 4.Simulations of system(1)–(15)for calcium mediated cell cycle coupling in a single radial glial cell. (a, c) show ATP mediated calcium release occurring as Cyclin D is
around its maximum (mid G1phase) in the Cyclin D dependent ATP release modelðði1;i2Þ ¼ ðD;DcÞÞ. (b, d) show release occurring asRsis close to its minimum (late G1phase) in theRsdependent ATP release modelðði1;i2Þ ¼ ðRsc;RsÞÞ. Horizontal dotted lines show thresholds for ATP release. Parameter values as inFig. 2, except fora0d¼0:41. Initial conditions as inAppendix E.
whilst in the second ATP mediated calcium coupling is disabled. In all cases, the initial conditions of one cell (the‘driving cell’) are chosen such that it will oscillate in isolation when calcium-cell cycle coupling is enabled, while the initial conditions of the second cell (the‘quiescent cell’) are chosen to lie on the stablefixed point branch of the single cell model. It is clear that for the case with ATP mediated calcium-cell cycle coupling (Fig. 8(a and b)), that the quiescent cell is recruited onto the oscillatory regime by the driving cell. While for the uncoupled case (c,d) the oscillations in the driving cell eventually die out, with both cells eventually exhibiting stablefixed point solutions.
4. Discussion
[image:8.595.111.474.61.367.2]In this paper, in order to answer the question of how ATP mediated calcium signals increase radial glia proliferation, we formed a model for coupled calcium-cell cycle dynamics in a single radial glial cell. Although it has not been experimentally determined precisely how intracellular calcium regulates prolif-eration rates in radial glia, studies on other cell types indicate that calcium, alone or as part of a complex, can cause an increase in proliferation rates by either accelerating G1 and reducing the overall cell cycle period (Rasmussen and Means, 1987, 1989) or
Fig. 5.An example demonstrating the nonlinear effect of calcium. Despite calcium release of different durations, because of the different times during the cell cycle at which
release occurs, the impact on the cell cycle period is identical. (a, c) correspond to the Cyclin D dependent release model and (b, d) to theRsdependent ATP release model. The cell cycle period for both model variants is 26.9 h, yet the duration of calcium release is longer for theRsdependent ATP release model (cf. (c) with (d)). Parameter values as inTables D1–D3except forDc¼0:433. Initial conditions as inAppendix E.
Fig. 6.Proportional reduction in cell cycle period as a function ofλjandλk. The maximum proportional reduction, for each value ofλj, brought about by changes inλk
is indicated by the solid green line.Pj¼KdegandPk¼γ.λkA½0;10andλjA½0;8were both sampled at regular intervals of 0.25. Baseline parameter values given in
[image:8.595.82.500.428.584.2]inducing cells, which would otherwise lie dormant in the quies-cent G0state, to embark on the cell cycle (Hazelton et al., 1979; Whitfield et al., 1979; Boynton et al., 1976). From the results of Section 3we infer that, for our model, the reduction in the cell cycle period brought about by ATP mediated calcium release is modest (approximately 10% for realistic parameter regimes). In order to obtain an increase in the proliferation rate of 82.8% as obtained fromWeissman et al. (2004), a reduction in period close to 45.3% is required. This suggests that the modulation of the frequency of oscillation caused by calcium plays a minor role with regard to accounting for the large increase in cellular proliferation brought about by calcium signalling. Crucially however our bifur-cation results reveal a region of multistability that is extended by the calcium coupling. This result and simulations of two cell systems are consistent with the notion that a proliferating cell may induce oscillations in otherwise quiescent cells via a calcium
signalling mechanism. The actual increase in the proliferation rate will depend on the proportion of cells that would otherwise lie dormant in the absence of ATP mediated calcium waves, but such a cell-cycle recruitment mechanism could in principle account for the 82.8% increase in proliferation and it may be predominantly by these means that calcium acts to increase overall cellular prolif-eration in radial glia.
[image:9.595.87.519.61.489.2]To keep our model tractable, we used a low dimensional model for the cell cycle. An interesting avenue of future investigation would be to consider whether the inclusion of a more biophysi-cally realistic cell cycle model (such as that ofNovak and Tyson, 2004; Swat et al., 2004; Gérard and Goldbeter, 2011 or Pfeuty, 2012) would lead to results consistent with those presented in this paper. We note from Fig. S1 ofPfeuty (2012)that this model has structural similarities to our model in that an area of bistability in which two steady state solutions (one of which corresponds to the
Fig. 7.Numerical results indicating that, for all parameter regimes, the cell cycle period remains weakly dependent on the calcium coupling strengthγand ATP release
thresholdsDcandRsc. The colours in the heat maps correspond to the maximum proportional reduction in cell cycle periodLkbrought about by changes in control parameters. The control parameterPk¼γin (a,b) while the thresholdsDcandRscare chosen asPkin (c,d). White in the heat maps corresponding to parameter regimes for which there are no limit cycle (LC) solutions. Black corresponds to the instances where a value forLkcannot be calculated either becausej¼kor the parameter indexed byjis not included in the particular model variant. In allfigures,λjA½0;8was sampled at regular intervals of 0.25. In (a,b),λkA½0;10was sampled at regular intervals of 0.25, in (c)
λkA½0;0:7was sampled at regular intervals of 0.1 and in (d)λkA½0:8;1:4was sampled at regular at intervals of 0.1. The ranges for the fold change parameterλkwere chosen as previous results indicate the cell cycle period has a local minimum or reaches an asymptotic value within them (seeFig. 3). Parameter indices and baseline values given in
Tables D1–D3. (For interpretation of the references to colour in thisfigure caption, the reader is referred to the web version of this paper.)
S phase proliferative state and the other to the quiescent state) coexist for a range of values for a parameter which controls the Cyclin D synthesis. This is comparable to the area of multistability in our model in which limit cycle solutions (corresponding to the proliferative state) andfixed point solutions (corresponding to the quiescent state) coexist (seeFig. 2). For our model this area plays a crucial role in allowing for a driving cell to recruit quiescent cells. It is conceivable therefore that in the model ofPfeuty (2012), the area of bistability could permit similar behaviour and allow for recruitment of a quiescent cell by a driving cell. The model of Gérard and Goldbeter also exhibits an area of bistability (see Fig. 8 (d) of Gérard and Goldbeter, 2011) where low amplitude limit cycle and high amplitude limit cycle solutions coexist, again for a range of values for a parameter which controls the Cyclin D synthesis. Here also, it is conceivable that a cell on the high amplitude limit cycle branch could lift a non-proliferating cell sat on the branch of low amplitude limit cycle solutions up into the proliferative regime via ATP mediated calcium signals.
In this study we did not consider the impact of calcium on Cdc25 and Cdk1. As calcium affects these proteins either at the G2/M transition or during M phase, we expect that the inclusion of these pathways will have little or no impact on our result that ATP mediated calcium release can lift a cell out of G0and into G1. By incorporating these pathways into our model, we mayfind that calcium acts to accelerate M phase entry and/or progression of an already cycling cell, leading to a reduction in period. However, our results suggest that this reduction is very likely to be modest and,
in itself, is highly unlikely to account for the experimentally observed increase in proliferation rates.
Our work focuses on non-differentiating cells. The changes that occur in cell cycle behaviour of differentiating radial glia are complex (seePatten et al., 2003 for example) and incorporating such changes into a model would provide an interesting avenue for future research. Other future work will also investigate in more detail whether radial glia cell cycle recruitment can account for the increased proliferation rates discovered by Weissman et al. (2004). It will be important to consider multicellular systems and investigate whether, and under what conditions, cycling cells can induce dormant cells to cycle and the impact of this on overall cellular proliferation. We note that there may be significant variation in parameters within a population of cells and it will be important to consider, for example, whether an intrinsically cycling cell can recruit one that, in isolation, cannot oscillate. It has also been hypothesised that the calcium signalling mechanism enables the synchronisation of the cell cycles of clusters of radial glial cells, leading to the shedding of daughter cells in uniform sheets (Weissman et al., 2004). This concept will be tested in future work.
Appendix A. Modelling calcium release
[image:10.595.102.482.58.416.2]The model of Li and Rinzel for calcium release (Li and Rinzel, 1994) which Bennett et al. incorporate into their model for ATP
Fig. 8.(a,b) Illustrative example of how, in a system of two coupled cells, a driving cell may recruit a quiescent cell onto the cell cycle. (c,d) demonstrate that when ATP
mediated calcium release in astrocytes is given by
d½Ca2þ
dt ¼μðJ
out ERJ
in
ERÞ; ðA:1Þ
dh
dt¼A½Kdð½Ca
2þþK
dÞh; ðA:2Þ
JoutER ¼ Lþ
PIP3R½IP33½Ca2þ3h
3
ð½IP3þKiÞ3ð½Ca2þþKaÞ3
" #
ð½Ca2þER½Ca
2þÞ; ðA:3Þ
Jin ER¼
VSERCA½Ca2þ2
½Ca2þ2þK2 SERCA
; ðA:4Þ
½Ca2þER¼
Ct½Ca2þ
s
: ðA:5ÞIn the model(A.1)–(A.5),Ctis the total calcium (assumed to be constant) and it is composed of calcium in the ER (½Ca2þER) and
calcium in the cytosol (½Ca2þ). In Eq. (A.1) μ describes calcium buffering. Calcium release, triggered by IP3, is controlled by the
flux of calcium from the ER into the cytosol (JoutER, Eq.(A.3)) and the
flux from the cytosol into the ER (JinER, Eq. (A.4)). The flux into
the cytosol depends upon a gating variable (h, Eq.(A.2)), which is the fraction of ion channels available to open.LandPIP3R are the
ER leak permeability and the maximum total permeability of IP3 channels respectively. VSERCA is the maximum pump rate of
calcium into the ER and KSERCA is a constant which represents
the calcium concentration at which the SERCA pump reaches half maximal efficiency.Kd,Ki, andKaare dissociation constants. Under certain parameter regimes, system(A.1)–(A.5)exhibits oscillatory solutions.
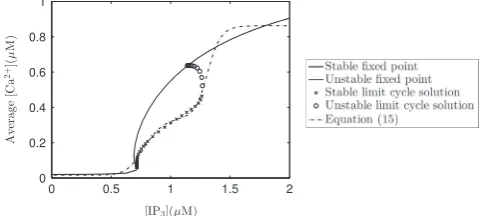
The calcium dynamics described by Eqs.(A.1)–(A.5)and the cell cycle dynamics of our model occur over very different timescales; the former has a period of oscillation of seconds and the latter hours. We wish to investigate the effect calcium has on the radial glial cell cycle. Therefore it is natural to replace oscillatory calcium release defined in Eqs. (A.1)–(A.5) with time averaged calcium release defined in Eq. (15). Using the non-linear least squares Marquardt–Levenberg algorithm (Marquardt, 1963) we fitted Eq.(15)to data for the average calcium concentration as a function of IP3. The data was obtained via numerical continuation of steady state and limit cycle solutions of the Li and Rinzel model. In the absence of specific knowledge of the spiking profile of calcium in radial glia, to generate the data from the model of Li and Rinzel we used the parameter values ofFall et al. (2002). Such values ensure that key features of calcium release, universally present in many cell types (Fall et al., 2002), are expressed. These features include the maximum and minimum calcium amplitude being indepen-dent of the concentration of IP3 and the oscillatory period of calcium being a decreasing function of IP3. Average calcium as a function of IP3for the model of Li and Rinzel is plotted inFig. A1 together with Eq.(15). For values of IP3less than approximately 1:25μM, thefit is very good. For all parameter regimes considered in this paper, IP3 concentrations never exceed 1:25μM. Hence, even though thefit is not so good for larger values of IP3, this will not significantly affect results.
To confirm that replacing the model of Li and Rinzel with function(15)describing calcium release does not affect the results of this work, we simulated our ATP coupled model (i.e. with ATP mediated calcium-cell cycle coupling) using the model of Li and Rinzel for calcium release (which we refer to as the‘full’model) as well as also simulating the ATP coupled case but using approxi-mated calcium dynamics given by Eq.(15)(which we refer to as the‘reduced’model). Results using parameter regimes, in which parameter values other than the calcium parameters are varied, confirm that the system with time averaged calcium release is in
excellent agreement with the model in which the model of Li and Rinzel was used. Moreover, the reduced model results in an 8-fold saving on computation time. A representative example illustrating the very good agreement between the full and reduced models is given inFig. A2. In this case, for the Cyclin D (Rs) dependent ATP release model, the duration of calcium release for one cell cycle for the reduced model is only approximately 0.327% (0.491%) greater than for the full model and the cell cycle period for the reduced model is approximately 0.0505% (0.102%) less than the period of the full model.
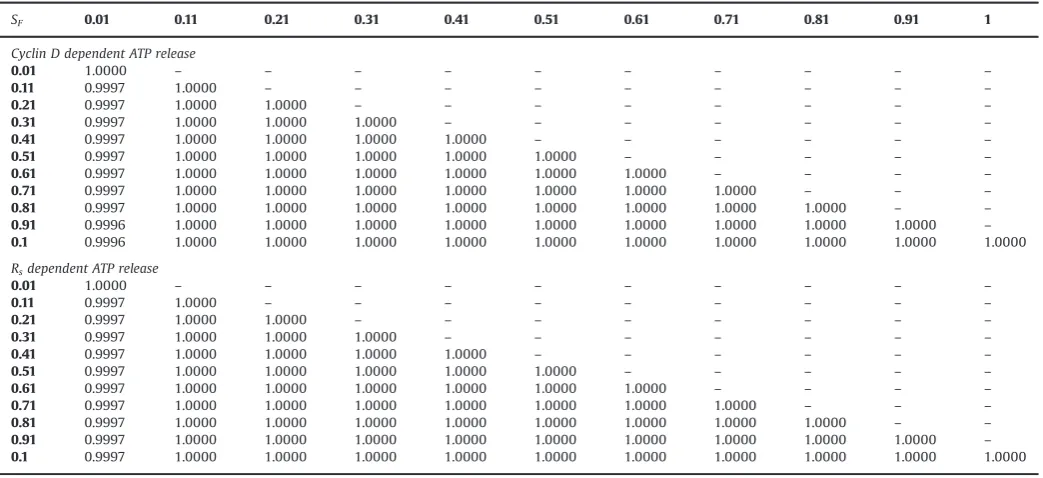
We note that calcium oscillations of different frequencies can have different effects on cellular dynamics (Dolmetsch et al., 1998; Thul et al., 2008) and that by simplifying the calcium release equations as described in this section we cannot investigate how the frequency of calcium oscillations will affect the cell cycle. Therefore, to confirm that frequency coding has no effect on the coupling of the cell cycle, we introduce a scale factorSFinto Eqs.(A.1) and (A.2)as
d½Ca2þ
dt ¼SFðμðJ
out ERJ
in
ERÞÞ; ðA:6Þ
dh
dt¼SFðA½Kdð½Ca
2þþK
dÞhÞ: ðA:7Þ
By varyingSFdifferent frequencies for calcium oscillations can be imposed into the system. InFig. A3, we show the results of two simulations, one where SF¼0:11 and on in whichSF¼0:31. The evolution of Cyclin D is identical in both cases even though the frequency of calcium oscillations of the two instances is different. The Pearson0s r linear correlation coefficient (Lee Rodgers and Nicewander, 1988) between the Cyclin D values for the two cases inFig. A3is 1, confirming that they are identical. InTable A1we give the Pearson0srvalues for the values of Cyclin D obtained from simulations using 11 different values for the scale factor parameter SF. In every case, the coefficient is either 1 or almost 1 confirming that the values for Cyclin D are identical in each simulation and that a frequency coding mechanism has no effect on the coupling.
Appendix B. Model equations
Below we reproduce Eqs.(1)–(15)which make up our model for ATP mediated calcium-cell cycle coupling for a single radial glial cell
dD
[image:11.595.316.558.60.168.2]dt¼adGFdDED;
Fig. A1.Bifurcation diagram for the Li and Rinzel model for IP3mediated calcium
release (Eqs.(A.1)–(A.5)), showing which values of the parameter½IP3give rise to calcium oscillations. For comparison the time averaged function for calcium release defined in Eq.(15)is also shown. Parameter values given inTables D1–D3and byμ¼0:0025 pL1L¼1332 pL h1,P
IP3R¼95;904;000 pL h1,Ki¼1:0μM,Ka¼ 0:4μM,VSERCA¼1;440;000 aMol h1,KSERCA¼0:2μM,A¼1800 h1,Kd¼0:4μM, s¼0:185, and½Ca2þ
T¼2μM.
dE
dt¼aEð1þafðE2FTRsÞÞdEXE;
dR
dt¼
pXðRTRsRÞX
qXþðRTRsRÞþX
psðE2FTRsÞR;
dRs
dt ¼psðE2FTRsÞR
pDRsD
qDþRsþD
pERsE
qEþRsþE;
dX
dt¼aXEþβðE2FTRsÞþgX
2Ed XX;
adð½Ca2þÞ ¼a0dþγð½Ca
2þ½Ca2þ
bÞ; ρ¼ ½
ATPE
KRþ½ATPE;
Gn¼Kρþν
Gþρþν;
d½IP3
dt ¼r
n
hGnkdeg½IP3;
d½ATPI
dt ¼ATPprodATPrel;
d½ATPE
dt ¼ATPrelATPdeg;
ATPprod¼αð½ATPImax½ATPIÞ; ATPdeg¼Vdeg ½
ATPE
Kdegþ½ATPE;
ATPrel¼ ½
IP3½IP3min
Krelþ½IP3
VATPð½ATPI½ATPEÞ
Tði1i2ÞTð½IP3½IP3minÞ;
TðxÞ ¼1
2 tanh x ε þ1
; ½Ca2þ ¼ ½Ca2þ
bþ
p1½IP3m
pm
2þ½IP3mþ
p3½IP3n
pn
4þ½IP3n:
For the Cyclin D dependent ATP release model variant
ði1;i2Þ ¼ ðD;DcÞand for theRsdependent ATP release model variant ði1;i2Þ ¼ ðRsc;RsÞ.
Appendix C. Wiring diagram of model variables
[image:12.595.108.480.59.391.2]Schematic illustration of the positive and negative interactions between the model variables given by Eqs.(1)–(15)is shown in Fig. C1.
Appendix D. Choice of parameter values
We have, where appropriate, used parameter values from the original component models, with a few exceptions that we discuss here. In the original model of Bennett et al. (2005) cells are regarded as three-dimensional cubes with proteins secreted and absorbed via two-dimensional cell walls. For simplicity, in our model we consider cells as point sources. Consequently it is necessary to change the values for rnh, kdeg and VATP given in Bennett et al. (2005)in order to obtain behaviour which closely mimics the case where cells are modelled as three-dimensional cubes. We arrived at appropriate values by simulating our model under different parameter regimes and comparing these results to numerical simulation results provided inBennett et al. (2005). For the parameters that govern ATP degradation (Vdegand Kdeg), different values for different cell types have been published in the biological literature. Gordon et al. (1989) derived values of Kdeg¼221μM and Vdeg¼9000μM h
1
[image:12.595.40.276.462.713.2]for arterial muscle cells of pigs. It is important to note however that ATP degradation depends heavily upon cell type as well as cellular concentration.
Fig. A2.Simulations in which ATP mediated calcium release is coupled to the cell cycle dynamics in a single radial glia cell (system(1)–(14)) using time averaged calcium
dynamics (Eq.(15), solid red lines, the‘reduced model’) and with the calcium release model of Li and Rinzel (Eqs.(A.1)–(A.5), black dot-dashed lines, the‘full model’). Thefirst column of plots correspond to the Cyclin D dependent ATP release model variantðði1;i2Þ ¼ ðD;DcÞÞand the second column to theRsdependent ATP release model variant ðði1;i2Þ ¼ ðRsc;RsÞÞ. In (a,b) the match between the reduced model and the full model is excellent. Note, in all plots the solution trajectories for the reduced and full models are superimposed on each other. The insets of (c,d) show oscillatory calcium dynamics in the full model in detail. Initial conditions as forAppendix E. Parameter values as for
Tables D1–D3except forγ¼0:4μM1h1
ATP is degraded into adenosine diphosphate (ADP) by ecto-nucleotidases present on the extracellular surface of cells (Joseph et al., 2004; Reigada et al., 2005). As different cell types express different ecto-nucleotidases in different proportions, the ability of
[image:13.595.116.487.59.354.2]different cells to degrade extracellular ATP will differ also.Joseph et al. (2004)investigated ATP degradation by astrocytes, and their results are at odds with those of Gordon et al. Byfitting the data published in the paper of Joseph et al. (2004)to the model we
Fig. A3.Example illustrating that changes in the frequency of calcium oscillations have no effect on the cell cycle. (a,b) show the evolution of Cyclin D for two different values
of the scale factor parameterSFwhich effectively controls the frequency of calcium oscillations for the Li and Rinzel model. (c,d) show the calcium oscillations with the insets of these plots illustrating the different oscillatory frequencies of the two cases. Simulations obtained by integrating system(1)–(14)with the modified version of the calcium release model of Li and Rinzel which permits frequency modulations (Eqs.(A.3)–(A.5), (A.6) and (A.7)). Initial conditions as forAppendix E. Parameter values as forTables D1–D3, and in thefigure.
Table A1
Pearson0s correlation scores for Cyclin D values obtained from simulations in which different values forSFwere used.
SF 0.01 0.11 0.21 0.31 0.41 0.51 0.61 0.71 0.81 0.91 1
Cyclin D dependent ATP release
0.01 1.0000 – – – – – – – – – –
0.11 0.9997 1.0000 – – – – – – – – –
0.21 0.9997 1.0000 1.0000 – – – – – – – –
0.31 0.9997 1.0000 1.0000 1.0000 – – – – – – –
0.41 0.9997 1.0000 1.0000 1.0000 1.0000 – – – – – –
0.51 0.9997 1.0000 1.0000 1.0000 1.0000 1.0000 – – – – –
0.61 0.9997 1.0000 1.0000 1.0000 1.0000 1.0000 1.0000 – – – –
0.71 0.9997 1.0000 1.0000 1.0000 1.0000 1.0000 1.0000 1.0000 – – –
0.81 0.9997 1.0000 1.0000 1.0000 1.0000 1.0000 1.0000 1.0000 1.0000 – –
0.91 0.9996 1.0000 1.0000 1.0000 1.0000 1.0000 1.0000 1.0000 1.0000 1.0000 – 0.1 0.9996 1.0000 1.0000 1.0000 1.0000 1.0000 1.0000 1.0000 1.0000 1.0000 1.0000
Rsdependent ATP release
0.01 1.0000 – – – – – – – – – –
0.11 0.9997 1.0000 – – – – – – – – –
0.21 0.9997 1.0000 1.0000 – – – – – – – –
0.31 0.9997 1.0000 1.0000 1.0000 – – – – – – –
0.41 0.9997 1.0000 1.0000 1.0000 1.0000 – – – – – –
0.51 0.9997 1.0000 1.0000 1.0000 1.0000 1.0000 – – – – –
0.61 0.9997 1.0000 1.0000 1.0000 1.0000 1.0000 1.0000 – – – –
0.71 0.9997 1.0000 1.0000 1.0000 1.0000 1.0000 1.0000 1.0000 – – –
0.81 0.9997 1.0000 1.0000 1.0000 1.0000 1.0000 1.0000 1.0000 1.0000 – –
0.91 0.9997 1.0000 1.0000 1.0000 1.0000 1.0000 1.0000 1.0000 1.0000 1.0000 – 0.1 0.9997 1.0000 1.0000 1.0000 1.0000 1.0000 1.0000 1.0000 1.0000 1.0000 1.0000
[image:13.595.43.565.445.684.2]use for ATP degradation (d½ATPE=dt¼ Vdeg½ATPE=ðKdegþ½ATPEÞ,
see Eq. (12)), we derived values for Vdeg¼21:33μM h1 and Kdeg¼5:1434μM (results plotted inFig. D1).
As radial glial cells bear a closer cellular resemblance to the astro-cytes that Joseph et al. studied than to the pig cells that Gordon et al. studied, it seems reasonable to choose values ofVdegandKdegskewed more towards the results ofJoseph et al. (2004). However, it is also important to note that Joseph et al. considered relatively small con-centrations of ATP in their experiments (0:1μM) and their results may not hold as well for larger ATP concentrations. Bearing in mind that in this paper we consider ATP concentrations of orders of magnitude greater than this, we should therefore not totally dismiss the results ofGordon et al. (1989)as they consider similarly large con-centrations of ATP in their experiments. We therefore regardKdeg¼ 50μM andVdegA½36;7200μM h1as physically realistic values.
Guthrie et al. (1999)suggest that a value of 5000μM represents a plausible, but likely very high estimate for cytosolic ATP concentra-tion in astrocytes. We therefore consider values of 500μM for
½ATPImax, which represents the maximum intracellular ATP
concen-tration. For simplicity, and in the absence of evidence to the contrary, we assume that internal ATP stores of radial glia never fully deplete, even with open hemichannels. To ensure this we take a value for ATP production strengthαwhich guarantees that, when hemichannels are open, ATP production exceeds ATP release.
[image:14.595.38.282.100.242.2]We vary the parameter γ which controls the calcium coupling strength in our analysis in order to investigate its effect upon our model. We set the critical valuesDcandRscso that ATP release occurs at the appropriate point during the cell cycle (seeSection 2for details). The period of the mammalian radial glial cell cycle ranges from approximately 8–18 h in mice (Takahashi et al., 1995) to 22–55 h in primates (Kornack and Rakic, 1998). The cell cycle model of Obeyese-kere et al. has non-dimensional time units and for the baseline parameter values in our radial glial cell model the cell cycle period is 27.29 for the Cyclin D dependent ATP release variant and 26.85 forRs ATP release model variant. We therefore introduce dimensional time such that 1 unit of dimensionless time equals 1 h, giving cell cycle times consistent with the above biological observations. For the model ofBennett et al. (2005)we rescale time from seconds to hours for compatibility with the cell cycle model. All parameter values used in our models are given inTables D1–D3.
Fig. C1.Schematic illustration of the positive and negative interactions between
[image:14.595.73.246.280.403.2]the model variables given by Eqs.(1)–(15).
Fig. D1.Experimental data ofJoseph et al. (2004)showing how an initial ATP
concentration of 0:1μM degrades over time and a simulated ATP degradation curve. The data wasfitted to the model for ATP degradation given by Eq.(12)using the unconstrained nonlinear optimisation method ofLagarias et al. (1999).
Table D1
Parameter values for Obeyesekere et al. cell cycle model.
Index Parameter Value Source Description
1 GF 0.25384 Obeyesekere et al. (1999) Growth factor activity
2 dD 0.4 h1 Obeyesekere et al. (1999) Rate parameter at with which Cyclin D
is degraded by active Cyclin E/Cdk2 3 aE 0.16 h1 Obeyesekere et al. (1999) E2F independent Cyclin E synthesis rate
parameter
4 af 0.9 Obeyesekere et al. (1999) E2F dependent Cyclin E synthesis rate
parameter
5 E2FT 1.5 Obeyesekere et al. (1999) Total E2F concentration
6 dE 0.2 h1 Obeyesekere et al. (1999) Rate parameter at with Cyclin E is degraded
by the CPI
7 pX 0.48 h1 Obeyesekere et al. (1999) Rate parameter at with which the CPI
dephosphorylates RB
8 qX 0.8 h1 Obeyesekere et al. (1999) Michaelis constant
9 RT 2.5 Obeyesekere et al. (1999) Total RB
10 ps 0.6 h1 Obeyesekere et al. (1999) Constant at which free unphosphorylated RB
sequesters E2F
11 pD 0.48 h1 Obeyesekere et al. (1999) Rate parameter at which active
Cyclin D/Cdk4 phosphorylates RB
12 qD 0.6 h1 Obeyesekere et al. (1999) Michaelis constant
13 pE 0.096 h1 Obeyesekere et al. (1999) Rate parameter at which Cyclin E
phosphorylates RB
14 qE 0.6 h1 Obeyesekere et al. (1999) Michaelis constant
15 aX 0.08 h1 Obeyesekere et al. (1999) Rate parameter of Cyclin E/Cdk2 dependent CPI
production
16 β 0.2 h1 Obeyesekere et al. (1999) Rate parameter of free E2F dependent CPI production
17 g 0.528 h1 Obeyesekere et al. (1999) CPI autocatalytic reaction rate parameter 18 dX 1.04 h1 Obeyesekere et al. (1999) CPI degradation rate constant
19 a0
[image:14.595.34.553.483.745.2]Table D2
Parameter values for the Bennett et al. model.
Index Parameter Value Source Description
20 KR 25μM Bennett et al. (2005) Effective dissociation constant for P2Y1receptor ATP binding
21 ν 0.12 Bennett et al. (2005) background G-protein activation constant
22 KG 8.82353 Bennett et al. (2005) G-protein dissociation constant
23 rn
h 2160μM h1 Appendix D IP3production rate
24 kdeg 225 h1 Appendix D IP3degradation rate
25 Vdeg 7200μM h1 Gordon et al. (1986, 1989)andJoseph et al. (2004) Michaelis constant
(expected range 36–7200μM h1, seeAppendix D)
26 Kdeg 50μM Gordon et al. (1986, 1989)andJoseph et al. (2004) Michaelis constant
27 VATP 180,000 h1 Appendix D ATP release rate constant
28 ½IP3min 0:013μM Bennett et al. (2005) Minimum IP3concentration for ATP release
[image:15.595.44.560.238.376.2]29 Krel 10μM Bennett et al. (2005) Kinetic parameter
Table D3
New parameter values for coupled model.
Index Parameter Value Source Description
30 γ 1μM1h1 Appendix D Calcium coupling strength (treated as a bifurcation parameter)
31 ½Ca2þ
b 0:0159835μM Fall et al. (2002) Steady state calcium concentration 32 α 298.8 h1 Appendix D ATP production rate constant
33 ½ATPImax 500μM Guthrie et al. (1999) Maximum internal ATP concentration
34 ε 0:01μM1 Stiffness of switch function 35 p1 0.514987 Appendix A Hill function coefficient 36 p2 1.31319 Appendix A Hill function coefficient 37 p3 0.332195 Appendix A Hill function coefficient 38 p4 0.787902 Appendix A Hill function coefficient 39 m 24.1946 Appendix A Hill function coefficient 40 n 9.79183 Appendix A Hill function coefficient
41 Dc 0.5 Appendix D Critical Cyclin D concentration above which ATP is released (treated as a bifurcation parameter)
42 Rsc 1 Appendix D CriticalRsconcentration below which ATP is released (treated as a bifurcation parameter)
Appendix E. Initial conditions forFigs. 4, 5, 8, A2 and A3
Fig. 4 Fig. 5 Fig. 8
(a, c) (b, d) (a, c) (b, d) Driving cell Quiescent cell
(a, c) (b, d) (a, c) (b, d)
Dð0Þ 0.1205 0.1966 0.7720 0.7090 0.1197 0.3536 0.1023 0.1001
Eð0Þ 2.1672 2.1958 0.3253 0.1949 0.0857 0.0392 2.1287 2.1541
Rð0Þ 0.2787 0.2831 0.8574 0.8989 0.2721 0.8780 0.4686 0.4729
Rsð0Þ 0.9301 0.8928 1.2030 1.2119 0.9529 1.2656 0.9529 1.1758
Xð0Þ 0.4608 0.4987 1.1141 2.8932 0.4033 0.4902 22.1852 0.4797
½IP3ð0Þ 0.013 0.9440 0.9440 0.0130 0.013 0.013 0.013 0.013
½ATPIð0Þ 500 478.1865 478.1865 500 500 500 500 500
½ATPEð0Þ 0 477.7613 477.7613 0 0 0 0 0
Fig. A2 Fig. A3
(a, c) (b, d) (a, c) (b, d)
Dð0Þ 0.1554 0.7128 0.1602 0.5633
Eð0Þ 1.2122 0.2218 1.0977 0.0672
Rð0Þ 0.6277 0.8919 0.6501 0.9081
Rsð0Þ 1.1497 1.2088 1.1160 1.2394
Xð0Þ 2.6821 2.3361 3.2614 12.1983
½IP3ð0Þ 0.013 0.013 0.013 0.013
½ATPIð0Þ 500 500 500 500
½ATPEð0Þ 0 0 0 0
½Ca2þð0Þ 0.02 0.02 0.02 0.02
hð0Þ 0.9524 0.9524 1 1
[image:15.595.44.571.416.731.2]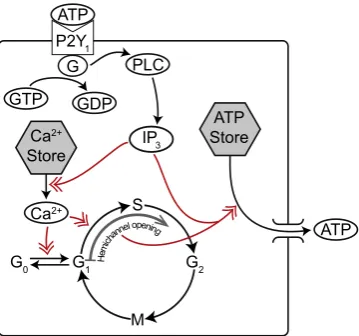
![catena Poly[[μ cyano [1,3 bis(tetramethylguanidino)propane]dicopper(I)] μ cyano]](data:image/gif;base64,R0lGODlhAQABAIAAAP///wAAACH5BAEAAAAALAAAAAABAAEAAAICRAEAOw==)