PaPer TyPe
Channels 7:6, 459–467; November/December 2013; © 2013 Landes Bioscience
PerSPeCTIVe
Chondrocytes are the resident cells of cartilage which pro-duce, maintain, and degrade the extracellular matrix (ECM). Whilst the cells are non-excitable, they have already been shown to express a rich complement of ion channels.1 Chondrocyte
ion channels are involved in several critical functions including mechanotransduction2 and apoptosis.3 Many other functions
in chondrocytes, and their precursors, have all been shown to directly involve ion channels.4
Expression data to date have largely been obtained using tra-ditional biochemical and physiological techniques such as flux studies, electrophysiology, and immunohistochemistry. More recently reverse transcription and real time (quantitative) poly-merase chain reaction (PCR) methods have also identified novel
ion channels in chondrocytes.5 Over the past few years,
microar-ray analysis or “transcriptomics” has added a new dimension to the study of gene expression. Whereas, in the past, one studied ion channels on a cell-by-cell, or antibody-by-antibody basis, this new “transcriptomic” or “expression profiling” technology potentially allows one to examine thousands of transcripts simul-taneously. The technique is clearly very powerful but there are drawbacks too, since every scientific technique has its limita-tions. However, by combining modern omics strategies and con-ventional biomolecular techniques one can gain a more thorough and subtle understanding of chondrocyte biology.
The most widely used method for functional study of ion channels is patch-clamp electrophysiology. However, despite the prominence, historical dominance and power of this approach, it is a very slow method and in real cell systems (as opposed to heterologous expression systems) definitive identification of a specific ion channel is difficult. The identification of ion chan-nels by patch clamp electrophysiology usually depends on the availability of a specific pharmacological ligand or a very distinct biophysical profile. Both of these are actually far rarer than one may think. For example, some of the most important channels for the control of chondrocyte function are the transient receptor potential (TRP) channels.6 These are difficult to identify
elec-trophysiologically because they show weak voltage sensitivity and there are relatively few selective ligands.
Traditionally, one has backed up the electrophysiology with immunohistochemistry or PCR studies, but even the strongest advocates of this approach would have to concede it is a slow process. Expression profiling with a microarray speeds up the characterization of ion channel transcription but, in addition to concerns over probe specificity, statistical validity and detection accuracy, there is a more fundamental issue. Even if particular ion channels are detected, and one accepts that this detection approach is valid, alone it gives no information on the role of that channel. Does the channel control membrane potential, volume, secretion, or have little role in that cell at all? The 2 data sets could be complementary to each other, however, if one makes the assumption that both experimental techniques are equally valid. The microarray data could direct electrophysiological *Correspondence to: Richard Barrett-Jolley; E-mail: [email protected]
Submitted: 06/19/2013; Revised: 08/02/2013; Accepted: 08/06/2013 http://dx.doi.org/10.4161/chan.26071
Chondrocyte channel transcriptomics
Do microarray data fit with expression and functional data?
rebecca Lewis1,5, Hannah May1, ali Mobasheri2-5, and richard Barrett-Jolley1,5*
1Musculoskeletal Biology; Institute of ageing and Chronic Disease; Faculty of Health & Life Sciences; University of Liverpool; Liverpool, UK; 2arthritis research UK Centre for
Sport, exercise and Osteoarthritis; arthritis research UK Pain Centre; Medical research Council and arthritis research UK Centre for Musculoskeletal ageing research; The University of Nottingham; Queen’s Medical Centre; Nottingham, UK; 3School of Life Sciences; University of Bradford; Bradford, UK; 4Center for excellence in Genomic Medicine
research (CeGMr); King Fahad Medical research Center (KFMrC); King abdulaziz University; Jeddah, Saudi arabia;
5The D-BOarD european Consortium for Biomarker Discovery
Keywords: cartilage, chondrocyte, osteoarthritis, transcriptomics, electrophysiology, biophysics, ion channel, biomarker
Abbreviations: EBI, European Bioinformatics Institute; ECM, extracellular matrix; BK, large conductance calcium-activated potassium channel; PCR, polymerase chain reaction; TRP, transient receptor potential
experiments, by generating targets for study, and these biophysi-cal studies could examine the role of the expressed genes. It is well known that there is a statistically significant, but weak, correla-tion between total RNA abundance and protein expression. This has been particularly well studied in yeast7 and E. coli where,
from gene to gene and cell to cell, ratio of mRNA copy number to protein number can vary from 1:100 to 1:10000.8 The degree
of correlation also depends on the gene ontology and can be as high as R2=0.5 or so.9,10 In the following text, we will compare the
results of recent transcriptomic studies with those of traditional methods and ask; do the data match each other and what does each dataset add to the other?
In this letter we analyse and discuss the data from the fol-lowing 10 chondrocyte Affymetrix microarray datasets openly available on the European Bioinformatics Institute (EBI) expres-sion profiling database (EBI accesexpres-sion codes): E-GEOD-6119,11
E-GEOD-10024,12 E-GEOD-10556,13 E-GEOD-1277,14
E-GEOD-14402,15 E-GEOD-16464,16 E-GEOD-18052,17
E-GEOD-18394,18 E-GEOD-7683,19 E-GEOD-8077.20 These
datasets were found by searching for “chondrocyte(s)” OR “car-tilage and chondrocyte(s)”. These datasets have been produced from expression profiling experiments of extracted or primary cultures of chondrocytes from “healthy” cartilage from a range of human, bovine, rat, and mouse tissue.
A total of over 40,000 gene probe sets (reporters) have been used and these include those targeted at 200 or 300 ion chan-nel, or related, plasma membrane proteins. In this paper, we have accepted the author’s detection limits and analysis where they have uploaded these to the European Bioinformatics Database. Where these are not given, we have processed the raw data with a Mas5 transform21 using the open source Affymetrix Power
Tools (Affymetrix). Probe annotations were derived from the Affymetrix annotations database files using custom Perl scripts (revisions “na31” except where stated). We have not analyzed data from other microarray platforms.
Commonality between Datasets
Typically, using standard assessment criteria, approximately 50 to 100 channel targets are detected in chondrocytes. Not sur-prisingly the dataset from each study are rather different to each other, but there is a common set of 7 probes that are detected in all 10 of these studies. These are given in Table 1. It is important to note that this analysis does not select particular ion channel
genes to study, but reveals all the genes commonly expressed in the above microarray datasets (note that there are over 300 ion channel gene probes encoded on each of the cited Affymetrix chips; accessory proteins such as the channel “tetramerization domain” proteins are excluded). With such a large number of ion channel transcripts on the Affymetrix chips one would expect the random co-detection of transcripts across datasets. To quantify this we used the following statistical analysis. The probability of more than n transcripts being co-localised in d datasets is given by:
(Equation 1)
where p is the probability of a given gene appearing in a data-sets, and there are a total of g genes on each array. This gives a
p-value for 7 (or more) transcripts appearing in all 10 datasets by
chance as p <1e-14.
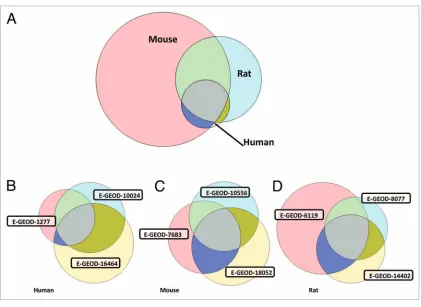
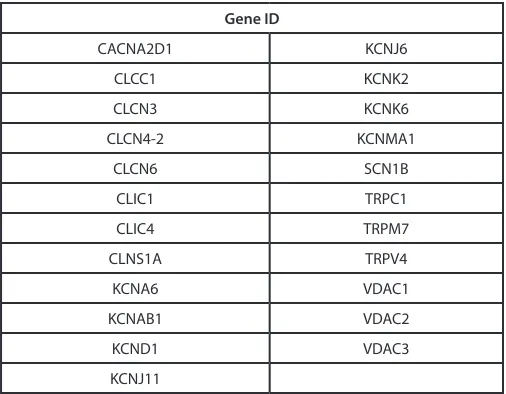
It should be noted that these microarray datasets were derived from different species (3 rat, 3 mouse, 3 human and 1 bovine) and there are potential differences in chondrocyte isolation pro-tocols. Constraining analysis to just rodent (6 datasets) returns a set of 23 commonly expressed ion channel genes (Table 2).
[image:2.612.96.521.71.194.2]Figure 1 quantitatively illustrates both the overlap of genes commonly expressed between species (Fig. 1A) and the over-lap between each of the transcripts from human, mouse and rat (Fig. 1B, C, and D, respectively). It is evident that far more tran-scripts were detected in all 3 of the mouse datasets than in all 3 of the human datasets. This could be for three reasons; firstly, it is possible that the sensitivity of the mouse chips is greater, but we have seen no specific evidence for this. Secondly, each of the protocols requires manual dissection and separation of chondro-cytes from the subchondral bone and adnexa. It is possible that mouse “chondrocyte” samples are inherently contaminated with non-chondrocyte tissue. In an electrophysiological or immuno-histochemical study such contamination would be relatively easy to detect, but in a biochemical protocol, where harvested tissue is macerated and then processed, it could be missed. Thirdly, it is conceivable that there are genuine phenotypic differences between chondrocytes in mice and other animals. Such differ-ences have been discussed elsewhere.22,23
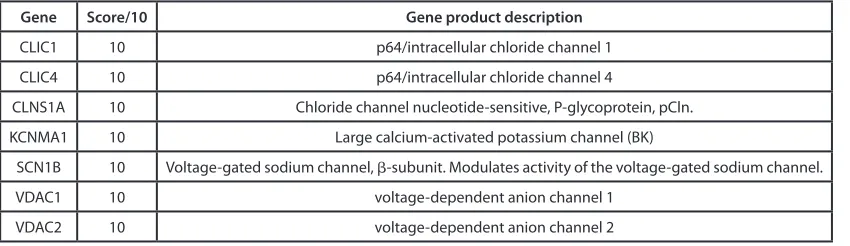
Table 1. Ion channels detected in all 10 of the microarray studies considered in this report.
Gene Score/10 Gene product description
CLIC1 10 p64/intracellular chloride channel 1
CLIC4 10 p64/intracellular chloride channel 4
CLNS1a 10 Chloride channel nucleotide-sensitive, P-glycoprotein, pCln.
KCNMa1 10 Large calcium-activated potassium channel (BK)
SCN1B 10 Voltage-gated sodium channel, β-subunit. Modulates activity of the voltage-gated sodium channel.
VDaC1 10 voltage-dependent anion channel 1
The remainder of this letter focuses on whether the microar-ray data provides useful clues as to which channels are expressed in chondrocytes, and whether, therefore, initial processing of microarray data will improve the rate of channel detection in chondrocytes, or potentially other tissues.
Chloride Channels
The chloride channel superfamilyi is huge and includes the
large ClC family, CFTR protein, calcium-activated, volume-activated, P64 related chloride channels (Clns), and intracellular
chloride channels (CLIC). In many systems chloride channels have been less well studied than cation channels, although they were some of the earliest ion channels identified in chon-drocytes.24,25 Analysis of the current datasets reveals that both
p64-related (CLIC1, CLIC4) and ClNS1A ion channels were detected in all 10 microarray experiments. The function of the corresponding channels are unknown, complex, controversial, or a combination of all these. CLIC1, CLIC4, and other mem-bers of the CLIC family of proteins appear to be legitimate anion channels.26 They are often referred to as “p64-related” simply
[image:3.612.97.518.55.362.2]because their earliest characterization appeared to be of a 64kDa
Figure 1. Commonality of gene transcript expression between datasets. (A) Commonality between species. These represent transcripts present in
protein.27 They appear to be of relatively low conductance for
a chloride channel (8-40pS, depending on experimental con-ditions28-30). Whilst, as their name implies, these channels can
localize to intracellular compartments,31,32 in some cell types
they also appear to be in the plasma membrane and could serve a role in secretion.32,33 One possibility is that the channel shuttles
to and from the membrane in a cell cycle dependent way.32 The
pCln channel (sometimes referred to as P-glycoprotein, pICln), also detected in 10 out of 10 datasets, was first identified by Paulmichl et al34 as a putative rather ubiquitous volume-sensitive
chloride channel. More recently, this volume regulator role has been refuted35,36 and roles in gene-regulation and development
have been proposed.37,38 The controversy surrounding the nature
of this channel is discussed in detail by Strange39 and Furst.40 The
particular issue is that it cannot be clearly determined whether this is a volume-sensitive channel, another type of channel, or is a regulator of a channel endogenous in the various expression systems in which it has been studied.39 Even the fundamental
property of ion selectivity is controversial, since recent studies have shown a rather higher permeability of pCln to cations than would be expected for a chloride channel.41 It is certainly
pos-sible that one or other of these channels does constitute the chlo-ride channel identified by Tsuga et al25 in chondrocytes, but this
is unlikely since the channel observed by Tsuga et al. is more typical of a classical maxi-type chloride channel in electrophysi-ological and pharmacelectrophysi-ological terms.26,42
The Voltage Dependent Anion Channels
The detection of both VDAC1 and VDAC2 is particularly interesting. The associated channels are thought of, generally, as mitochondrial ion channels, found in the outer membrane of this organelle. The proteins have also been detected in the plasma membrane, where they exhibit voltage-gated anion chan-nel activity (based on data in the NCBInr and UniProt data-bases). VDAC channels are also implicated in apoptosis and, as such, they will be of profound importance to all cells in which they are expressed. It has also now been suggested by a number of authors that some VDAC protein expression is also of plasma membrane ion channels.43,44 The phenotype of this channel is
that of a maxi-chloride channel. This would be very much in line with the original chondrocyte chloride channel work of Tsuga25 and Sugimoto.24 The channel identified in these
stud-ies was the maxi-chloride channel, which is remarkably similar to the maxi-Cl/VDAC channel. In our own unpublished work, we see clear expression of a large conductance, niflumic acid and SITS-sensitive chloride channel which appears likely to be maxi-chloride.
The Large Calcium-Activated Potassium Channel
[image:4.612.48.301.79.276.2]It is no surprise that KCNMA1 (BK) has been detected in all of the 10 datasets analyzed here. Currents either
Table 3. Ion channels detected in 9/10 of the microarray studies
consid-ered in this report.
Gene Score/10 Gene product description VDaC3 9 voltage-dependent anion channel 3
CLCN3, 7 9 chloride channel 3 and 7
CLCC1 9 chloride channel
TrPC1 9 transient receptor potential cation channel TrPV4 9 transient receptor potential cation channel The most striking observation is that a number of further chloride chan-nels were detected. also, however, we find that 2 transient receptor poten-tial channels are commonly detected. TrPC1, a canonical TrP, and TrPV4, a vanilloid TrP channel.
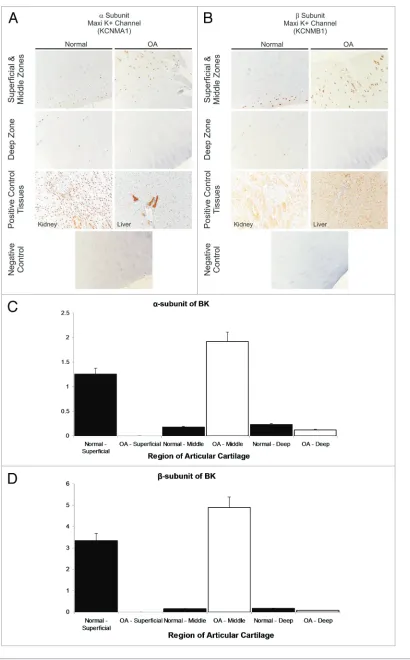
Figure 2. (see page 463) Immunohistochemical identification of
KCNMa1 (BK α-subunit) and KCNB1 (BK β-subunit) in sections of healthy and Oa equine cartilage. The data from normal equines is reproduced with permission from Mobasheri et al.45 Macroscopically normal articu-lar cartilage samples were obtained from weight-bearing regions of the metacarpophalangeal joints of horses of mixed breed, age, and sex. Joint tissues were sourced from an abattoir in Nantwich, Cheshire and Taunton Devon. animals were euthanized for non-research purposes having been stunned before slaughter for meat in accordance with Welfare of animals (Slaughter or Killing) regulations 1995. Sections of normal (n=6) and Oa (n=3) equine cartilage were probed for channel expression by immunohistochemistry essentially as previously described.45 Sections were incubated overnight at 4°C with rabbit polyclonal antibodies to the KCNMa1 and KCNB1. antibody dilutions used ranged from 1:200 to 1:1500 in tris-buffered saline containing 1% bovine serum albumin. Slides were incubated with horseradish peroxidase-labelled polymer conjugated to affinity-purified goat anti-rabbit immunoglobulins. Cell nuclei were counterstained by incubation with aqueous haematoxylin (code no. S3309; Dako). Positive control samples were included from liver and kidney. Omission of primary antibody served as negative controls. Photomicrographs of immunostained tissue sections captured using Nikon Digital Sight DS-5M camera driven by Nikon eclipsenet image capture software (Nikon). Positive staining is indicated by brown stain-ing and particular evident at middle/superficial zones. (C and D) Semi-quantified protein expression density. The largest increase in expression density (from data such as that illustrated in Fig. 2) is in the middle zone, for both KCNMa1 (C) and KCNMB1 (D) (α – and β – subunit respectively). Note that in Oa tissue there was insufficient superficial data to quantify expression levels.
Table 2. Ion channel gene IDs from all those gene transcripts detected in
all 6 rodent microarray studies.
Gene ID
CaCNa2D1 KCNJ6
CLCC1 KCNK2
CLCN3 KCNK6
CLCN4-2 KCNMa1
CLCN6 SCN1B
CLIC1 TrPC1
CLIC4 TrPM7
CLNS1a TrPV4
KCNa6 VDaC1
KCNaB1 VDaC2
KCND1 VDaC3
[image:4.612.49.302.308.402.2]broadly, or specifically, identified as being through BK chan-nels have been described in a number of papers. In our own work we have shown not only that BK currents are present by electrophysiology, but also that the KCNMA1 was detectable by immunohistochemical methods.45 Interestingly, whilst the
BK function modifying β-subunit KCNMB1 was detected in our own immunohistochemical studies it was not detected in any of the 10 microarray studies discussed here. There was detection of KCNMB2 and KCNB4 in 2 and 3 out of the 10 studies respectively. Activation of BK results in such large currents that it is likely to be involved with regulation of intra-cellular osmolarity and volume. This is important, since it known to be activated by stretch.45 Early work did not show
[image:6.612.79.535.58.355.2]whether this activation was direct or indirect via an increase of intracellular calcium ions, but BK is, so far, the only candidate for this role.
Figure 3. Water Permeability (aquaporin) assay. Water permeability can be calculated from the initial slope of the relative volume (V/Vo) against time curve. Where V is the volume at time t and Vo is the volume at time zero. This is the accepted physiological assay for aquaporin expression. (A) Permeability is 30±3% (p<0.05, n=4) greater in chondrocytes from dogs with osteoarthritis (Oa). Tea (a blocker of aQP153,54), bumetanide54 (pIC50 5.17±0.11µM, n=6, “Bumex”, a blocker of aQP1 and 4), and mercuric chloride (HgCl2 a non-specific aQP blocker reversed by 2-mercaptoethanol) Me) are included to deter-mine aQP type (B and C). Chondrocytes were harvested from canine clinical waste tissue with owner consent. Cells were placed in a “physiological saline” solution including 120 mM sucrose (osmolarity 300mOsm), then moved to an identical physiological saline without the sucrose. Cells at first swell as water enters the cell due to osmosis. Live cell imaging was achieved with a Nikon Diaphot microscope equipped with a Sony ICX098QB high sensitivity CCD. Images were analysed offline with ImageJ. Volume was calculated from the 2D surface area (A) of the cell disc by assuming the cell is approximately spherical as described previously,6 using the following equation:
(Eqn. 2)
except where stated, data are presented normalized for starting volume (V0) as V/V0, where V is the volume at time t. Visual data were analyzed with ImageJ and aNOVa performed with SPSS (SPSS Inc.). Note that canine tissue was harvested from clinical waste tissue with Local ethical approval, no dogs were harmed for the study.
Table 4. Ion channels and porins significantly changed in Oa.
Gene Symbol Encoded ion channel Abundance ratio p-value
aQP1 aquaporin 1 39.8 7.3e-22
KCNK5 K2P5.1 (Task-2) -4.7 4.8e-16
KCNMa1 KCa 1.1 (BK) 3.1 5.0e-10
KCNN4 KCa3.1 (IK) 10.2 2.0e-17
KCNT2 BK channel subunit (KCa4.2) -2.2 2.0e-07
SCNN1a eNaC -3.6 1.2e-08
TMeM16a Calcium activated chloride channel 3.2 1.4e-20 Negative is fold decrease in abundance ratio, positive is fold increase in abundance ratio. Data from Karlsson et al 2010,50 published in
[image:6.612.48.300.541.682.2]The Sodium Channel β-Subunit
The detection of the sodium β1-subunit SCN1B in all 10 studies is interesting, since the α-subunits were undetectable in most studies. This subunit has been shown, in neurons to convey subtle changes to expression patterns and functional properties of voltage-gated sodium channels.46 There has been 1
electrophysi-ological study, which identified voltage-gated sodium channels in chondrocytes.24 This work has not been followed up on and,
since chondrocytes do not fire action potentials, it is difficult to see what the role of a voltage-gated sodium channel might be. For completeness: SCN7A (Nav2.1), a somewhat atypical Na+
chan-nel was detected in 4/10 experiments, and the classical sodium channel SCN2A1 in 3/10, and the transient type sodium channel SCN11A and SCN10A in 2/10 datasets. SCN5A and 3A were detected in 1/10.
Transient Receptor Potential (TRP) Channels
The next most commonly identified ion channel transcripts are given in Table 3. This list includes TRPC1, of the canoni-cal TRP, and TRPV4, a vanilloid channel, both of which were identified in 9/10 microarray studies. In traditional protein and pharmacological studies, however, 3 TRP channels have been identified in chondrocytes TRPV4,47,48 TRPV5,6,48 and TRPV648
but not TRPC1. We have not investigated TRPC1 ourselves, however. The TRP channels identified pharmacologically in chondrocytes have different, but related roles. TRPV5 appears important for setting the membrane potential, crucial to mainte-nance of cell volume in chondrocytes.6 TRPV4, however, appears
to be critical for allowing entry of Ca2+ and activation of BK
channels during imposed volume increase, and thus the process of regulatory volume decrease in epithelial cells.49
Changes of Transcript Levels with Onset of Osteoarthritis
To use traditional (electrophysiological) methods to iden-tify changes in all channels expressed between populations of cells from different tissues is probably not feasible unless high throughput automated ion channel recording equipment can be adapted for this purpose. However, observation of changes in cel-lular properties and mathematical models may provide clues as to which channels have changed in OA. An alternative approach would be to use microarray comparisons between normal and OA tissue, detect changes in channel mRNA abundance and then follow-up with functional or histochemical experiments. Generally, differential expression patterns from microarray stud-ies are used to identify changed pathways, however, this process could miss changes which take place in individual ion channels not associated with an established pathway. The next microarray study considered in this article specifically compared transcript abundance from chondrocytes in human normal and OA carti-lage.50 The authors focused on (and verified) changes in many
classic cartilage phenotypic markers, but did not specifically con-sider changes in other proteins such as ion channels. Probing this
list for ion channels and porins significantly changed (greater than 2-fold change) produces the data in Table 4. The data clearly show an approximately 3-fold change in ENaC, TMEM16A and BK (KCNMA1) transcript abundance and a 38-fold change in the aquaporin AQP1 channel transcript abundance. Interestingly each of these channels are important for chondrocyte cell volume control.2, 55 From this, by way of proof of principle we verified
BK channel changes with immunohistochemistry and aquaporin channel changes with a functional assay.
We analysed, using immunohistochemistry, whether protein expression of BK is increased. Tissue was taken from stifle joints of horses with and without OA (see Fig. 2A and B for repre-sentative example). We investigated the expression of both α – and β-subunits of BK (only KCNMA1 was included in Karlsson 2010,50 there were no probe sets for KCNMB1 on the chip).
Semi-quantitative analysis of protein expression density shows that both BK subunits were significantly increased in OA, in the middle zone (Fig. 2C and D).
The accepted assay for aquaporin expression is that developed by Preston et al.51 Cells are challenged with a hypotonic
solu-tion, causing them to swell, and the rate of swell can be mea-sured to determine the aquaporin expression. The bioinformatics showed a 38-fold increase in AQP1 transcript abundance in OA and we see a significant increase in functional aquaporin expres-sion in tissue from OA joints (Fig. 3A), although the increase is much smaller than the change in AQP1 transcript abundance. Current pharmacological tools do not allow categorical determi-nation of aquaporin subtype, however, here, water permeability of chondrocytes was blocked by concentrations of bumetanide, TEA, and HgCl2 consistent with that expected for AQP153,54
(Fig. 3B and C).
In summary, there appears to be considerable agreement between transcriptomic studies and physiological or immunohis-tochemical studies. It would seem that most channels common to all 10 datasets can be identified by these other techniques. There are examples, however, of proteins which have been iden-tified in chondrocytes yet show up in few datasets. For example, the ASIC channel (ACCN2 gene) has been shown by immuno-histochemistry and rt-PCR yet shows up in only one of the three rat datasets discussed here.52 It is also notable that KATP
potas-sium channels, previously detected both by immunohistochem-istry and electrophysiology were not detected in the microarray studies.55,56 Therefore, combining these approaches should
Disclosure of Potential Conflicts of Interest
No potential conflicts of interest were disclosed.
Acknowledgments
The authors thank Andy Jones for assistance with the bioin-formatics, Peter Cripps for assistance with the statistical analysis and Prof John Innes for supply of the canine tissue.
Funding
The research leading to these results has received full fund-ing from the European Union Seventh Framework Programme (FP7/2007-2013) under grant agreement no. 305815
(http://cordis.europa.eu /projects /rcn/105314_en.html) (http://ec.europa.eu /research/health/medical-research/ severe-chronich-diseases/projects/d-board_en.html).
Author Contributions
All authors have made substantial intellectual contribu-tions to the conception and design of the study, data acqui-sition, analysis and interpretation. RBJ conceived the study. All authors contributed to data collection, interpretation and analysis. All authors contributed to data interpretation and manuscript preparation and approved the final version submitted.
References
1. Barrett-Jolley R, Lewis R, Fallman R, Mobasheri A. The emerging chondrocyte channelome. Front Physiol 2010; 1:135; PMID:21423376; http://dx.doi. org/10.3389/fphys.2010.00135.
2. Lewis R, Feetham CH, Barrett-Jolley R. Cell volume regulation in chondrocytes. Cell Physiol Biochem 2011; 28:1111-22; PMID:22179000; http://dx.doi. org/10.1159/000335847
3. Kumagai K, Imai S, Toyoda F, Okumura N, Isoya E, Matsuura H, et al. 17β-Estradiol inhibits the doxorubicin-induced apoptosis via block of volume-sensitive Cl+ current in rabbit articular chondrocytes. Br J Pharmacol 2011; 166:702-20; http://dx.doi. org/10.1111/j.1476-5381.2011.01802.x.
4. Mobasheri A, Lewis R, Ferreira-Mendes A, Rufino A, Dart C, Barrett-Jolley R. Potassium channels in artic-ular chondrocytes. Channels (Austin) 2012; 6:416-25; PMID:23064164; http://dx.doi.org/10.4161/ chan.22340
5. Funabashi K, Ohya S, Yamamura H, Hatano N, Muraki K, Giles W, Imaizumi Y. Accelerated Ca2+ entry by membrane hyperpolarization due to Ca2+-activated K+ channel activation in response to his-tamine in chondrocytes. Am J Physiol Cell Physiol 2010; 298:C786-97; PMID:20042729; http:// dx.doi.org/10.1152/ajpcell.00469.2009
6. Lewis R, Asplin KE, Bruce G, Dart C, Mobasheri A, Barrett-Jolley R. The role of the membrane potential in chondrocyte volume regulation. J Cell Physiol 2011; 226:2979-86; PMID:21328349; http://dx.doi. org/10.1002/jcp.22646
7. Gygi SP, Rochon Y, Franza BR, Aebersold R. Correlation between protein and mRNA abun-dance in yeast. Mol Cell Biol 1999; 19:1720-30; PMID:10022859
8. Tyagi SE. Genomics. E. coli, what a noisy bug. Science 2010; 329:518-9; PMID:20671174; http:// dx.doi.org/10.1126/science.1194036
9. Guo YF, Xiao P, Lei SF, Deng FY, Xiao GG, Liu YZ, Chen X, Li L, Wu S, Chen Y, et al. How is mRNA expression predictive for protein expres-sion? A correlation study on human circulating monocytes. Acta Biochim Biophys Sin (Shanghai) 2008; 40:426-36; PMID:18465028; http://dx.doi. org/10.1111/j.1745-7270.2008.00418.x
10. Anderson L, Seilhamer J. A comparison of selected mRNA and protein abundances in human liver. Electrophoresis 1997; 18:533-7; PMID:9150937; http://dx.doi.org/10.1002/elps.1150180333 11. Gouze JN, Gouze E, Popp MP, Bush ML, Dacanay
EA, Kay JD, et al. Exogenous glucosamine globally protects chondrocytes from the arthritogenic effects of IL-1 beta. Arthritis Res Ther 2006; 8:R173; PMID:17109745
12. Andreas K, Lübke C, Häupl T, Dehne T, Morawietz L, Ringe J, Kaps C, Sittinger M. Key regulatory mol-ecules of cartilage destruction in rheumatoid arthri-tis: an in vitro study. Arthritis Res Ther 2008; 10:R9; PMID:18205922; http://dx.doi.org/10.1186/ar2358
13. Fukada T, Civic N, Furuichi T, Shimoda S, Mishima K, Higashiyama H, Idaira Y, Asada Y, Kitamura H, Yamasaki S, et al. The zinc transporter SLC39A13/ ZIP13 is required for connective tissue development; its involvement in BMP/TGF-beta signaling path-ways. PLoS One 2008; 3:e3642; PMID:18985159; http://dx.doi.org/10.1371/journal.pone.0003642 14. Olney RC, Wang JW, Sylvester JE, Mougey EB.
Growth factor regulation of human growth plate chondrocyte proliferation in vitro. Biochem Biophys Res Commun 2004; 317:1171-82; PMID:15094393; http://dx.doi.org/10.1016/j.bbrc.2004.03.170 15. Rockel JS, Bernier SM, Leask A. Egr-1 inhibits the
expression of extracellular matrix genes in chondro-cytes by TNF alpha-induced MEK/ERK signalling. Arthritis Res Ther 2009; 11:R8; PMID:19144181; http://dx.doi.org/10.1186/ar2595
16. Dehne T, Karlsson C, Ringe J, Sittinger M, Lindahl A. Chondrogenic differentiation potential of osteoar-thritic chondrocytes and their possible use in matrix-associated autologous chondrocyte transplantation. Arthritis Res Ther 2009; 11:R133; PMID:19723327; http://dx.doi.org/10.1186/ar2800
17. Saito A, Hino S-i, Murakami T, Kanemoto S, Kondo S, Saitoh M, Nishimura R, Yoneda T, Furuichi T, Ikegawa S, et al. Regulation of endoplasmic reticu-lum stress response by a BBF2H7-mediated Sec23a pathway is essential for chondrogenesis. Nat Cell Biol 2009; 11:1197-204; PMID:19767744; http://dx.doi. org/10.1038/ncb1962
18. Huang AH, Stein A, Mauck RL. Evaluation of the complex transcriptional topography of mesenchy-mal stem cell chondrogenesis for cartilage tissue engineering. Tissue Eng Part A 2010; 16:2699-708; PMID:20367254; http://dx.doi.org/10.1089/ten. tea.2010.0042
19. James CG, Ulici V, Tuckermann J, Underhill TM, Beier F. Expression profiling of Dexamethasone-treated primary chondrocytes identifies targets of glucocor-ticoid signalling in endochondral bone development. BMC Genomics 2007; 8:205; PMID:17603917; http://dx.doi.org/10.1186/1471-2164-8-205 20. Appleton CTG, Pitelka V, Henry J, Beier F. Global
analyses of gene expression in early experimental osteoarthritis. Arthritis Rheum 2007; 56:1854-68; PMID:17530714; http://dx.doi.org/10.1002/ art.22711
21. Hubbell E, Liu WM, Mei R. Robust estimators for expression analysis. Bioinformatics 2002; 18:1585-92; PMID:12490442; http://dx.doi.org/10.1093/ bioinformatics/18.12.1585
22. Clark RB, Hatano N, Kondo C, Belke DD, Brown BS, Kumar S, Votta BJ, Giles WR. Voltage-gated K+ currents in mouse articular chondrocytes regulate membrane potential. Channels (Austin) 2010; 4:179-91; PMID:20372061; http://dx.doi.org/10.4161/ chan.4.3.11629
23. Mobasheri A, Lewis R, Ferreira-Mendes A, Rufino A, Dart C, Barrett-Jolley R. Potassium channels in artic-ular chondrocytes. Channels (Austin) 2012; 6:416-25; PMID:23064164; http://dx.doi.org/10.4161/ chan.22340
24. Sugimoto T, Yoshino M, Nagao M, Ishii S, Yabu H. Voltage-gated ionic channels in cultured rab-bit articular chondrocytes. Comp Biochem Physiol C Pharmacol Toxicol Endocrinol 1996; 115:223-32; PMID:9375360; http://dx.doi.org/10.1016/ S0742-8413(96)00091-6
25. Tsuga K, Tohse N, Yoshino M, Sugimoto T, Yamashita T, Ishii S, Yabu H. Chloride conduc-tance determining membrane potential of rabbit articular chondrocytes. J Membr Biol 2002; 185:75-81; PMID:11891566; http://dx.doi.org/10.1007/ s00232-001-0112-3
26. Jentsch TJ, Stein V, Weinreich F, Zdebik AA. Molecular structure and physiological function of chloride channels. Physiol Rev 2002; 82:503-68; PMID:11917096
27. Redhead CR, Edelman AE, Brown D, Landry DW, al-Awqati Q. A ubiquitous 64-kDa protein is a component of a chloride channel of plasma and intracellular membranes. Proc Natl Acad Sci U S A 1992; 89:3716-20; PMID:1315034; http://dx.doi. org/10.1073/pnas.89.9.3716
28. Tonini R, Ferroni A, Valenzuela SM, Warton K, Campbell TJ, Breit SN, Mazzanti M. Functional characterization of the NCC27 nuclear protein in stable transfected CHO-K1 cells. FASEB J 2000; 14:1171-8; PMID:10834939
29. Edwards JC, Tulk B, Schlesinger PH. Functional expression of p64, an intracellular chloride chan-nel protein. J Membr Biol 1998; 163:119-27; PMID:9592076; http://dx.doi.org/10.1007/ s002329900376
30. Singh H. Two decades with dimorphic Chloride Intracellular Channels (CLICs). FEBS Lett 2010; 584:2112-21; PMID:20226783; http://dx.doi. org/10.1016/j.febslet.2010.03.013
31. Berryman M, Bretscher A. Identification of a novel member of the chloride intracellular channel gene fam-ily (CLIC5) that associates with the actin cytoskeleton of placental microvilli. Mol Biol Cell 2000; 11:1509-21; PMID:10793131; http://dx.doi.org/10.1091/ mbc.11.5.1509
32. Valenzuela SM, Mazzanti M, Tonini R, Qiu MR, Warton K, Musgrove EA, Campbell TJ, Breit SN. The nuclear chloride ion channel NCC27 is involved in regulation of the cell cycle. J Physiol 2000; 529:541-52; PMID:11195932; http://dx.doi. org/10.1111/j.1469-7793.2000.00541.x
34. Paulmichl M, Norris AA, Rainey DK. Role of chlo-ride channel modulation in the mechanism of action of nedocromil sodium. Int Arch Allergy Immunol 1995; 107:416; PMID:7613196; http://dx.doi. org/10.1159/000237060
35. Voets T, Buyse G, Tytgat J, Droogmans G, Eggermont J, Nilius B. The chloride current induced by expression of the protein pICln in Xenopus oocytes differs from the endogenous volume-sensitive chloride current. J Physiol 1996; 495:441-7; PMID:8887755
36. Nilius B, Droogmans G. Amazing chloride channels: an overview. Blackwell Science Ltd, 2003:119-47. 37. Krapivinsky G, Pu W, Wickman K, Krapivinsky L,
Clapham DE. pICln binds to a mammalian homolog of a yeast protein involved in regulation of cell morphol-ogy. J Biol Chem 1998; 273:10811-4; PMID:9556550; http://dx.doi.org/10.1074/jbc.273.18.10811 38. Pu WT, Wickman K, Clapham DE. ICln is essential
for cellular and early embryonic viability. J Biol Chem 2000; 275:12363-6; PMID:10777517; http://dx.doi. org/10.1074/jbc.275.17.12363
39. Strange K. Molecular identity of the outwardly rectifying, swelling-activated anion channel: time to reevaluate pICln. J Gen Physiol 1998; 111:617-22; PMID:9565399; http://dx.doi.org/10.1085/ jgp.111.5.617
40. Fürst J, Gschwentner M, Ritter M, Bottà G, Jakab M, Mayer M, Garavaglia L, Bazzini C, Rodighiero S, Meyer G, et al. Molecular and functional aspects of anionic channels activated during regulatory vol-ume decrease in mammalian cells. Pflugers Arch 2002; 444:1-25; PMID:11976912; http://dx.doi. org/10.1007/s00424-002-0805-1
41. Fürst J, Bazzini C, Jakab M, Meyer G, König M, Gschwentner M, Ritter M, Schmarda A, Bottà G, Benz R, et al. Functional reconstitution of ICln in lipid bilayers. Pflugers Arch 2000; 440:100-15; PMID:10864003
42. Jentsch TJ. Chloride channels are different. Nature 2002; 415:276-7; PMID:11796992; http://dx.doi. org/10.1038/415276a
43. Bahamonde MI, Valverde MA. Voltage-dependent anion channel localises to the plasma membrane and peripheral but not perinuclear mitochondria. Pflugers Arch 2003; 446:309-13; PMID:12698369
44. Kotake S, Yago T, Kawamoto M, Nanke Y. Voltage-dependent anion channels (VDACs, porin) expressed in the plasma membrane regulate the differentia-tion and funcdifferentia-tion of human osteoclasts. Cell Biol Int 2013; 37:65-77; PMID:23319323; http://dx.doi. org/10.1002/cbin.10013
45. Mobasheri A, Lewis R, Maxwell JEJ, Hill C, Womack M, Barrett-Jolley R. Characterization of a stretch-activated potassium channel in chondrocytes. J Cell Physiol 2010; 223:511-8; PMID:20162564; http:// dx.doi.org/10.1002/jcp.22075
46. Meadows LS, Malhotra J, Loukas A, Thyagarajan V, Kazen-Gillespie KA, Koopman MC, Kriegler S, Isom LL, Ragsdale DS. Functional and biochemical analysis of a sodium channel β1 subunit mutation responsible for generalized epilepsy with febrile sei-zures plus type 1. J Neurosci 2002; 22:10699-709; PMID:12486163
47. Phan MN, Leddy HA, Votta BJ, Kumar S, Levy DS, Lipshutz DB, Lee SH, Liedtke W, Guilak F. Functional characterization of TRPV4 as an osmoti-cally sensitive ion channel in porcine articular chondrocytes. Arthritis Rheum 2009; 60:3028-37; PMID:19790068; http://dx.doi.org/10.1002/ art.24799
48. Hdud IM, El-Shafei AA, Loughna P, Barrett-Jolley R, Mobasheri A. Expression of Transient Receptor Potential Vanilloid (TRPV) Channels in Different Passages of Articular Chondrocytes. Int J Mol Sci 2012; 13:4433-45; PMID:22605988; http://dx.doi. org/10.3390/ijms13044433
49. Fernández-Fernández JM, Andrade YN, Arniges M, Fernandes J, Plata C, Rubio-Moscardo F, Vázquez E, Valverde MA. Functional coupling of TRPV4 cationic channel and large conductance, calcium-dependent potassium channel in human bronchial epithelial cell lines. Pflugers Arch 2008; 457:149-59; PMID:18458941; http://dx.doi.org/10.1007/ s00424-008-0516-3
50. Karlsson C, Dehne T, Lindahl A, Brittberg M, Pruss A, Sittinger M, Ringe J. Genome-wide expression profiling reveals new candidate genes associated with osteoarthritis. Osteoarthritis Cartilage 2010; 18:581-92; PMID:20060954; http://dx.doi.org/10.1016/j. joca.2009.12.002
51. Preston GM, Carroll TP, Guggino WB, Agre P. Appearance of water channels in Xenopus oocytes expressing red cell CHIP28 protein. Science 1992; 256:385-7; PMID:1373524; http://dx.doi. org/10.1126/science.256.5055.385
52. Yuan F-L, Chen F-H, Lu W-G, Li X, Wu F-R, Li J-P, Li CW, Wang Y, Zhang TY, Hu W. Acid-sensing ion channel 1a mediates acid-induced increases in intra-cellular calcium in rat articular chondrocytes. Mol Cell Biochem 2010; 340:153-9; PMID:20179994; http://dx.doi.org/10.1007/s11010-010-0412-y 53. Müller EM, Hub JS, Grubmüller H, de Groot BL. Is
TEA an inhibitor for human Aquaporin-1? Pflugers Arch 2008; 456:663-9; PMID:18196268; http:// dx.doi.org/10.1007/s00424-007-0422-0
54. Detmers FJM, de Groot BL, Müller EM, Hinton A, Konings IBM, Sze M, Flitsch SL, Grubmüller H, Deen PM. Quaternary ammonium compounds as water channel blockers. Specificity, potency, and site of action. J Biol Chem 2006; 281:14207-14; PMID:16551622; http://dx.doi.org/10.1074/jbc. M513072200
55. Lewis R, Feetham CH, Gentles L, Penny J, Tregilgas L, Tohami W, Mobasheri A, Barrett-Jolley R. Benzamil sensitive ion channels contribute to volume regulation in canine chondrocytes. Br J Pharmacol 2013; 168:1584-96; PMID:22928819; http://dx.doi. org/10.1111/j.1476-5381.2012.02185.x
56. Mobasheri A, Gent TC, Nash AI, Womack MD, Moskaluk CA, Barrett-JOlley R. Evidence for func-tional ATP-sensitive (K(ATP)) potassium chan-nels in human and equine articular chondrocytes. Osteoarthr Cartilage 2007; 15:1-8; PMID:16891130; http://dx.doi.org/10.1016/j.joca.2006.06.017 57. Rufino AT, Rosa SC, Judas F, Mobasheri A, Lopes