VALIDATED HPTLC ANALYSIS METHOD FOR QUANTIFICATION
OF THYMOL CONTENT IN AJWAIN (
TRACHYSPERMUM AMMI)
FRUIT
Das Manosi *1, Mondal D.N2, Dutta Sreya3, Mandal Achintya Kumar4, Ganguly Biplab5 and Hazra Jayram6
1,2
Research Officer (Chemistry), National Research Institute of Ayurvedic Drug Development, Kolkata, India.
3
Asst. Research Officer (Pharmacognacy), National Research Institute of Ayurvedic Drug Development, Kolkata, India.
4
Research Scholar (Chemistry), National Research Institute of Ayurvedic Drug Development, Kolkata, India.
5
Lab. Technician (Chemistry), National Research Institute of Ayurvedic Drug Development, Kolkata, India.
6
Director of the Institute, National Research Institute of Ayurvedic Drug Development, Kolkata, India.
ABSTRACT
A simple, sensitive and accurate HPTLC method has been develop and
validated for the quantitative estimation of Thymol in Ajwain
(Trachyspermum ammi) collected from local market.The method
employed TLC Aluminum plate Precoated with silica gel 60F254 as
stationary phase with mobile phase as Hexane : EtOAc (8:2; v/v).
Thymol showed mean Rf value of 0.46 with λmax at 278 nm. The
method was validated in terms of linearity (200-600ng/spot) precision
and accuracy (100.91% ) recovery. The Thymol content was found to
be 330.63ng/gm in Trachyspermum ammi obtained from marketed
sample. In this procedure, linearity (r2 =0.99998) ,limit of detection (50 ng/spot), limit of quantification (200 ng/spot) were found to be
satisfactory. The proposed HPTLC method can be used for the quality
control of the raw materials and for routine analysis.
KEYWORDS: HPTLC, Validation, Thymol, Trachyspermum ammi, Quantification.
Volume 5, Issue 3, 690-701. Research Article ISSN 2277– 7105
Article Received on 29 Dec 2015,
Revised on 20 Jan 2016, Accepted on 11 Feb 2016
*Correspondence for
Author
Das Manosi
Research Officer
(Chemistry), National
Research Institute of
Ayurvedic Drug
Development, Kolkata,
INTRODUCTION
Trachyspermum ammi (L.) Sprague,syn. Carum copticum Benth. et hook., commonly known as ajwain or Brishop‟s Weeds is an erect, aromatic, annual herb with striate stem white
flowers and small brownish fruits. It belongs to the family Apiaceae. Ajwain is grown in Iran,
Egypt, Afghanistan, and India[2] (largely in Uttar Pradesh, Bihar, Madhya Pradesh, Punjab, Rajasthan, West Bengal, Tamil Nadu and Andhra Pradesh). The fruits posses characteristic
aromatic odour and pungent taste due to the presence of an essential oil mainly composed of
Thymol (50%), α-cadinol, δ- cadinene, β-caryo Phyllene and Carvacrol.[3,4]
Thymol
(2-isopropyl -5- methyl phenol) is a natural monoterpene phenol derivative of cymene, C10H14O,
isomeric with carvacrol. It is a white crystalline substance of present aromatic odor and
strong antiseptic properties.This molecule has a broad range of activities including
antioxidant, antimicrobial, antiseptic, expectorant and antiplasmodic properties.[5,6]
High Performance Thin Layer Chromatography is one of the modern sophisticated techniques
that can be used for wide diverse applications. It is a simple and powerful tool for high
resolution chromatography and trace quantitative analysis is made possible. It is most widely
used for quick and easy determination of quality authenticity and purity of the crude drugs
and market formulation. Literature survey reveals that there are very few validated HPTLC
methods for the estimation of thymol. Hence an attempt was made to develop and validate
HPTLC method for evaluation of thymol. The validated method was proposed to the applied
for estimation of the marker (Thymol) compound obtained from the sample (Ajwain)
collected from local market to study the % of thymol in it.
MATERIAL AND METHOD Plant Material
Thymol standard was procured from Process Chemical Industries Kol- 700006 and raw
material Ajwain was purchased from local market of Kolkata and authenticated by Dr. M.N.
Das, Department of Pharmacognosy, National Research Institute of Ayurvedic Drug
Development, Kolkata.
Pharmacognostic studies Microscopy
(Olympus OIC, 07964) and diagrams were drawn by using standard Camera Lucida
technique.[7,8,9] External morphological evaluation are shown in Fig. 1.
[image:3.595.139.455.124.215.2]
Fig. 1: External morphology of fruit of Trachyspermum ammi (L.) Sprague Powder microscopy
Few mg of powder was washed in water, excess water was removed by decantation. Washing
process was repeated to clear all extraneous and interfering materials and plant debris was
isolated as much as possible; a few mg in 50% glycerin was mounted; a few mg of the
washed material was treated in saturated chloral hydrate solution for 3-5 hrs; washed in water
and mounted in 50% glycerin; another few mg of plant debris was stained in iodine (IKI) and
mounted in glycerin. Different cell components were observed under compound light
microscope ((Olympus OIC, 07964)) and diagrams were drawn by using standard Camera
Lucida technique.[7,8]
Powder analysis: Presence of unicellular warty trichome as protuberances, profuse oil globules of different sizes, and groups of endosperm cells, characterized, filled with profuse
oil globules and few aleurone grains, groups of polygonal mesocarp cells and few spiral
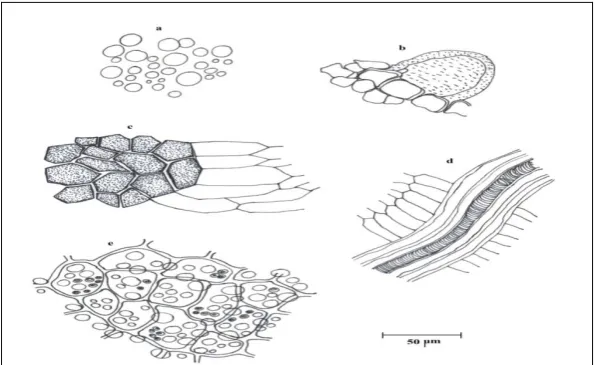
vessels with fibre.[10,11] Pictures of powder analysis of fruit are shown in Fig.2.
[image:3.595.149.447.542.724.2]a: Oil globules of different sizes , b: Unicellular warty trichomes as protuberances, c:
Groups of polygonal mesocarp cells, d: Spiral vessel with fibre, e: Group of endosperm cells
filled with profuse oil globules and few aleurone grains.
Method Development
A CAMAG HPTLC system (Switzerland) comprising CAMAG Linomat 5 applicator,
CAMAG TLC scanner 3, CAMAG Wincats software, version 1.44, Hamilton syringe
(100µl), CAMAG Reprostar 3, CAMAG TLC plate heater, CAMAG UV Cabinet were used
for the study. Silica gel 60F254 Aluminum plates (Merck) was used as stationary phase.
Hexane : Ethyl acetate (8:2; v/v). was used as mobile phase. Methanol was used as solvent.
PREPARATION OF STANDARD AND SAMPLE DRUG SOLUTION Preparation of Standard solution
Accurately weighed 1 mg of Thymol was dissolved in 10 ml of methanol in a volumetric
flask. This stock solution containing 100 mcg / ml thymol was prepared in methanol and this
solution was used as calibration solution in the range of 2.0, 3.0, 4.0, 5.0 and 6.0 μl volumes
gave a series of spots covering the range 200 - 600 ng of thymol.
Preparation of Sample solution
1gm fine dust of Ajwain (Trachyspermum ammi). was gently refluxed in 60ml methanol for
2hrs. and filtered through whatman filter paper (No. 41, pore size : 20-25µm). The residue
was refluxed again with 40ml methanol for 2hr. and filtered it same as before. The combined
filtrates were evaporated to make it a final volume of 10ml. Now 1ml of this solution was
diluted to 10 ml with methanol and this was used for estimation of the thymol in the plant.
HPTLC method and Chromatographic conditions
The chromatographic estimation was performed using the following conditions. Stationary
phase was precoated silica gel 60F254 aluminium sheets (10x10cm) and the mobile phase used
was Hexane: Ethylacetate (8:2; v/v). The chamber saturation time employed was 20 mins and
the developing distance was 8 cm. scanning wavelength of 278 nm with a slit dimention of
(6.0x 0.45)mm.micro and scanning speed of 20mm/s were employed.
METHOD VALIDATION
The developed method is validated as per the ICH guidelines.[12] The developed method was validated in terms of linearity, precision, accuracy, limit of detection (LOD), limit of
Precision and accuracy
The precision of the method in terms of intra-day precision (%RSD) was determined by
analysing thymol standard solutions in the range (200-600ng/spot) three times on the same
day. Inter-day precision (%RSD) and accuracy of the assay assessed by analyzing these
solutions (200-600ng/spot) on three different days over a period of one week. Accuracy was
expressed as percent recovery.
Specificity
Thec specificity of the method was as curtained by analyzing standard drug and the sample.
The spot for Thymol in sample was confirmed by compairing Rf and spectra of spot with that
of standard. The peak purity of Thymol was assessed by compairing the spectra at three
different levels i.e, peak start, peak apex and peak end positions of the spot.
RESULTS AND DISCUSSION
Selection and optimization of mobile phase
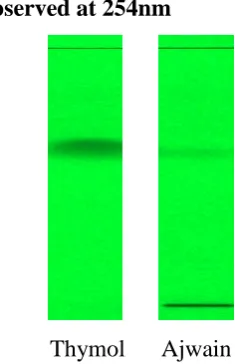
A wave length of 278nm was chosen for quantification .The Rf value of Thymol after
development with mobile phase Hexane: Ethylacetate (8.0:2.0v/v) was 0.46 and shown in
Fig3.
Observed at 254nm
[image:5.595.227.345.510.692.2]
Thymol Ajwain
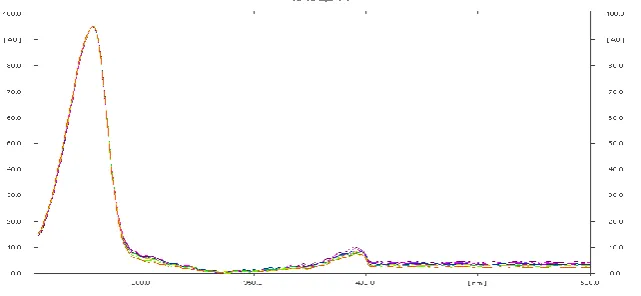
The validated calibration range was 200-600 ng/spot , (r2 =0.99998). The spots were scanned at 278nm which is the λmax , shown in Fig.4 and the values are shown in the Table No. 1
Fig. No.4 Typical HPTLC Chromatogram of the λmax of the thymol by HPTLC method.
Table No.1 Values of λmax
Track No. Rf Assined substance Max. signal
1 0.46 Thymol 131AU @278nm
2 0.46 Thymol 141AU @278nm
3 0.46 Thymol 167AU @278nm
4 0.46 Thymol 182AU @278nm
5 0.46 Thymol 194AU @278nm
6 0.46 Thymol 201AU @278nm
7 0.46 Thymol 182AU @278nm
8 0.46 Thymol 210AU @278nm
The calibration was linear in the concentration range of 200-600ng/spot. The linear
regression equation was Y = -232.4 +4.236 X, where „Y‟ is the peak area and „X‟ is the
[image:6.595.94.472.319.459.2]concentration of thymol were shown in Table No. 2
Table 2: Characteristic parameters for the proposed HPTLC method
Parameters HPTLC
Thymol
Calibration range (ng/spot) 200 – 600
Detection wave length 278nm
Mobile phase (Hexane : Ethyl acetate) 8.0/2.0
Rf value 0.46
Regression equation (y*) Y=-232.446 + 4.236*X
Slope(b) 4.236
Intercept (a) -232.446
Correlation coefficient (r2) 0.99998
Limit of detection (ng/spot) 50
Limit of quantification (ng/spot) 200
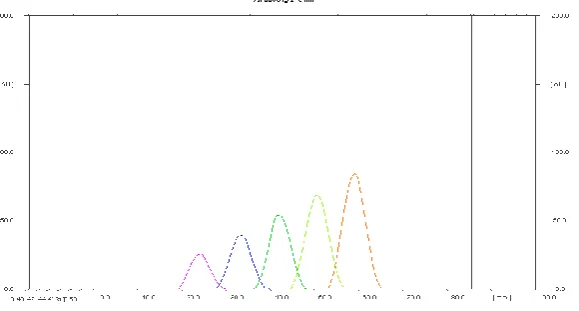
For determination of the linearity curves of area vs. concentration , different amounts of stock
solution of Thymol was applied on the HPTLC plate and analysed.The calibration curve of
[image:7.595.145.450.146.280.2]standard Thymol is shown in Fig. 5.
Fig. 5 : Calibration curve of thymol by HPTLC method
The linearity was found in the concentration range of 200-600ng/spot. The correlation
co-efficient was found to be 0.99998.The results are presented as in Table 3.
Table 3: Calibration data of thymol by HPTLC method
S.NO Amount in ng/Spot Rf values Peak area
1 200 0.46 619.2 AU
2 300 0.46 1031.5 AU
3 400 0.46 1416.3 AU
4 500 0.46 1889.2 AU
5 600 0.47 2308.3 AU
[image:7.595.157.447.525.680.2]3D- display of calibration curve of Thymol by HPTLC method is shown in Fig. 6.
Fig..6: 3D-Display Calibration curve of thymol by HPTLC method
The drug peak area was calculated for each concentration level and a graph was plotted of
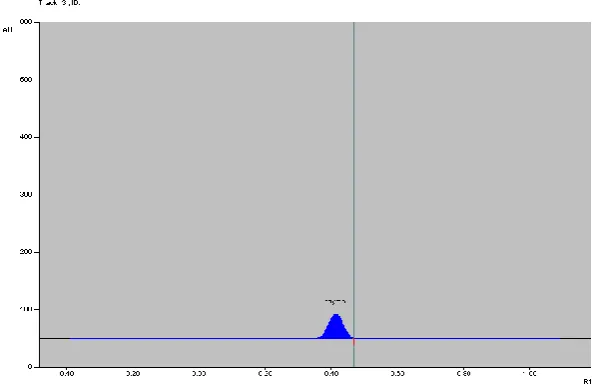
Fig. 7: Typical HPTLC Chromatogram of Thymol by HPTLC method
The calibration curve of thymol with market sample , Ajwain (Trachyspermum ammi) is
shown in Fig. 8.
Fig. 8: Calibration curve of thymol with sample , Ajwain (Trachyspermum ammi) by HPTLC method
Calibration data of thymol along with the sample by HPTLC method S.NO Amount in ng/Spot Rf values Peak area
1 200 0.46 621.60 AU
2 300 0.46 1023.03 AU
3 300 0.46 1164.47 AU
3 400 0.46 1435.63 AU
[image:8.595.147.447.95.287.2]5 600 0.47 2343.95 AU
Quantification of thymol in the sample
The regression equations were used to estimate the amounts of thymol present in the sample
Ajwain (Trachyspermum ammi). The content of thymol present in the sample is shown in
[image:9.595.80.514.216.359.2]Table: 4.
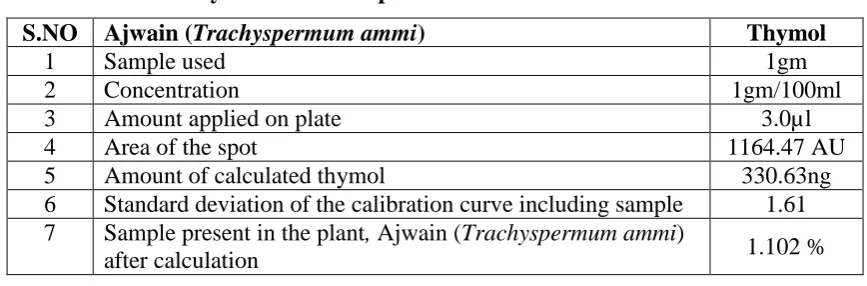
Table 4: Content of thymol in the sample
S.NO Ajwain (Trachyspermum ammi) Thymol
1 Sample used 1gm
2 Concentration 1gm/100ml
3 Amount applied on plate 3.0µl
4 Area of the spot 1164.47 AU
5 Amount of calculated thymol 330.63ng
6 Standard deviation of the calibration curve including sample 1.61 7 Sample present in the plant, Ajwain (Trachyspermum ammi)
after calculation 1.102 %
VALIDATION OF METHOD Recovery studies
The proposed method, when used for determination of thymol from market sample , afforded
recovery ranging from 99.52% - 100.91% for thymol.
Precision
The precision of the method in terms of intra – day precision (% RSD) was determined by
analyzing Thymol standard solutions in the range (200 -600 ng / spot) three times on the
same day. Inter - day precision (% RSD) was assessed by analyzing these solutions (200 -
600 ng / spot) on three different days over a period of one week. The results of the precision
studies are shown in.
Table 5: Precision of Thymol by HPTLC method
Intraday precision 5µl/spot
(in ng) (Area)
Std.
Dev % RSD
1st set
200 1085.75
18.53 1.71 %
200 1094.97
200 1059.26
2nd set
300 1851.62
4.05 0.22 %
Accuracy
Determination of method
accuracy by the standard addition method at three concentration levels are shown in Table: 6 Table 6: Recovery studies of thymol by HPTLC method
S.No Sample
Initial amount (ng/spot) Amount added (ng/spot) Total amount after addition (ng/spot) Amount recovered (ng/spot) Recovery (%)
1 Ajwain
(Trachyspermum ammi) 330.63 50 50 50 380.63 380.63 380.63 378.82 380.63 380.63 99.52% 330.63 100 100 100 430.63 430.63 430.63 448.48 429.55 425.65 100.91% 330.63 150 150 150 480.63 480.63 480.63 480.63 480.63 480.63 98.94% Robustness
The robustness of the HPTLC method was evaluated by analyzing the system suitability
parameters after varying the detection wave length (±2%), mobile phase volume (±2%). None
of these alterations caused a significant change in peak area RSD. So the system is robust.
300 1854.62
3rd set
400 2662.85
1.73 0.07%
400 2665.57
400 2662.35
Interday precision 5µl/spot
(in ng) (Area)
Std.
Dev % RSD
1st day
200 1056.51
8.02 0.77 %
200 1045.92
200 1050.62
200 1052.63
200 1035.65
2nd day
200 1082.53
20.95 1.95 %
200 1033.69
200 1078.52
200 1081.48
200 1079.02
3rd day 200 1042.62
8.63
0.82 %
200 1055.69
200 1060.03
200 1061.24
Limit of Detection and Limit of Quantitation
The LOD and LOQ of piperine was found to be 12.6AU (50ng/spot) and 36.7
AU(200ng/spot) respectively.
Specificity
The specificity of the proposed method was determined by comparing the sample and
standard peak for its Rf and UV spectra. Three point peak purity i,e peak start , peak apexand
peak end was compared and found superimposed. This indicated that standard thymol and
market sample peaks were not merging with any other components and impurities.
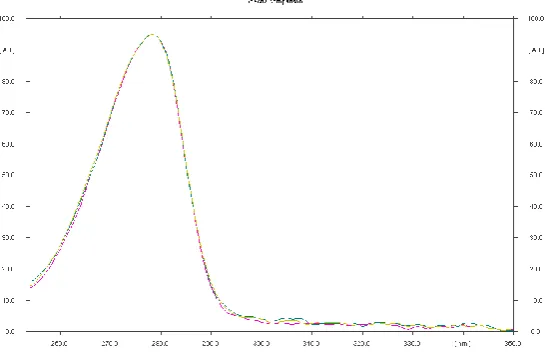
The peak purity of thymol was assessed by comparing the spectra at three different levels, i,e
peak start, peak apex and peak end position. Shown in Fig. 9
[image:11.595.162.438.311.489.2]
Fig. 9: Overlay spectra of Thymol(standard )and Ajwan(sample) in absorption mode in the UV range taken on the CAMAG TLC scanner 3.
CONCLUSION
A rapid, simple, accurate, sensitive and specific HPTLC method developed and validated.
This developed and validated method was used for quantitative estimation and macro and
micro fingerprinting analysis of thymol from different geographical sources of Ajwain
(Trachyspermum ammi) and its formulation. Also this study can be employed for the rutine
quality control analysis of thymol in ajwain.
ACKNOWLEDGEMENT
All authors are highly thankful to the Director General of CCRAS, New Delhi for providing
REFERENCES
1. Nagalakshmi G, Shankaracharya NB, Puranaik J, et al.(2000). Studies on chemical and
technological aspects of ajowan (Trachyspermum ammi) syn (Carum copticum Hiren)
seeds. J of Food Sci. Technology., 2000; 37: 277- 281.
2. Zargari A,(1996). Medicinal Plants. Tehran University Publications., 1996; 2: 975.
3. Balbaa SI, Hilal SH and Haggag MY,(1973). The volatile oil from the herb and fruits of
Carum copticum at different stages of growth. Planta Med., 1973; 23: 311–320.
4. Baytop T and Sütlüpinar N,(1986). Characteristics of “Nanahan” cultivated in
Anatolia and its volatile oil. J. Fac. Pharm. I.stanbul., 1986; 22: 73–76.
5. Singh G, Maurya S, Catalan C, Lampasona MP,2004. Chemical constituents, antifungal
and antioxidative effects of Ajwain essential oil and its acetone extract. J. Agric. Food
Chemistry., 2004; 52(11): 3292–3296.
6. Kumar KA, Choudhary RK, Joshi B, Ramya V, Sahithi V, Veena P,(2011).
Determination of antibacterial, antifungal activity and chemical composition of essential
oil portion of unani formulation kulzam. Int. J. Green Pharm., 2011; 5: 28-33.
7. Lala PK,(1981). Practical Pharmacognosy , 1st Ed., Lina Guha Publisher, Calcutta, 1981;
167-169.
8. Lala PK,(1981). Practical Pharmacognosy , 1st Ed., Lina Guha Publisher, Calcutta, 1981;
80-81.
9. Wallis TE,(1981).Text Book of Pharmacognosy, 5th Ed., CBS Publishers,Calcutta, 1981;
578-581.
10.Wallis TE,(1981).Text Book of Pharmacognosy, 5th Ed., CBS Publishers,Calcutta, 1981;
236-242.
11.Anonymous, (2008).The Ayurvedic Pharmacopoeia of India, Govt. of India, Min. of H &
F. W., 1st Ed., Vol I, Dept. of AYUSH, New Delhi, 2008; 170-171.
12.ICH guidelines Q2A, (October 1994).Text on Validation of Analytical Procedure,