Current Problems in Diagnostic RadiologyIIMB Management ReviewJournal of Cardiac FailureJournal of Exotic Pet MedicineBiology of Blood and Marrow TransplantationSeminars in Spine SurgerySeminars in Arthritis & RheumatismCurrent Problems in Pediatric and Adolescent Helath CareSolid State Electronics Letters
Accepted Manuscript
A comparison of two different software packages for the analysis of body composition using computed tomography images
Katie E. Rollins MRCS , Amir Awwad FRCR , Ian A. Macdonald PhD ,
Dileep N. Lobo MS, DM, FRCS, FACS, FRCPE Professor
PII: S0899-9007(18)30592-6 DOI: 10.1016/j.nut.2018.06.003
Reference: NUT 10239
To appear in: The End-to-end Journal
Received date: 13 June 2017 Revised date: 16 May 2018 Accepted date: 19 June 2018
Please cite this article as: Katie E. Rollins MRCS , Amir Awwad FRCR , Ian A. Macdonald PhD , Dileep N. Lobo MS, DM, FRCS, FACS, FRCPE Professor , A comparison of two different software packages for the analysis of body composition using computed tomography images,The End-to-end Journal(2018), doi:10.1016/j.nut.2018.06.003
ACCEPTED MANUSCRIPT
Highlights 1
We clarify the equivalence of body composition analysis from computed
2
tomography (CT) images using two different software packages.
3
Analysis was performed using SliceOmatic and OsiriX packages on 50 patients
4
who had undergone tri-phasic scans.
5
Body composition measures were significantly different between the two
6
software packages, but the clinical significance of these is doubtful.
7
However, we recommend that for serial body composition analysis and for
8
comparative purposes, the software package employed should be consistent.
9
ACCEPTED MANUSCRIPT
11
A comparison of two different software packages for the analysis of body
12composition using computed tomography images
13Katie E Rollins, MRCSa, Amir Awwad, FRCRb, Ian A Macdonald, PhDc,d, Dileep N Lobo, MS,
14
DM, FRCS, FACS, FRCPEa,d
15
aGastrointestinal Surgery, Nottingham Digestive Diseases Centre, National Institute for 16
Health (NIHR) Research Nottingham Biomedical Research Centre, Nottingham University
17
Hospitals and University of Nottingham, Queen’s Medical Centre, Nottingham NG7 2UH, UK
18
b
Sir Peter Mansfield Imaging Centre (SPMIC), University of Nottingham, University Park,
19
Nottingham, NG7 2RD, UK
20
c
School of Life Sciences, University of Nottingham, Queen’s Medical Centre, Nottingham
21
NG7 2UH, UK
22
d
MRC/ARUK Centre for Musculoskeletal Ageing Research, School of Life Sciences, University
23
of Nottingham, Queen’s Medical Centre, Nottingham NG7 2UH, UK
24
25
Address for correspondence:
26
Professor Dileep N Lobo
27
Gastrointestinal Surgery
28
Nottingham Digestive Diseases Centre
29
National Institute for Health Research Nottingham Biomedical Research Unit
30
E Floor, West Block
31
Queens Medical Centre
32
Nottingham NG7 2UH, UK
33 Tel: +44-115-8231149 34 Fax: +44-115-8231160 35 E-mail: [email protected] 36 37 38
Funding: This work was supported by the Medical Research Council [grant number
39
MR/K00414X/1], Arthritis Research UK [grant number 19891]. KER was funded by a
ACCEPTED MANUSCRIPT
Research Fellowship from the European Society for Clinical Nutrition and Metabolism41
(ESPEN). The funders had no role in the design, execution and writing up of the study.
42 43
Running Head: Software Packages for Body Composition Analysis
44
45
Abbreviations used: CT = computed tomography; DICOM = Digital Imaging and
46
Communications in Medicine; FFM = fat free mass; FM = fat mass; HU = Hounsfield units;
47
SAT = subcutaneous adipose tissue; SMHU = skeletal muscle Hounsfield units; SMI = skeletal
48
muscle index; VAT = visceral adipose tissue
49
50
Word Count: 1969 (excluding abstract, references, tables and figures)
51
52
This paper was presented to the Annual Congress of the European Society for Clinical
53
Nutrition and Metabolism, Copenhagen, September 2016 and has been published in
54
abstract form Clin Nutr 2016;35 (Suppl 1):S13-14.
55
ACCEPTED MANUSCRIPT
Abstract
57
Objectives: Body composition analysis from computed tomography (CT) imaging has
58
become widespread. However, the methodology used is far from established. Two main
59
software packages are in common usage for body composition analysis, with results used
60
interchangeably. However, the equivalence of these has not been well established. The aim
61
of this study was to compare the results of body composition analysis performed using the
62
two software packages to assess their equivalence.
63
Methods: Tri-phasic abdominal CT scans from 50 patients were analysed for a range of body
64
composition measures at the third vertebral level using OsiriX (v7.5.1, Pixmeo, Switzerland)
65
and SliceOmatic (v5.0, TomoVision, Montreal, Canada) software packages. Measures
66
analysed were skeletal muscle index (SMI), fat mass (FM), fat free mass (FFM) and mean
67
skeletal muscle Hounsfield Units (SMHU).
68
Results: The overall mean SMI calculated using the two software packages was significantly
69
different (SliceOmatic 51.33 vs. OsiriX 53.77, p<0.0001), and this difference remained
70
significant for non-contrast and arterial scans. When FM and FFM were considered, again
71
the results were significantly different (SliceOmatic 33.7kg vs. OsiriX 33.1kg, p<0.0001;
72
SliceOmatic 52.1kg vs. OsiriX 54.2kg, p<0.0001, respectively), and this difference remained
73
for all phases of CT. Finally, when mean SMHU was analysed, this was also significantly
74
different (SliceOmatic 32.7 HU vs. OsiriX 33.1 HU, p=0.046).
75
Conclusions: All four body composition measures were statistically significantly different by
76
the software package used for analysis, however the clinical significance of these differences
ACCEPTED MANUSCRIPT
is doubtful. Nevertheless, the same software package should be utilised if serial78
measurements are being performed.
79
80
Key words: computed tomography; body composition; sarcopenia; myosteatosis; OsiriX;
81
SliceOMatic
82
ACCEPTED MANUSCRIPT
Introduction
84
Computed tomography (CT) analysis of body composition to measure fat mass (FM) and fat
85
free mass (FFM), calculate skeletal muscle index (SMI), and diagnose sarcopenia and
86
myosteatosis has become increasingly common, with literature now linking sarcopenia and
87
myosteatosis with reduced overall survival [1, 2], decreased tolerance to chemotherapy [3,
88
4] and increased complications [5, 6] following surgery in patients presenting with various
89
types of malignancy.
90
However, the methodology for calculating body composition from CT images is variable
91
between studies, from the nature of the CT scan used including the vertebral level, to the
92
use of contrast medium, to the software used to perform the analysis. The impact of the use
93
of contrast medium in CT scanning in body composition analysis has previously been
94
recognised to have a significant effect upon results, especially the diagnosis of myosteatosis
95
[7, 8]. Despite these inconsistencies in analysis, the results of these studies are used
96
interchangeably, with the definition of neither sarcopenia or myosteatosis stipulating any
97
conditions about how these derived values are calculated.
98
There are currently two software packages used commonly to analyse body composition
99
from CT scans: SliceOmatic (TomoVision, Montreal, Canada) and OsiriX (Pixmeo,
100
Switzerland), the results of which are also used interchangeably. One study in patients with
101
rectal cancer [9] has suggested that SliceOmatic, ImageJ (National Institutes of Health,
102
Bethesda, MD, USA), FatSeg [Biomedical Imaging Group Rotterdam of Erasmus MC,
103
Rotterdam, The Netherlands, using MeVisLab (Mevis Medical Solutions, Bremen, Germany)]
104
and OsiriX analysis provide excellent levels of agreement. However, this study [9] did not
105
consider mean skeletal muscle Hounsfield Unit as a surrogate for myosteatosis. The aim of
ACCEPTED MANUSCRIPT
the present study was to compare the SliceOmatic and OsiriX software packages and107
determine if there was a difference in calculated measures of body composition, namely
108
SMI, FM, FFM and mean skeletal muscle Hounsfield units (SMHU), using CT scan images.
ACCEPTED MANUSCRIPT
Methods
110
In a single centre retrospective study, CT scans from 50 patients who underwent triple
111
phase abdominal scans (non-contrast, arterial and portovenous phases) between April 2014
112
and September 2015 were analysed using two different software packages; SliceOmatic v5.0
113
and OsiriX v7.5.1. The patients were initially identified retrospectively from the
114
Computerised Radiology Information System (CRIS v 2.09, HSS, Healthcare Systems,
115
Mansfield, UK). The underlying pathology necessitating the CT scan was variable, and
116
included trauma, suspected intra-abdominal or gastrointestinal bleeding, pancreatic or
117
hepatic pathology and renal lesions. Three axial slices were selected from each tri-phasic
118
abdominal CT scan (total analysed slices in the study = 50 x 3 = 150 slices). Each slice was
119
anatomically localised using coronal and sagittal multi-planar reformats (MPRs) to ensure it
120
specifically lies at the third lumbar vertebra (L3). Slices were analysed as Digital Imaging and
121
Communication in Medicine (DICOM) images obtained from the Picture Archiving and
122
Communication System (PACS). Electronic patient data were collated for patient
123
demographics, including height and weight data from within one month of the date of the
124
CT scan.
125
Scan Acquisition
126
During the study period there were two CT scanners in use at Nottingham University
127
Hospitals NHS Trust were the study was conducted; (1) Ingenuity 128; Phillips Healthcare,
128
Best, The Netherlands and (2) Optima CT660, GE Healthcare, WI, USA and these were
129
calibrated once per week to ensure that quality assurance testing was met for the
130
Hounsfield Unit (HU) density of air (HU=-1000) and water (HU=zero). Arterial and
131
portovenous phase scans were obtained using intravenous administration of contrast
ACCEPTED MANUSCRIPT
medium (100 ml fixed dose of Iopamidol, Niopam 300, Bracco, Buckinghamshire, UK). The133
timings of different phase scans were standardised, firstly with an unenhanced scan, then
134
the arterial phase performed at 10-20 seconds and finally the portovenous scan at 65
135
seconds.
136
Body Composition Analysis
137
The three phases of CT scan slice on each individual patient were analysed by a single
138
observer, our group having previously established high rates of inter-observer reliability
139
(SMI r2=0.975, p<0.0001; mean SMHU r2=0.965, p<0.0001) in the analysis of body
140
composition variables using the techniques adopted in this study [7]. The software
141
packages, SliceOmatic and OsiriX were each used to calculate the cross-sectional area of
142
skeletal muscle, visceral and subcutaneous/intramuscular adipose tissue. The different
143
tissue types were identified by their differing radiodensities; skeletal muscle of -29 to +150
144
HU, visceral adipose of 150 to 50 HU and subcutaneous/intramuscular adipose of 190 to
-145
30 HU. The mean SMHU density was also recorded for all scans analysed.
146
Previously described regression equations for the calculation of whole body FM and FFM
147
from a single cross-sectional CT slice were used [10]:
148
Total body fat mass (FM) (kg) = 0.042 x [total adipose tissue area at L3(cm2)] + 11.2
149
Total body fat free mass (kg) = 0.3 x [total skeletal muscle area at L3 (cm2)] + 6.06
150
The cross-sectional area of skeletal muscle was also transformed into the skeletal muscle
151
index (SMI) by modifying it by patient height.
152
ACCEPTED MANUSCRIPT
Statistical Analysis154
Statistical analysis was performed using SPSS (v22.0, IBM, SMSS Statistics, Armonk, NY, USA)
155
and GraphPad Prism v6.0 (GraphPad, La Jolla, CA, USA). FM, FFM, SMI and mean SMHU
156
density values, with data checked for normality using the D’Agostino-Pearson normality
157
test. Data were compared between different software packages using the Student t-paired
158
test when normality was confirmed, and the Wilcoxon matched-pairs signed rank test when
159
the data were not distributed normally. Pearson’s coefficient of correlation was used to
160
compare the body composition values calculated from the two different software packages
161
and Bland Altman plots utilised to reveal any systematic error between the analyses. All
162
analyses were performed using two tailed testing with a significance level set at p<0.05.
ACCEPTED MANUSCRIPT
Results
164
Of the 50 patients included during the study period of April 2014 to September 2015 there
165
were 33 males and 17 females, with a mean body mass index (BMI) of 30.4 (SD 4.0) kg/m2.
166
Skeletal Muscle Index (SMI)
167
Analysis of body composition by OsiriX gave a significantly greater value for SMI than scans
168
analysed using SliceOmatic (53.8 cm2/m2 vs. 51.3 cm2/m2, p<0.0001) on Wilcoxon
matched-169
pairs signed rank test, performed due the D’Agostino-Pearson test demonstrating a lack of
170
normality in the data from OsiriX analysis (K2=7.831, p=0.012). This difference remained
171
between scans analysed in non-contrast and arterial phase, however there was no
172
difference in scans analysed in the portovenous phase (Table 1).
173
There was a significant positive correlation in SMI between analysis conducted using OsiriX
174
and SliceOmatic software (r=0.965, p<0.0001) and evidence of a positive systematic bias on
175
Bland Altman testing (average bias = 2.432) (Figure 1).
176
Fat Mass (FM)
177
FM calculated by OsiriX was significantly lower than that calculated by SliceOmatic (33.1 kg
178
vs. 33.7 kg, p<0.0001) as calculated by the student t-paired test as the data were
179
demonstrated to be normally distributed, and this difference was seen when all individual
180
phase data were analysed (Table 1).
181
The correlation between FM analysis using OsiriX and SliceOmatic was significant (r=0.997,
182
p<0.0001) and Bland Altman testing revealed no evidence of a systematic bias (average bias
183
= -0.680) (Figure 2).
ACCEPTED MANUSCRIPT
Fat Free Mass (FFM)185
Analysis of FFM using the two software packages demonstrated significantly greater values
186
with OsiriX analysis versus SliceOmatic (54.2 kg vs. 52.1 kg, p<0.0001) as calculated by the
187
student t-paired test as the data were demonstrated to be normally distributed. This finding
188
remained consistent in slices analysed in non-contrast, arterial and portovenous phases
189
(Table 1).
190
There was a significant positive correlation between analysis of FFM performed using OsiriX
191
versus SliceOmatic software packages (r=0.977, p<0.0001) and there was evidence of a
192
systematic bias on Bland Altman testing (average bias = 2.16) (Figure 3).
193
Mean Skeletal Muscle Hounsfield Units (SMHU)
194
The mean SMHU density was overall significantly higher when analysed using OsiriX versus
195
SliceOmatic software (33.1 vs. 32.7 HU, p=0.046) as calculated by the student t-paired test
196
as the data were demonstrated to be normally distributed. However, when the individual
197
phases of CT scan were compared, there were no significant differences between OsiriX and
198
SliceOmatic (Table 1).
199
There was a significant positive correlation in the mean SMHU between the two software
200
packages (r=0.976, p<0.0001) and no evidence of any systematic bias (average bias = 0.360)
201
(Figure 4).
ACCEPTED MANUSCRIPT
Discussion
203
This study provides evidence of the relative clinical equivalence of analysis of body
204
composition measures analysed by two different software packages, namely OsiriX and
205
SliceOmatic. However, statistically significantly greater SMI, FFM and mean SMHU values
206
and significantly lower FFM were demonstrated when the analyses were performed with
207
OsiriX compared with SliceOmatic. There was significant positive correlation for all measures
208
when the two software packages were compared, although Bland Altman testing revealed
209
evidence of a significant systematic bias when analysing SMI and FFM. The results of the
210
present study are similar to those of the previously published comparison of OsiriX,
211
SliceOmatic, ImageJ and FatSeg [9] which found that body composition in terms of
cross-212
sectional muscle area, visceral adipose tissue area and subcutaneous adipose tissue area
213
had excellent levels of agreement, suggesting that the results of analysis using the different
214
software packages could be used interchangeably. However, this study suggested evidence
215
of a systematic bias in the analysis of SMI and FFM which should be considered when
216
comparing results of body composition analysis performed using different software
217
packages. That study [9], however, did not include myosteatosis, as calculated by the mean
218
SMHU value, which is becoming increasingly utilised in body composition analysis. In
219
addition, the present study considered the different phases of abdominal CT (non-contrast,
220
arterial and portovenous) which was not considered by the previous literature; indeed no
221
statement is made regarding the phase of CT scan considered by the previous study [9].
222
Whilst the results of the present study demonstrate statistically significant differences in
223
body composition variables by software package used for analysis, the clinical significance of
224
several of these outcomes is doubtful. The mean SMHU was different by just 0.4 HU, much
ACCEPTED MANUSCRIPT
less than the difference in SMHU between different phases of CT scan (in OsiriX analysis a226
difference of 5.1 HU was seen between non-contrast and portovenous scans and 5.3 HU in
227
SliceOmatic analysis). This discrepancy in radiodensity of skeletal muscle has been
228
documented previously [7] and its clinical relevance questioned. Therefore, with such a
229
small difference this is very unlikely to impact significantly upon the diagnosis of
230
myosteatosis. Similarly, the difference between software packages was minimal in FM
231
analysis, with an overall difference of 0.7 kg, which represents just 1.8% of the overall mass
232
from OsiriX analysis. The difference was more pronounced in SMI and FFM analysis, with a
233
difference of 2.5 cm2/m2 (4.6%) and 2.1 kg (3.9%) respectively, which are more likely to
234
represent a clinically relevant difference. This difference in body composition variables has
235
not been demonstrated previously, and the results of body composition analysis using OsiriX
236
and SliceOmatic software packages are used interchangeably within the literature.
237
This study was conducted retrospectively. However, all scans were performed on individual
238
patients at the same time, so whilst the hydration status was not known, it would be
239
consistent for all scans and, therefore, would not impact upon these results. Height and
240
weight data were not always available from the date of the scan which may render the
241
calculation of body composition measures less accurate.
242
Further work on body composition analysis is necessary in order to standardise the
243
methodology used to calculate clinical body composition outcomes including the presence
244
of sarcopenia and myosteatosis. This should include muscle biopsy samples of the rectus
245
abdominis at the L3 vertebral level to correlate radiological and histological analysis of
246
skeletal muscle.
247
ACCEPTED MANUSCRIPT
This is the first study to investigate the analysis of body composition variables including249
myosteatosis by software package of analysis, and has demonstrated statistically significant
250
differences in values in all outcomes. Although some statistically significant differences were
251
demonstrated between the two software packages, these are unlikely to be clinically
252
relevant. However, given the demonstrable differences in body composition measures, it is
253
suggested that the two packages should not be used interchangeably for clinical or research
254
purposes.
255
256
257
258
259
260
261
262
263
ACCEPTED MANUSCRIPT
Conflict of Interest:
265
None of the authors has any direct conflicts of interest to declare. IAM has received
266
research funding from Mars Inc. and serves on the advisory board of IKEA for unrelated
267
work. DNL has received unrestricted research funding and speaker’s honoraria from
268
Fresenius Kabi, BBraun and Baxter Healthcare for unrelated work. He has also served on
269
advisory boards for Baxter Healthcare and AbbVie in the past.
270
271
Author Contributions:
272
All authors contributed to the
273
• conception and design of the study
274
• collection, analysis or interpretation of data
275
• drafting the article or revising it critically for important intellectual content
276
• and final approval of the version to be published.
277
278
Funding
279
This work was supported by the Medical Research Council [grant number MR/K00414X/1],
280
Arthritis Research UK [grant number 19891]. KER was funded by a Research Fellowship from
281
the European Society for Clinical Nutrition and Metabolism (ESPEN). The funders had no role
282
in the design, execution and writing up of the study.
283
284
ACCEPTED MANUSCRIPT
References
286
[1] Rollins KE, Tewari N, Ackner A, Awwad A, Madhusudan S, Macdonald IA, et al. The
287
impact of sarcopenia and myosteatosis on outcomes of unresectable pancreatic cancer or
288
distal cholangiocarcinoma. Clin Nutr. 2016;35:1103-9.
289
[2] Tan BH, Birdsell LA, Martin L, Baracos VE, Fearon KC. Sarcopenia in an overweight or
290
obese patient is an adverse prognostic factor in pancreatic cancer. Clin Cancer Res.
291
2009;15:6973-9.
292
[3] Choi Y, Oh DY, Kim TY, Lee KH, Han SW, Im SA, et al. Skeletal muscle depletion predicts
293
the prognosis of patients with advanced pancreatic cancer undergoing palliative
294
chemotherapy, independent of body mass index. PLoS One. 2015;10:e0139749.
295
[4] Miyamoto Y, Baba Y, Sakamoto Y, Ohuchi M, Tokunaga R, Kurashige J, et al. Negative
296
impact of skeletal muscle loss after systemic chemotherapy in patients with unresectable
297
colorectal cancer. PLoS One. 2015;10:e0129742.
298
[5] Levolger S, van Vugt JL, de Bruin RW, JN IJ. Systematic review of sarcopenia in patients
299
operated on for gastrointestinal and hepatopancreatobiliary malignancies. Br J Surg.
300
2015;102:1448-58.
301
[6] Joglekar S, Nau PN, Mezhir JJ. The impact of sarcopenia on survival and complications in
302
surgical oncology: A review of the current literature. J Surg Oncol. 2015;112:503-9.
303
[7] Rollins KE, Javanmard-Emamghissi H, Awwad A, Macdonald IA, Fearon KCH, Lobo DN.
304
Body composition measurement using computed tomography: does the phase of the scan
305
matter? Nutrition. 2017;41:37-44.
306
[8] Boutin RD, Kaptuch JM, Bateni CP, Chalfant JS, Yao L. Influence of IV contrast
307
administration on CT measures of muscle and bone attenuation: implications for sarcopenia
308
and osteoporosis evaluation. AJR Am J Roentgenol. 2016;207:1046-54.
309
[9] van Vugt JL, Levolger S, Gharbharan A, Koek M, Niessen WJ, Burger JW, et al. A
310
comparative study of software programmes for cross-sectional skeletal muscle and adipose
311
tissue measurements on abdominal computed tomography scans of rectal cancer patients. J
312
Cachexia Sarcopenia Muscle. 2017;8:285-97.
313
[10] Mourtzakis M, Prado CM, Lieffers JR, Reiman T, McCargar LJ, Baracos VE. A practical
314
and precise approach to quantification of body composition in cancer patients using
315
computed tomography images acquired during routine care. Appl Physiol Nutr Metab.
316
2008;33:997-1006.
317
318
ACCEPTED MANUSCRIPT
Legends for figures
320
ACCEPTED MANUSCRIPT
Figure 1 – Correlation between mean skeletal muscle index (SMI) calculated using OsiriX and322
SliceOmatic software packages and Bland Altman plots to assess for systematic bias.
ACCEPTED MANUSCRIPT
ACCEPTED MANUSCRIPT
Figure 2 – Correlation between fat mass (FM) calculated using OsiriX and SliceOmatic325
software packages and Bland Altman plots to assess for systematic bias.
ACCEPTED MANUSCRIPT
ACCEPTED MANUSCRIPT
Figure 3 – Correlation between fat free mass (FFM) calculated using OsiriX and SliceOmatic328
software packages and Bland Altman plots to assess for systematic bias.
ACCEPTED MANUSCRIPT
ACCEPTED MANUSCRIPT
Figure 4 – Correlation between mean skeletal muscle Hounsfield Units (SMHU) calculated331
using OsiriX and SliceOmatic software packages and Bland Altman plots to assess for
332
systematic bias.
333
334
ACCEPTED MANUSCRIPT
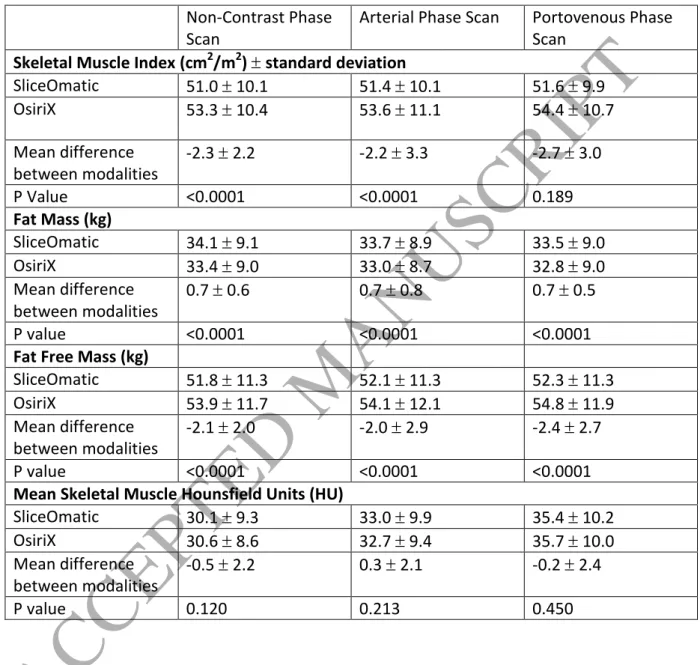
Table 1 – Comparison of body composition measures calculated by OsiriX versus SliceOmatic336
software packages in non-contrast, arterial and portovenous phase scans.
337
338
339
340
Non-Contrast Phase Scan
Arterial Phase Scan Portovenous Phase Scan
Skeletal Muscle Index (cm2/m2) standard deviation
SliceOmatic 51.0 10.1 51.4 10.1 51.6 9.9 OsiriX 53.3 10.4 53.6 11.1 54.4 10.7
Mean difference between modalities
-2.3 2.2 -2.2 3.3 -2.7 3.0
P Value <0.0001 <0.0001 0.189
Fat Mass (kg)
SliceOmatic 34.1 9.1 33.7 8.9 33.5 9.0 OsiriX 33.4 9.0 33.0 8.7 32.8 9.0 Mean difference
between modalities
0.7 0.6 0.7 0.8 0.7 0.5
P value <0.0001 <0.0001 <0.0001
Fat Free Mass (kg)
SliceOmatic 51.8 11.3 52.1 11.3 52.3 11.3 OsiriX 53.9 11.7 54.1 12.1 54.8 11.9 Mean difference
between modalities
-2.1 2.0 -2.0 2.9 -2.4 2.7
P value <0.0001 <0.0001 <0.0001
Mean Skeletal Muscle Hounsfield Units (HU)
SliceOmatic 30.1 9.3 33.0 9.9 35.4 10.2 OsiriX 30.6 8.6 32.7 9.4 35.7 10.0 Mean difference
between modalities
-0.5 2.2 0.3 2.1 -0.2 2.4