STUDIES OF LOW-MASS INTERACTING BINARY
STARS
Paul P. Rainger
A Thesis Submitted for the Degree of PhD
at the
University of St Andrews
1990
Full metadata for this item is available in
St Andrews Research Repository
at:
http://research-repository.st-andrews.ac.uk/
Please use this identifier to cite or link to this item:
http://hdl.handle.net/10023/14369
L—
THE UNIVERSITY OF ST. ANDREWS
Studies of low-mass
interacting
Binary Stars.
P au l P. R ainger.
Subm itted for th e degree of Ph.D .
A pril 1990.
ProQuest Number: 10171294
All rights reserved
INFORMATION TO ALL USERS
The quality of this reproduction is dependent upon the quality of the copy submitted.
In the unlikely event that the author did not send a com plete manuscript and there are missing pages, these will be noted. Also, if material had to be removed,
a note will indicate the deletion.
uest
ProQuest 10171294
Published by ProQuest LLC (2017). Copyright of the Dissertation is held by the Author.
All rights reserved.
This work is protected against unauthorized copying under Title 17, United States C ode Microform Edition © ProQuest LLC.
ProQuest LLC.
789 East Eisenhower Parkway P.Q. Box 1346
I, Paul Rainger, hereby certify that this thesis has been composed by myself, that it is a record of my own work and that it has not been accepted in partial or complete fulfilment of any other degree or professional qualification.
P. P. Rainger.
I was admitted to the Faculty of Science of the University of St. Andrews under Ordinance General No. 12 on 1^^ October 1986, and as a candidate for the degree of Ph.D. on 1®^ October 1987.
P. P. Rainger.
R. W , Hilditch.
In submitting tliis thesis to the University of St. Andrews I understand that I am giving permission for it to be made available for use in accordance with the regulations of the University Library for the time being in force, subject to any copyright vested in the work not being affected thereby. I also understand that the title and abstract will be published, and that a copy of the work may be made and supplied to any bona fide
library or research worker.
1
■s
-A cknow ledgm ents
A work of this magnitude naturally involves a large degree of collaboration and it is a pleasure to acknowledge all those who contributed, in one way or another, to the successful completion of this project.
I must thank the numerous undergraduates, fellow research students, members of é
staff, and North East “Fifers” (past and present) who made my time at St Andrews so enjoyable, and whose encouragement and support (usually liquid) was invaluable. On a sadder note, this is probably the last Astronomy PhD Thesis to be produced wholly at the University Observatory.
I am grateful to the staff of the Libraries both at St Andrews and the Royal Observatory Edinburgh, and the Centre de Données Astronomique de Strasbourg for their SIMBAD data base, ail of whom helped in the considerable task of carrying out literature searches on the observed objects.
Tliis work was financially supported mostly by the Science and Engineering Re search Council in the form of a postgraduate studentship award, with im portant con tributions in the “fourth” year from Menzies Campbell MP and my mother, who has encouraged and supported me throughout my University studies.
%
I thank also the staff of the Observatorio del Roque de los Muchachos for their assistance during my observing sessions, and colleagues at St Andrews who helped with other observations presented in this work. Most of the telescope time was generously allocated by the PATT, with other observations made using the facilities of St Andrews University Observatory, the data being reduced using the computing facilities of St An drews University and STARLINK. A big thank you goes to Louise Aikman, who kindly typed thousands of previously published photoelectric data points into the computer, and didn’t complain once.
%
Finally, I am particularly indebted to my supervisor Dr. R.W. Hilditch, Dr. S.A. Bell and Dr. G. Hill for their collaboration on this project. The reduction and analysis programs of Steve Bell and Graham Hill provide the key to unlocking the secrets of a binary system, and Steve could always be relied on to know why the computer wasn’t working. My supervisor, Ron Hilditch, showed a helpful interest throughout the work, and patiently guided me to what, at times, must have seemed an extremely distant finishing line.
Î
A n d those whose heads are searching
in the clouds^ to make discoveries,
mayhe fail to see, what^s on the ground
beneath their feet, not hard to find.
A b stract
Spectroscopic and photometric observations of eight contact/ near-contact bina- . ries are presented and analysed. Spectroscopic observations were obtained at 4200 Â ;1 (radial velocity spectra) and 6563Â (hydrogen-alpha line profiles). New photometric
observations were obtained at visual and infrared wavelengths, and other previously g published light curves are also re-analysed. Absolute dimensions have been obtained
for five systems ; TYBoo, VWBoo, BX And, SS Ari and AGVir, and their evolutionary positions discussed. Four of the systems are found to be in marginal but poor thermal contact, exhibiting regions of apparent “excess luminosity” in their light curves. A qualitative analysis of these “hot spot” regions has been attem pted for the first time using spot models now incorporated into a light curve synthesis programme.
Substantial time for this project was awarded on telescopes funded by the United Kingdom Science and Engineering Research Council (SERC), comprising 14 nights at the Issac Newton Telescope (INT) on La Palma, and 4 nights at the United Kingdom Infrared Telescope (UKIRT) on Mauna Kea. Additional observations were made during an 8 night commissioning run on the Jacobus Kapteyn Telescope (JKT) on La Palma, and extensive observations were made with the Twin Photometric Telescope (TPT)
at St Andrews University Observatory between 1985 and 1989. These resulted in 3 over 100 spectra at 4200Â and over 50 spectra at 6563Â (INT and JK T observations), 3 over 300 infrared photometric observations (UKIRT), and over 3500 visual photometric
observations (TPT).
Of the five systems analysed in detail in this work, TYBoo appears to be a nor mal shallow-contact W-type system.
contact state for the first time, but the position of VW Boo is uncertain, and whilst evidence that it could be in the “broken contact” state predicted by the TRO Theory is far from conclusive, its lower orbital angular momentum clearly marks the system as worthy of further study.
C ontents
1 Introduction 19
1.1 Introduction... 19
1.2 The RS Canum Venaticorum System s... 21
1.3 The W UM a Contact B inaries... 24
1.3.1 The A /W sub-division... 25
1.3.2 The “B-Type” , Poor Thermal Contact, W UM a B inaries... 26
1.4 The Structure of Contact B in a r ie s ... 31
1.4.1 Introduction ... 31
1.4.2 O b serv atio n s... 32
1.4.3 The Contact Discontinuity T h e o ry ... 33
1.4.4 The Thermal Relaxation Oscillation T h eo ry ... 33
1.4.5 Angular Momentum L o s s ... 36
1.5 Project O u tlin e ... 37
1.5.1 Introduction ... 37
1
1.5.2 Project O b jectiv es... 38
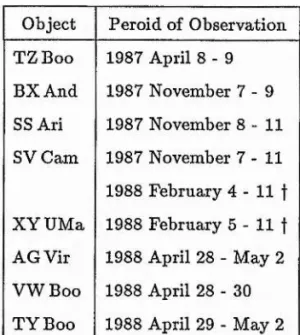
1.5.3 The Observational P ro g ra m m e ... 39
1.6 References... ■... 44
2 Observations, R eduction and A nalysis 48 2.1 S p ectro sco p y... 48
2.1.1 Introduction ... 48
2.1.2 O b serv atio n s... 49
2.1.3 R eduction... 52
2.1.4 A nalysis... 54
2.2 Optical P h o to m e try ... 65
2.2.1 Introduction ... 65
2.2.2 The Twin Photometric Telescope and D ata R ed u ctio n ... 65
2.2.3 BX And - Observations and A nalysis... 69
2.2.4 AGVir - Observations and A n a ly s is ... 70
2.3 Infra-Red P h o to m e try ... 71
2.3.1 Introduction ... 71
2.3.2 Observations . ... 71
2.3.3 Reduction and A n a ly sis... 72
2.5 Appendix - Light Curve Analysis P ro g ra m s... 77
3 The Binary System T Y B o o tis 79 3.1 Introduction... 79
3.2 S p ectro sco p y ... 81
3.3 E phem eris... 84
3.4 Photometric A nalysis... 88
3.5 D iscussion... 92
3.6 References... 95
4 The Binary System V W B o o tis 97 4.1 Introduction... 97
4.2 S pectro sco p y ... 98
4.3 E phem eris... 102
4.4 Photometric A nalysis...106
4.4.1 Modelling a Hot S p o t ... 108
4.5 D iscussion... 113
4.6 References... 116
5 The Binary System B X A ndrom edae 118 5.1 Introduction...118
5.3 E phem eris...123
5.4 Photometric A nalysis...132
5.4.1 Optical O bservations... 132
5.4.2 Infrared O b serv atio n s...133
5.4.3 Colour Indices ... 133
5.4.4 Light curve a n a ly s is ... 134
5.5 D iscussion...146
5.6 References...149
5.7 Appendix - New Photoelectric D a t a ... 152
6 The Binary System SS A rietis 174 6.1 Introduction... 174
6.2 S p ectro sco p y ...176
6.3 E phem eris... 179
6.4 Photometric A nalysis...187
6.4.1 Optical D a t a ... 187
6.4.2 Infrared O b se rv atio n s... 187
6.4.3 Spectral T y p e ...188
6.4.4 Light Curve A nalysis...188
6.5 D iscussion...202
6.6 References...204
6.7 Appendix - New Photoelectric D a t a ... 208
7 The Binary System A G V irginis 211 7.1 Introduction...211
7.2 S p ectroscopy ... 213
7.3 Ephem eris...217
7.4 Photometric A nalysis... 224
7.4.1 Optical Observations...224
7.4.2 Spectral T y p e ...224
7.4.3 Light Curve A nalysis...225
7.4.4 Modelling a Hot S p o t ...231
7.5 D iscussion...233
7.6 References...236
7.7 Appendix - New Photoelectric D a t a ... 239
8 Other Spectroscopic O bservations 244 8.1 Introduction...244
8.2 The W UMa-type Binary System TZ B o o tis ... 245
8.3 The RS CVn-type Binary System XYUrsae M a jo r is ...248
.At*:-8.4 The RS CVn-type Binary System SV C am elopardalis...251
8.5 H-a Line Profiles with Orbital Phase for 7 Binary Systems...255
8.6 References...263
9 Conclusions 265 9.1 S u m m a ry ...265
9.2 Spot M odels...267
9.3 Evolutionary S t a t u s ... 269
9.4 Concluding R em ark s... 276
9.5 References . ... 278
I
—:--...---List o f Tables
1.1 Comparison of A and W -type W UM a Binaries. (Rncinski 1973)... 27
2.1 Dates of Spectroscopic O b serv atio n s... 49
2.2 Typical Integration Times for Spectroscopic O b serv atio n s... 50
2.3 Radial Velocity Standard Stars Observed ... 51
2.4 Radial Velocity Standards used for Cross-Correlation with Binaries . . . 60
2.5 Mean Residuals and Standard Deviations from Cross-Correlation of Stan dard Star observed with each Binary S y s te m ... 64
2.6 Definition of D ata Acquisition Modes used for TPT Observations . . . . 67
3.1 Radial Velocity data for T Y B o o ... 81
3.2 Orbital Elements for T Y B o o ... 83
3.3 Times of minima for TY Boo... 85
3.4 Light Curve Solution for TYBoo (with standard errors)... 90
3.5 Light Curve Solution for TYBoo (with standard errors), allowing the secondary albedo to go free... 91
3.6 Astrophysical D ata for TY Boo... 92
4.1 Radial Velocity data for V W B o o ... 98
4.2 Determinations of Mass Ratio for V W B oo ... 99
4.3 Orbital Elements for VW B o o ... 101
4.4 Times of minima for VW Boo...103
4.5 “Standard” Light Curve Solution for VW Boo (with standard errors). . 108
4.6 Light Curve Solution for VW Boo (with standard errors), allowing the secondary albedo to be a free param eter...110
4.7 “Hot Spot” Light Curve Solution for VWBoo (with standard errors). . I l l 4.8 Astrophysical Data for VW Boo... 115
5.1 Radial Velocity data for BX A n d ...120
5.2 Orbital Elements for BX A n d ... 121
5.3 Times of minima for BX And...125
5.4 WHMA5 solutions for BX And...136
5.5 LIGHT2 solutions for BX And...136
5.6 LIGHT2 spot solutions for BX And...138
5.7 Adopted light curve solution for BX And...146
5.8 Astrophysical data for BX And...148
5.9 1985 TPT V observations... 153
5.10 1986 TPT Vobservations... 156
5.12 1987 UKIRT J observations... 172
5.13 1987 UKIRT K observations... 173
6.1 Radial Velocity data for S S A r i ... 176
6.2 Orbital Elements for SS A r i ...178
6.3 Times of minima for SS Ari...180
6.4 Solution for each half of the Flight curve of SS Ari (with standard errors).189 6.5 Solution for each half of the J light curve of SS Ari (with standard errors). 190 6.6 Solution for each half of the K light curve of SS Ari (with standard errors). 190 6.7 System and spot parameters used to generate the “best fits” to the visual (1983) and infrared (1987) light curves of SS Ari... 196
6.8 Astrophysical Data for SS Ari...203
6.9 1987 UKIRT J observations...209
6.10 1987 UKIRT K observations... 210
7.1 Radial velocity data for AGVir... 213
7.2 Orbital elements for AGVir...214
7.3 Times of minima for AG Vir... 219
7.4 LIGHT2 solutions for first half of AG Vir light curve... 226
7.5 LIGHT2 solutions for second half of AGVir light curve...230
7.7 T PT V observations... 240
8.1 Radial Velocity data for the Primary Component of XY UMa. . . . 249
8.2 Radial Velocity data for the Prim ary Component of SV Cam...253
8.3 Summary of ephemerides used to phase the 6563Â data (no errors quoted - see appropriate preceeding Section)... 255
9.1 New mass, radii and luminosity data for 8 contact binaries, updating the compilation of Hilditch et al. (1988)... 269
■A
■■é •
I
I
I
10
I
List o f Figures
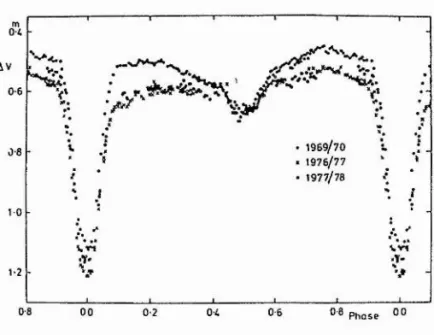
1.1 The light curve of SV Cam at different epochs. (Hilditch et al. 1979). . . 21
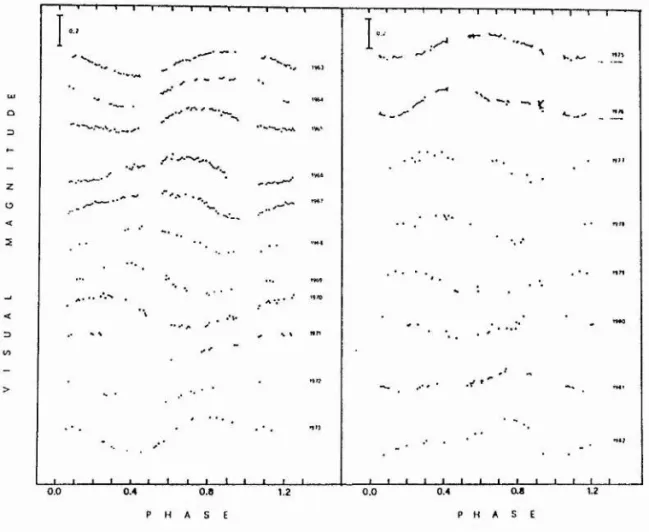
1.2 The outside-of-eclipse V light curve of RS CVn from 1962 to 1982, show ing the migration of a “Photometric Wave”. (Blanco et al. 1983)... 22
1.3 The Common Convective Envelope model for W UM a Binaries. Hatched areas donate convection zones. The vertical dashed line is the axis of rotation. (Lucy 1968b)... 24
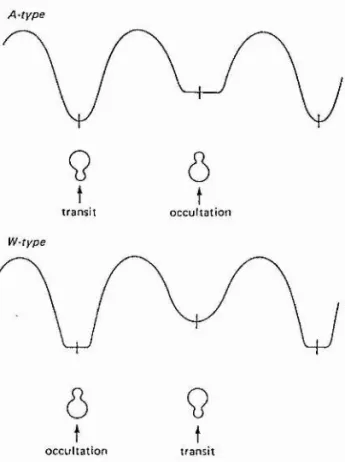
1.4 The W UM a Binaries are divided into A and W-types, dependent upon which component is eclipsed during primary or secondary minimum. (Rucinski 1985)... 25
1.5 The F-light curve of the B-type binary, RV Crv, showing an apparent region of “excess” luminosity around first quadrature (McFaiiane et al.
1986)... 28
1.6 V and B light curves of WZ Cep (top). Crosses denote observations, the solid curves are theoretical fits. The phase region of observed ex cess luminosity suggests the location of a Hot Spot on the component configuration (bottom). (Kaluzny 1986a)... 30
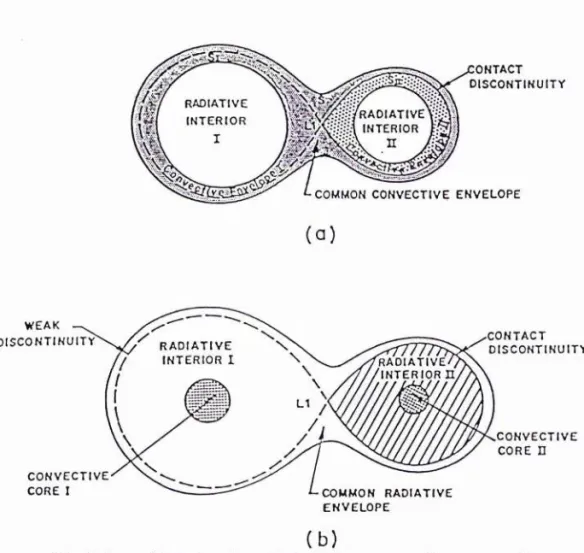
1.7 The Contact Discontinuity Model for the two possible cases : (a) Com mon Convective Envelope, and (b) Common Radiative Envelope. (Shu
et al. 1976)... 34
1.8 Lucy’s Thermal Relaxation Oscillation model for a low-mass Contact Binaries. (Rucinski 1985)... 35
1.9 The changing H-a emission line profile of II Peg, as a “spot” region comes into and out of view. (Vogt 1981a)... 41
1.10 How a darkspot on a rotating star will produce an emission bump in the absorption line profiles as it moves through the line of sight. (Vogt & Penrod 1983b)... 42
1.11 Doppler Imaging used to map spots on the primary component of the RS CVn Binary, V711 Tau. (Vogt & Penrod 1983b)... 43
2.1 Cu-Ar Comparison Spectrum at 4200
A.
The identified lines were used for automatic measuring by REDUCE... 552.2 Cu-Ar Comparison Spectrum at 6563
A.
The identified lines were used for automatic measuring by REDUCE... 562.3 A typical 4200A stellar spectrum. (A W-file of BX And)... 57 %
2.4 A typical 6563
A
stellar spectrum. (A W-fileof
BX And)... 582.5 A single peaked CCF showing only the Primary component. (SS Ari at 0?49 cross-correlated with HD693)... 61
2.6 A double peaked CCF showing Primary and Secondary components. (SS Ari at 0?26 cross-correlated with HD693)... 62
2.7 Observations of TT Aurigae illustrating the TPT principle... 66
3.1 Radial Velocities of the Primary and Secondary Components of TYBoo (closed and open circles respectively), plotted together with their Orbital Solutions... 82
3.2 The Period behaviour of TYBoo over the last 35 years. (Open Circles represent visual times of minima; Open Stars represent photographic minima; and Filled Circles represent photoelectric minima). The fit shown to the photoelectric data indicates the current stable nature of the system... 87
3.3 1986 jB-filter light curve of TYBoo (Samec & Bookmyer 1987), with light curve solution (solid line), and corresponding 0 -C ’s (lower plot)... 89
3.4 A schematic diagram of TYBoo at 0^18, based on this analysis... 93
4.1 Radial Velocities of the Primary and Secondary Components of VW Boo (closed and open circles respectively), plotted together with their Orbital Solutions...100
4.2 The Period behaviour of VWBoo. The large Circle with Dot is an esti mated value of 0-C obtained from the author’s spectroscopic data. The first line indicates possible past stability, whilst the second line indicates that the period could now be increasing... 104
4.3 1986 B-filter light curve of VWBoo (Binnendijk 1973), with “standard” light curve solution (solid line), and corresponding 0 -C ’s (lower plot). . 107
4.4 1986 -filter light curve of VW Boo (Binnendijk 1973), with light curve solution allowing the secondary albedo to be a free parameter (solid line), and corresponding 0-C ’s (lower plot)...109
4.5 1986 5-filter light curve of VW Boo (Binnendijk 1973), with “hot spot” light curve solution (solid line), and corresponding O-C’s (lower plot). . 112
4.6 A schematic diagram of VW Boo at 0?35, based on this analysis, showing the proposed hot spot on the neck of the secondary component...114
13
5.1 Radial Velocities of the Primary and Secondary Components of BX And (closed and open circles respectively), plotted together with their Orbital Solutions...122
5.2 Recent observed minus calculated times of minima for BX And, based on the period determined from 24 new photoelectric times of minima denoted by f in Table 5.3. Cycle numbers are based on the ephemeris computed by Chou (1959)... 124
5.3 Period behaviour of BX And based on the ephemeris computed by Chou (1959), using all the available times of minima. The dotted line is a sine wave with a period of 78yr and amplitude 0.015 day. ...130
j
5.4 Period behaviour of DX And based on the ephemeris computed by Chou (1959), using only photoelectric data. The quadratic function fitted implies a mass transfer of some —4.3x10“® M© yr~^... 131
5.5 1985 T PT F lig h t curve of BX And. The three lines represent differ ent types of contact solutions of these data. The lower plot shows the residuals of the these observations from the spot solution... 139
5.6 1986 T PT F lig h t curve of BX And. The three lines represent differ ent types of contact solutions of these data. The lower plot shows the residuals of the these observations from the spot solution... 140
5.7 1988 TPT F lig h t curve of BX And. The three lines represent differ ent types of contact solutions of these data. The lower plot shows the residuals of the these observations from the spot solution... 141
5.8 1987 UKIRT .7 light curve of BX And. The iliree lines represent differ ent types of contact solutions of these data. The lower plot shows the residuals of the these observations from the spot solution... 142
14
f
I
i
aT-;
5.9 1987 UKIRT K light curve of BX And. The three lines represent differ ent types of contact solutions of these data. The lower plot shows the residuals of the these observations from the spot solution... 143
5.10 The F lig h t curve of Samec et aZ.(1989) of BXAnd. The three lines represent different types of contact solutions of these data. The lower plot shows the residuals of the these observations from the spot solution. 144
5.11 The F lig h t curve of Rovithis & Rovithis-Livaniou(1984) of BXAnd. The three lines represent different types of contact solutions of these data. The lower plot shows the residuals of the these observations from the spot solution... 145
5.12 A schematic diagram of BXAnd at 0?38 based on this analysis... 147
6.1 Radial Velocities of the Primary and Secondary Components of SS Ari (closed and open circles respectively), plotted together with their Orbital Solutions, and corresponding 0-Cs (lower plot)... 177
6.2 The Period behaviour of SS Ari. (Open Circles represent visual times of minima; Open Crosses represent photographic minima; and Filled Circles represent photoelectric minima)... 184
6.3 The sinusoidal period behaviour of SS Ari. The fit shown is a sine wave with a period of 43yr and amplitude of 0.036 day... 186
6.4 F observations of SS Ari (Kaluzny & Pojmahski (1984a)), with LIGHT2 solutions for each half of the light curve. The lower plot shows the residuals of the data from each half of the light curve and its respective
solution... 191
6.5 J observations of SS Ari with LIGHT2 solutions for each half of the light curve. The lower plot shows the residuals of the data from each half of the light curve and its respective solution...192
15
"1
■I■'■I
6.6 K observations of SS Ari with LIGHT2 solutions for each half of the light curve. The lower plot shows the residuals of the data from each half of the light curve and its respective solution... 193
6.7 The generated “best At" to the V observations of SS Ari, with the cor responding 0 -C ’s shown in the lower plot, using the system and spot parameters given in Table 6.7... 197
6.8 The generated “best fit” to the J observations of SS Ari, with the cor responding 0 -C ’s shown in the lower plot, using the system and spot parameters given in Table 6.7... 198
6.9 The generated “best fit” to the K observations of SS Ari, with the cor responding 0-C ’s shown in the lower plot, using the system and spot parameters given in Table 6.7... 199
6.10 A schematic diagram of SS Ari at 0^33, based on the generated ’’best
fit” to the visual data obtained in 1983... 200 i|
6.11 A schematic diagram of SS Ari at 0?25, based on the generated ’’best fit” to the infrared data obtained in 1987... 201
7.1 Radial velocities of the Primary and Secondary components of AGVir (closed and open circles respectively), plotted together with their orbital solutions, and corresponding O-Cs (lower plot)...215
7.2 Observed minus calculated times of minima in fractions of a day based on the period determined from 31 photoelectric times of primary minima since 1950. Cycle numbers are based on the ephemeris computed by Binnendijk (1969)... 222
7.3 Observed minus calculated times of minima in fractions of a day based on the ephemeris computed in Section 7.3 using published data and those minima obtained for this study...223
7.4 TPT V observations of AGVir with two convective contact solutions for each half of the light curve... 227
7.5 TPT V observations of AGVir and two radiative contact solutions for each half of the light curve... 228
7.6 TPT V observations of AGVir with two detached solutions for each half of the light curve... 229
7.7 Generated “best fit” with hot spot to the TPT V observations of AGVir with corresponding residuals shown in lower plot... 232
7.8 Schematic diagram at 0?67 of the basic system geometry of AG Vir, with no spots shown... 234
8.1 B light curves of TZBoo (Hoffmann 1978b). Open circles represent nor mal points of 1970 observations, and dots represent 1978 observations. . 246
8.2 Cross-correlation functions for 4200 Â spectra of TZ Boo in order of in creasing orbital phase...247
8.3 Radial Velocities for the Primary Component of XYUMa, plotted with the orbital solution, and corresponding 0-Cs (lower plot)... 250
8.4 Radial Velocities for the Primary Component of SV Cam, plotted with the orbital solution, and corresponding 0-Cs (lower plot)... 254
8.5 6563 Â spectra of TYBoo showing the H-alpha line profile against in creasing orbital phase...256
8.6 6563 Â spectra of VW Boo showing the H-alpha line profile against in creasing orbital phase...257
8.7 6563 Â spectra of BX And showing the H-alpha line profile against in creasing orbital phase...258
8.8 6563 Â spectra of SS Ari showing the H-alpha line profile against increas
ing orbital phase 259
8.9 6563Â spectra of AGVir showing the H-alpha line profile against in creasing orbital phase...260
8.10 6563Â spectra of TZBoo showing the H-alpha line profile against in creasing orbital phase...261
8.11 6563 Â spectra of SV Cam showing the H-alpha line profile against in creasing orbital phase...262
9.1 Location of primary and secondary components of 38 well observed contact/ near-contact binary stars in the mass-radius plane. Also shown are the ZAMS and TAMS lines from VandenBerg (1985), and error bars typical for the sample... 271
9.2 Location of primary and secondary components of 38 well observed contact/ near-contact binary stars in the mass-lnminosity plane. Also shown are the ZAMS and TAMS lines from VandenBerg (1985), and er ror bars typical for the sample...272
9.3 Location of primary and secondary components of 38 well observed contact/near-contact binary stars in the H-R diagram. Also shown are the ZAMS and TAMS lines from VandenBerg (1985), and error bars typ ical for the sample... 273
9.4 Relative orbital angular momenta of 38 well observed contact/ near-contact binary stars. The dashed lines indicate the dependence of the ordinate on mass ratio at constant orbital period... 274
i
C hapter 1
In trod u ction
1.1 In tro d u ctio n
In recent years there has been much debate concerning both the evolution, and structural form, of close/contact binary star systems. Observational studies have in vestigated possible anomalous surface luminosity distributions, in the form of dark starspots, on both binary systems and single rotating stars. Surveys of binary param eters have looked for evidence of systems in the different evolutionary states predicted by theory.
The close, but detached, RS Canum Venaticorum(RS CVn) binaries exhibit er ratic light curves which are almost certainly due to the presence of large-scale dark spots. The observational and theoretical evidence now seems overwhelming that stellar spots are a direct consequence of deep convection zones and rapid angular velocity (eg. Hall 1976, Mullan 1976a, 1976b, Gershberg 1978, Rodono 1980,1981, Vogt 1983).
Work on starspots has to date however been primarily centered on the single, spotted, BYDra stars, with the development of an analytical technique known as “Doppler Imaging” (Vogt & Penrod 1983a) which allows starspot features to be (at least partially) spatially resolved (see section 1.5.3.2).
1
The contact, W UM a binaries can be split into two sub-categories (Binnendijk 1965,1970). The “A-type” systems have the more massive component covered during primary eclipse, and are found to be generally well over-contact. The “W -type” systems have the less massive component covered during primary eclipse, and are found to be in thin or marginal contact (eg. Lucy 1973).
The A-type systems are believed to be evolved, and essentially in equilibrium, exhibiting stable light curves. The W-type systems are believed to be unevolved, and show several signs of not being in equilibrium, exhibiting erratic light curve changes. The presence of large-scale dark starspots on the primary component has become the generally accepted explanation of W-type phenomenon (winning by default).
Surveys carried out at St. Andrews University Observatory of both early spec tral type contact binaries (Bell 1987), and late spectral type contact binaries (McFar- lane 1986), have provided evidence for two evolutionary paths for the formation of contact binaries (Hilditch 1989).
Recently interest has focused on a possible third grouping of W UMa binaries, % the so called “B-type”. Despite appearing to be well in contact, these systems exhibit
a large temperature difference between components. Such systems are of great interest, since they may represent the evolutionary state of “broken contact” predicted by the TRO theory for the structure of contact binaries (see section 1.4.3). Also, rather than invoking dark starspots to model these systems, it has been proposed that an excess luminosity is required, indicative of the presence of a “hot spot”, possibly due to mass transfer between the components (eg. Kaluzny 1986c, McFarlane 1986).
20
AV 0 6
• 1969/70
« 1976/77
• 1977/78
0-8
0 8 00 0 6
Figure 1.1: The light curve of SV Cam at different epochs. (Hilditch ei al. 1979).
1.2 T h e R S C anum V en aticoru m S ystem s
These close but detached binaries consist typically of a G /K subgiant, and a hotter F /G main-sequence companion. They display a variety of photometric and spectroscopic peculiarities which cannot be explained in terms of simple eclipse geome try, but which are almost certainly due to the presence of large-scale dark spots on the cool component, whose uneven distribution distorts the light-curve. (Figure 1.1).
Such spots have been modelled using a simplified kinematic dynamo (Shore & Hall 1980), and are formed by the eruption of enhanced toroidal fields. Shore & Hall also showed that such phenomenon would be related to both the evolutionary status, and the orbital parameters of the binary system. Although for a long time the evidence for spots was largely indirect, Ramsey & Nations (1980) claimed to provide direct evidence through a spectroscopic investigation of the TiO-band.
It is worth noting that starspot work on BY Dra stars has shown that although there is an analogy between starspots and Sunspots, there is some evidence (Vogt 1983)
21
■-1
I
%
z o 3
0.4 \,2
0.0 0.4 0.0 1.2 0,0
p h a s e P H A S E
Figure 1.2: The outside-of-eclipse V light curve of RS CVii from 1962 to 1982, showing the migration of a “Photometric Wave”. (Blanco et al 1983).
that starspots are actually more analogous to Solar Coronal Holes a.nd Complexes than to Sunspots, as regards to size, shapes, lifetimes, and migratory motions. If true, then starspots are probably more a manifestation of global-scale processes occurring deep within the star than are spots on the Sun. Furthermore, some published spot tem peratures for BYDra stars (Vogt 1981b, Oskanyanei al 1977) have shown decreasing temperatures which become negative (ie. a hot spot) as the cool spot disappears.
One of the outstanding features of many RS CVn-type binaries is the changing shape of the “wave-like distortion” which is superimposed on the eclipsing light-curve, and demonstrates retrograde phase migration. (Blanco ei al 1983). (Figure 1.2).
If overall rotation is assumed to be synchronous, then this migration wave
phe-■I
t à
a
nomenon can be interpreted as demonstrating that the spots must predominate in a surface zone that is rotating faster than the average, ie. the equatorial region. How ever such a conclusion, that certain zones on the star are subject to spots for years or decades, whilst the other hemisphere is essentially free of them, clearly needs explain ing. (Rodono 1981, Rossiger 1982).
The RS CVn systems also display other unusual chromospheric and coronal ac tivity, whose links with sunspot activity in the Sun has long been known. These include flare activity, strong C all emission lines, high (TV-excess, non-thermal radio frequency outbursts, and variable X-ray emission.
Although such systems are not yet actually in the process of tidal mass-transfer, the great majority of them clearly lie near the first phase of mass-transfer.
23
■
Figure 1.3: The Common Convective Envelope model for W UM a Binaries. Hatched areas donate convection zones. The vertical dashed line is the axis of rotation. (Lucy 1968b).
1.3 T h e W U M a C o n ta ct B inaries
These contact binaries traditionally have sinusoidal type light-curves, usually
with roughly equal depth minima, periods less than a day, and dwarf spectra A to
K. (A less distinct population of OBA, hot contact systems also exists). They have
mass ratios not equal to unity, and components with similar effective temperatures, ie. over-luminous secondaries. Lucy (1968a,b) first suggested the Common Convective Envelope(CCE) model for these contact systems. (Figure 1.3).
g: III this model both components are surrounded by a CCE, leading to energy |
transfer from the more to less massive component to equalize the common surface
brightness. The nature of this energy transfer is not understood (Robertson 1980), but
almost certainly cannot exist in a state of equilibrium (Lucy 1976, Flannery 1976).
An alternative to this model is to argue that the binary components are simply 4 evolved to some extent. This will almost certainly be the case for some systems, but
various studies suggest that these cases are a minority of all systems. (Kaluzny 1985).
A-type
Ô
W-type
o c cu lta tio n
Ô
o c c u lta tio n transit
Figure 1.4: The W UM a Binaries are divided into A and W-types, dependent upon which component is eclipsed during primary or secondary minimum. (Rucinski 1985).
1.3,1 T h e A /W su b -d iv isio n
It was noticed rather early that contact systems could be divided into two groups
(called A and W-types by Binnedijk (1965, 1970)), depending upon which component
is eclipsed during primary or secondary minimum. (Figure 1.4).
The origin, and reality, of this division is uncertain, but generally the late G-K
spectral types are W systems, whilst A-F types form the A systems. Also, the A-types
tend to have smaller mass-ratios, and are generally hotter and more massive. Studies
show that the A-type systems are well over contact, with their surfaces substantially exceeding their Roche “inner contact surfaces” . These systems are believed to be evolved, and essentially in equilibrium, exhibiting stable light curves. The W-type systems on the other hand are found to be in marginal/thin contact (Lucy 1973), and
25
are believed to be unevolved. They show several signs of not being in equilibrium, with
erratic period and light curve changes. Studies by Rucinski (1973, 1974), suggest that A-type systems have only shallow CCE’s (but with a greater degree of contact), whilst
W-types have deeper CCE’s (with a lesser degree of contact). Table 1.1 compares and fj contrasts the two groups.
Mochnacki (1981) argued that the W -type systems were those containing un evolved components. In this case, the deeper CCE’s in the W-types cause the secon daries to exhibite a larger surface brightness than expected, and the primaries a lower surface brightness. Hilditch et al. (1988) demonstrated empirically that this was in deed the case. Additionally the presence of dark starspots on the primary components, (Mullan 1975, Eaton et al. 1980) has been invoked to help explain the erratic light curve changes seen in these objects.
However, some observations of W-type systems (Kaluzny 1983), seem to be ex plained more adequately by the hypothesis of a temperature excess on the less massive component. Kaluzny also pointed out that for systems with large mass ratios, the assumption that spots are present only on the larger component is rather artificial. If the mass ratio is close to unity, the convective zones of both components would be of
similar depth, so that spots, if they exist at all, should be created on both components. 1
It should also be noted that a few systems actually change their type. The classic example is TZBoo, which has been observed to alternate between A-type and W- type several times during recent years (Rucinski 1985). This behaviour has again been explained in terms of a non-uniform surface brightness distribution over the common envelope, caused by the presence of dark starspots.
1 .3 .2 T h e ‘‘B -T y p e ’% P o o r T h erm a l C o n ta c t, W U M a B in a ries
Recently, a group of near/m arginal contact binaries has received much attention. These are the so called “B-type”systems (Lucy & Wilson 1979), which seem to be in poor thermal contact, and often display asymmetric light curves, and unequal depth minima. (Figure 1.5).
•:
Property A W Remarks .A
1. Spectral type earlier later differences slightly marked Y
2. Luminoelty higher lower differences slightly marked
3. Maaa larger smaller. differences slightly marked ■1
4
,
A ctivity moderate or strong or very !(cUangea of absent strong (almost
light curvea. every system)
aayin metrics
of maxima) ÿ
5. Period either chan always changing Kelvin — Helmholtz time- j
ging or cons scale or slightly slower tant
Q. Kftsa-ratio email larger upper lim it more certain 0 .0 8 -0 .5 4 0 .3 3 -0 .8 8
7. Degree of envelopes shallow envelo :
contact slightly thicker than in W -typo
pes
8. Photometric good poor (less
conformity to massive comp. '
the contact hotter)
model
9; Energy adiabatic supcradiabatic À
exchange parts of the parts of the conv. takes place in conv. en ve
lope envelope
i
10. Peculiar not too m any; m any; SW Lao, syatoma syatoma of g — 0.88; AB
very sm all g, And and ER Ori, .1
early-typo deviation from
contact sya- the mass-luminc- "1
toma sity relation; many other with changing light curves
i
Table 1.1: Comparison of A and W-type W UM a Binaries. (Rucinski 1973).
00
-0. 95
%
-0. 90 ü
> -0. 65
ü) -0. 80
]
c
g"
-0. 75
eI
> -0. 65
-0. 60
c
0) L
0)
-0. 50
Q
-0. AS
-0 .4 0
0.00 0. 25 0 .5 0 0. 75 1.00
Phase
Figure 1.5: Tlie F-light curve of the B-type binary, RV Crv, showing an apparent region of “excess” luminosity around first quadrature (McFarlane et al. 1986).
(The filled circles denote the observations, the solid cnrv(' is a theoretical fit using a convective atmosphere, and the dashed curve a radiative fit).
28
1
"ïl.i.-i.l-r-XI
These systems are found to be in a state of marginal, but poor thermal contact (the differences in the depth of minima indicative of a large temperature difference between components). They are interesting in view of the predictions of the “Ther mal Relaxation Oscillation (TRO) Theory” (Section 1.4.3). According to this theory, the unevolved W UM a systems undergo oscillations about a state of marginal contact.
Thus, such systems should spend some time interval in a semi-detached/broken config- . with the more massive component filling its Roche lobe. In this phase when vXl thermal contact between components is weak, or does not exist, such systems would be
expected to exhibit EB-type light curves. Hence, such objects are good candidates for W UMa systems in this broken contact phase.
Unlike the RS CVn and W -type W UM a systems, there is less evidence on these objects of the erratic light curve changes attributed to dark spot activity. However, it has been found, when modelling these asymmetric light curves, that good fits cannot be obtained, due to an apparent region of “excess” luminosity.
Naqvi & Gronbech(l976) first proposed the hot spot hypothesis to explain these asymmetries, and recently analysis of such systems (eg. Hilditch et al. 1984, Hilditch &
King 1986,1988, Kaluzny 1983,1986a,b,c & McFarlane et a/. 1986) have made similar b conclusions. These found that the light curves could only be fitted when the albedo
of the secondary component was treated as a free parameter. The solutions gave an albedo greater than unity, which was interpreted as an abnormally hot region on the neck of the secondary, presuniably due to mass transfer. (Figure 1.6).
McFarlane et al. (1986) pointed out however that an abnormally cool region on the averted hemisphere would have the same effect as a hot region on the facing side. But in the analysis of the binary system RV Crv, McFarlane ei al. (1986) did find possible evidence for a hot spot in spectroscopic data, where observations around 0^25 showed no indication of an additional peak in the cross-correlation function, due to the secondary, whilst data around 0^75 showed this expected peak, suggesting that light from a hot spot in view at 0?25 could be shrouding the contribution from the secondary.
PHASE
0 4 5 0 .2 5 0.10
0.0
0.90 0.75
ï
Figure 1.6: V and B light curves of WZ Cep (top). Crosses denote observations, the solid curves are theoretical fits. The phase region of observed excess luminosity suggests the location of a Hot Spot on the component configuration (bottom). (Kaluzny 1986a).
30
1.4 T h e S tru ctu re o f C o n ta ct B inaries
1.4.1 In tr o d u c tio n
Although the internal structure of contact binaries has been the subject of intense
debate over the last 20 years, no satisfactory theoretical model has yet to emerge which explains all the observed properties of the W UM a binaries.
There have been many reviews of the observational and theoretical work in the subject, those recently by Shu (1980), Smith (1984), Rucinski (1986), and Hilditch, King
Sz McFarlane (1988) providing comprehensive coverage across the field.
It is clear that some contact systems (predominantly the A-types) are evolved, and it is possible to obtain stable contact binaries using models with differently evolved cores.
But some systems (predominantly the W-types) clearly contain unevolved main sequence components. Two different approaches have been taken to model such sys tems. The Contact Discontinuity (DSC) Theory sought to build an equilibrium model using zero-age main sequence stars of unequal entropy. The Thermal Relaxation Os cillation (TRO) Theory took the approach that the systems were not in equilibrium, but evolving on a thermal time-scale. There is both observational and theoretical ev idence that zero-age contact systems could be essentially an evolving, time-dependent phenomenon. However, both theories assume the conservation of angular momentum.
It now seems certain that angular momentum loss (through magnetic braking) plays a crucial role in binary systems, not just in modifying the structural models, but in the entire evolutionary scenario.
Observations have suggested th at two paths for evolution into contact are possi ble, via mass-reversal evolution, or via angular momentum loss. Angular momentum loss may also finally merge contact systems into single, rapidly-rotating stars (possibly FK Comae stars).
31
1.4.2 Observations
Observations of WTJma systems have provided useful constraints and tests for the theoretical models of contact binaries.
Contact systems seem to prefer small mass-ratios, avoiding q = l, thus at least
for the unevolved systems, leading to the inevitable conclusion that there must be
energy transport between components through the optically thick “neck”. The energy
transport mechanism is still largely unsolved, but is undoubtably very complex. Some
simplified models have been constructed (eg. Hazlehurst & Myer-Hofmeister 1973), but the full hydrodynamical problem involves sonic flow in a complicated geometry, with coriolis forces, convection, turbulence and shocks.
Hilditch et al. (1988) compiled the masses, radii and luminosities for 31 well stud ied F-K contact, or near-contact binaries (ie. ones with spectroscopic mass ratios), and made several important conclusions.
As had been previously suspected, the primary components of the W-type sys- | tems were found to be generally unevolved main sequence stars, whilst the primary % components of the A-type systems were generally near to the terminal-age main se
quence. The secondary components of the A-type systems were also generally more over-sized than their W-type counterparts, indicative of the deeper-contact of the A- type systems. The magnitude of the luminosity transfer between components of the W-types systems was found to be in good agreement with that predicted by theory.
Two paths for evolution into contact were suggested ; (a) due to angular momen tum loss from detached systems, via marginal-contact systems to the shallow-contact W-type systems, and (b) due to stellar evolution from detached systems, via case- A mass transfer to semi-detached systems and then marginal-contact systems, to the deeper-contact A-type systems.
The lack of observed B-type systems indicative of the broken-contact phase of the TRO theory has also been a problem. They only seem to appear at periods greater than about 0.4 day, and although some are certainly in genuine contact, they seem to exhibit strange surface-brightness distributions indicating the presence of bright spots in the neck area connecting the two components. It is interesting to note that a similar bright
spot has been observed on the early-type binary system SV Cen (Drechsel et al. 1982). However, the three well-studied B-systems in the compilation of Hilditch et al. (1988) showed values of angular momentum and other properties which indicated that these systems could only be reaching contact for the first time, rather than being in a later cyclic phase.
1 .4 .3 T h e C o n ta ct D isc o n tin u ity T h e o r y
The Contact Discontinuity (DSC) Model was proposed by Shu, Lubow, &; An- | derson (1976) who put an equal entropy common envelope on top of the unequal en
tropy, zero-age binary models of Bierman & Thomas (1972, 1973). This model satisfied observed light curve constraints, but required the maintenance of a temperature dis- continuity between the common envelope and the secondary component.
Shu et al. (1980) argued that a temperature inversion layer could be maintained i by dynamical energy transfer for both possible contact cases (Figure 1.7). However, ■'%
Smith, Robertson & Smith (1980) showed that the DSC theory contained several se rious and fatal inconsistencies, and there is general sceptism about whether a true equilibrium can be maintained in this way.
However, the DSC models may correctly describe contact binaries at particular stages of their thermal evolution, such as immediately after establishing contact in the TRO models.
1 .4 .4 T h e T h erm a l R e la x a tio n O scilla tio n T h e o r y
Rucinski (1973) proposed that observed instabilities in W -type light curves im
plied that these systems were not in thermal equilibrium. On this basis, the Thermal | Relaxation Oscillation (TRO) Model was proposed by Lucy (1976) and Flannery (1976).
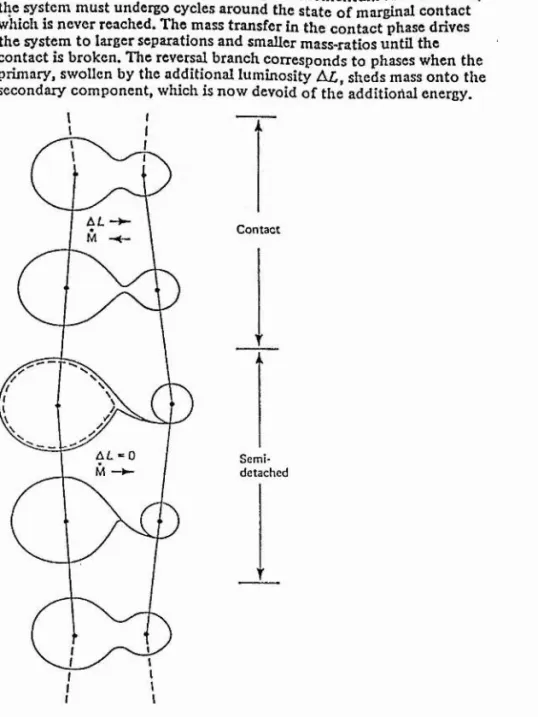
This extended the original models of Lucy (1968a,b), allowing m atter as well as energy to be exchanged between components. When the total mass and angular momentum are preserved, these models are found to undergo relaxation-type oscillations with al ternate long-lasting contact phases and relatively short semi-detached phases (Figure 1.8).
1
33 ]
I
RADI AT I VE
I N T E R I O R R A D I A T I V E I N T E R I O R
O N T A C T D IS C O N T I N U I T Y
CO MMO N C O N V E C T I V E E N V E L O P E
(a)
W E A K — ^
D I S C O N T I N U I T Y • C O N T A C T
D I S C O N T I N U I T Y R A D I A T I V E
I N T E R I O R I R A D I A T I V E / y
' I N T E R I O R n
L I
. C O N V E C T I V E C O R E n
C O N V E C T I V E
C O R E I C O M M O N R A D I A T I V E
E N V E L O P E
(b)
SchemKic diagram o f I he Xruclure o f conlact binaries, (o) A low-mass contact binary at zero age * ilh a common convective envelope. The specific entropy Ju beneath the R oche lobe o f star II is less than the specific entropy a, beneath the Roche lobe of star 1. For dynamical stability, the specific entropy a in the com m on envelope equals a,. (4) A high-mass conlact binary at zero age with a cornmon radiative envelope. The tem perature 7n imm ediately beneath the Roche lobe of star II is less than the tem perature Ti immediately beneath the Roche lobe of star 1. F o r dynamicaJ stability, the tem perature immediately above the inner critical surface equals 7i.
Figure 1.7: The Contact Discontinuity Model for the two possible cases : (a) Common Convective Envelope, and (b) Common Radiative Envelope. (Shu et al. 1976).
When the total mass and angular momentum arc conserved, the system must undergo cycles around the state of marginal contact which is never reached. The mass transfer in the contact phase drives the system to larger separations and smaller mass-ratios until the contact is broken. The reversal branch corresponds to phases when the primary, swollen by the additional luminosity AL, sheds mass onto the secondary component, which is now devoid of the additional energy.
àL ~>- Contact
S e m i d e t a c h e d
Figure 1.8: Lucy’s Thermal Relaxation Oscillation model for a low-mass Contact Bi naries. (Rucinski 1985).
The main problem with the TRO model has been the lack of observed systems in the semi-detached phase, ie. with B-type light curves, and periods less than 0.4 days. Although some candidates have boon discovered, it is doubtful if they aro r'^nlly broken- contact examples of the TRO model, being equally well explained as either peculiar, evolved systems, not in broken-contact (Mochnacki 1981), or systems which are just evolving into a contact state for the first time (Hilditch et al. 1988).
1.4.5 Angular M om entum Loss
The Angular Momentum Loss (AML) Model (Mochnacki 1981 and Rahunen & Vilhu 1982) was proposed as a mechanism for keeping binary components in permanent
contact, thus explaining the non-existence of semi-detached states predicted by the
TRO theory. Angular momentum loss is used to hold the system in the contact phase of the TRO model, so that the semi-detached phase never (or very rarely) appears. Hence the system moves to smaller and smaller mass-ratios along contact branches of
the TRO cycles.
The TRO and AML models have explained many observed features ; the prefer ence for marginal contact, evolution towards smaller mass ratios, and the shape of the period-colour diagram. Rahunen (1981) followed the evolution of a binary system, arti ficially setting the AML rate to exactly the value needed to maintain marginal contact, and found a good fit with observation.
The main question mark over AML is the need for a self-regulating mechanism
to ensure the loss rate is just sufficient to keep the system in contact. Too little and
the system undergoes TRO-like oscillations. Too much and the components rapidly coalesce. Vilhu (1981) speculated th at increasing contact would result in increased mixing in the common envelope, burying the surface magnetic field and decreasing the loss rate, thus providing the self-regulating mechanism. Rucinski (1986) also suggested
that the amount of breaking in W UMa systems may be lower than that for similar non-
contact stars, since the stellar cores under the CCE may be up to half a sub-type earlier
than suggested by the envelope, thus having weeker deeply-rooted magnetic structures
than might otherwise be expected.
1.5 P ro ject O u tlin e
1 .5 .1 In tr o d u c tio n
The development of theoretical models describing the evolution and structure of W UMa Binary systems has been impeded by a shortage of detailed information relating
to short-period binaries.
The TRO theory in particular, has suffered from an apparent lack of observed systems whose components are either in a state of broken contact, or are in marginal
contact, but possess widely differing temperatures.
Explanations of light-curve features in terms of anomalous surface luminosity
distributions present a far from coherent picture of all the observed phenomena. Crucially, the analysis of “spot” activity from light curve distortions is usually hampered by two problems
(a) In modelling spot activity to observed light curves, the lack of unique solutions is a severe problem, there being a fundamental relation between spot size and temperature.
(b) Interpretations of light curves are often made from theoretical fits where
the mass ratio is treated as a free parameter. Yet it is well known that solution surface space exhibits a very shallow minimum with respect to the mass ratio parameter for systems exhibiting partial eclipses. Thus, model light curve fits cannot usually be certain without a spectroscopically defined mass ratio.
Furthermore, is it observationally possible to distinguish between an abnormally cool region on one hemisphere, as opposed to an abnormally hot region on the other hemisphere ?
1 .5 .2 P r o je c t O b je c tiv e s
Recent work at St. Andrews University Observatory surveyed a sample of early
and late-type contact binaries, obtaining detailed photometric and spectroscopic infor mation, in order to determine accurately the physical parameters for a representative sample of systems across the contact binary field.
Given the problems outlined in Section 1.5.1, and the emergence of B-type sys tems (which may be in the crucial state of “broken contact” predicted by the TRO theory, as well as possibly exhibiting anomalous surface luminosity distributions), it was decided to move forward from the survey data to look more closely at the na ture of the possible spot activity, particularly on B-type systems (given their possible evolutionary significance).
Initially, eight systems were selected for study, representing the range of typically observed phenomena.
SV Cam and XYUMa are short period RS CVn-type semi-detached systems whose light curves display the typical erratic variations attributed to dark spot activity.
BX And, SS Ari and AGVir all exhibit B-type light curves, with unequal depths of minima. AGVir had previously been studied by Kaluzny (1986c), who modelled the presence of a hot spot from light curve analysis.
TYBoo and VWBoo both exhibit light curves much more typical of the W UMa binaries, and neither system had previously been studied in great detail.
Finally the unusual system TZ Boo was also included, since it had been observed actually to change its type in recent years (Section 1.3.1).
All of these systems had had at least one photoelectric light curve published pre viously, but with the exception of TZBoo, no spectroscopic mass ratios were available. Thus observations were planned to obtain spectroscopy, and where possible new pho tometry, in order to determine the physical parameters of each system; and then use this information to analyse H-a line profiles, and long wavelength-based colour obser vations (verses orbital phase) in an attem pt to reveal the true nature of the surface luminosity distribution. (Section 1.5.3).
As the project evolved, the focus shifted away from a representative sample sur
vey, and more towards the B-type systems, their structure and modelling of possible
spot activity.
One reason for this shift was that the spectra obtained for the two RS CVn systems, SV Cam and XYUMa, revealed only the primary component. This lack of spectroscopic mass ratios, and other problems with “spot” related observations (out lined below), curtailed any useful analysis of these systems, and so the spectra obtained for these two systems are only briefly noted in Chapter 8.
Also the two observational techniques used to study the nature of any spot ac tivity both suffered from problems. The H-a observations did not achieve a dispersion or signal to noise ratio great enough to enable the spot analysis hoped for, and so these observations are also only reported briefly in Chapter 8. Simultaneous visual and infra red photometric observations made to produce long wavelength based colours could not be reduced, due to an instrument malfunction (Section 2.3.2), but it was possible to produce infra-red light curves from the data, which may show extra evidence for the nature of spot activity.
Thus presented as the main part of this study, are the detailed analyses of five contact systems (BX And, SS Ari, AGVir, TYBoo, and VW Boo). All appear to be in marginal contact. Four of the systems show signs of not being in equilibrium, and the nature of possible spot activity is considered.
A detailed analysis of TZBoo was not possible due to distortions in the cross correlation functions which are also noted in Chapter 8.
1 .5 .3 T h e O b serv a tio n a l P ro g r a m m e
1.5.3.1 Spectroscopy and P hotom etry
Spectroscopic mass ratios were obtained for the five main systems presented here, and new optical photometry was obtained for two of these systems. The spectroscopic mass ratios allowed detailed analysis of light curves, to determine accurate physical parameters for each of the systems.
39
40
1
1.5.3.2 Doppler Im aging
The H-a line profile was monitored with orbital phase for seven of the target systems, to search for line profile changes due to localised chromospheric emission associated with spot activity.
It was hoped to extend the work done on dark spots on BY Dra stars and some
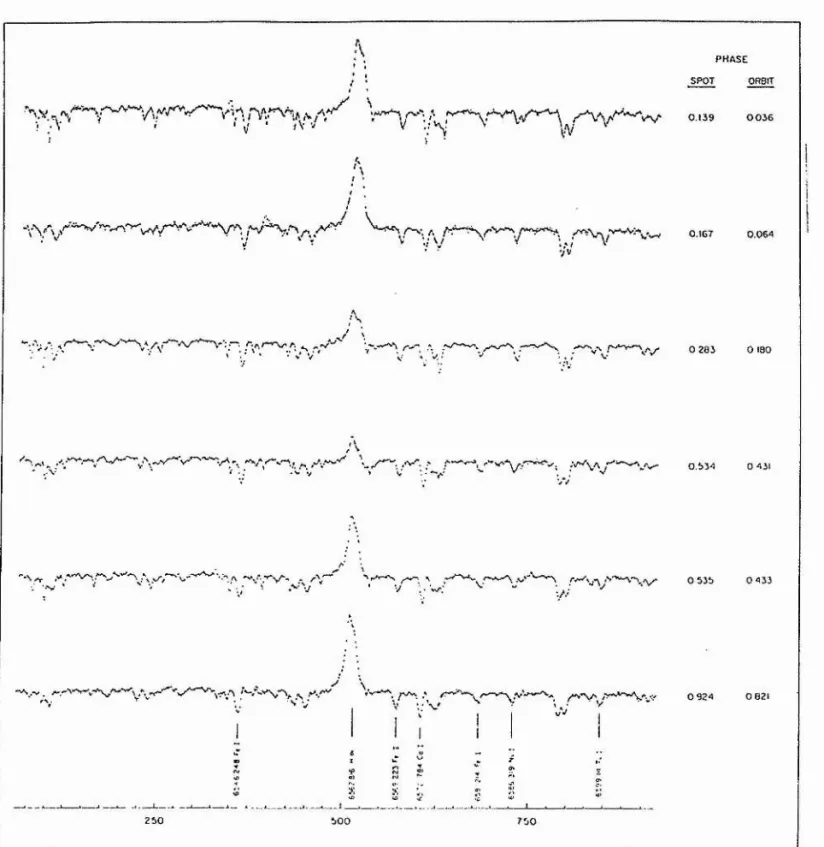
RS CVn systems to the contact binaries. For example. Figure 1.9 shows the correlation between the H-a emission and starspot visibility observed for the single, rotating star II Peg.
Also, Vogt and Penrod ( 1983a,b) exploited these line profile changes, in a tech nique known as Doppler Imaging, to “map” spot activity. They showed how a dark spot would produce an emission bump in the absorption lines of a rotating star (Figure
1.10), and that for stars of intermediate inclinations, some two dimensional information | could be derived. They applied the technique to the RS CVn binary, V T llT au, to map
spot positions on the primary component (Figure 1.11).
The observations made for this study are presented in Chapter 8, but the mag- itude of the proposed spot features, with the resolution and signal to noise obtained, proved insufficient to reveal any “emission bump” features. The work by Vogt on brighter BYDra and RS CVn objects achieved noise to signal of less than 1%, whereas the noise to signal for the observations of these contact systems was typically 4-5%.
1.5.3.3 Long W avelength based Colours
Observations over a wide wavelength base are required to help determine the nature of any anomalous surface luminosity distributions on marginal contact binaries. Observations of colours with orbital phase at both the visual (V-B) and the infra-red (J-K) alone have shown no significant variations, but calculations for colours over a large wavelength base (V-K) have suggested that any contribution due to spots would become noticeable.
PHASE
SPOT ORBIT
; ' V ' ' \1 ’ '•' 0.139 0036
0,167 0.064
0 203 0 100
0 431 VV
'\ /. 0 924 0 821
Ï
Figure 1.9: The changing ff-a emission line profile of II Peg, as a “spot” region comes into and out of view. (Vogt 1981a).
41
I
WITHOUT SPO T WITH SPOT
02
SECTION I
>-H
0 2
CO 02
z LU f
-Z 0 2
02
IZ
02 02
SUM SUM
0 9
0 7
NORMALIZED SUM 0.89
0.76
WAVELENGTH
Figure 1.10: How a darkspot on a rotating star will produce an emission bump in the absorption line profiles as it moves through the line of sight. (Vogt Sz Penrod 1983b).
HR 1 099
Sept-Oei,1981
0 6 4 4
Figure 1.11: Doppler Imaging used to map spots on the primary component of the RS CVn Binary, V T llT au. (Vogt & Penrod 1983b).
An ideal opportunity to obtain simultaneous visual and infra-red photometry arose during this study with the commissioning of a simultaneous visual photometer on the United Kingdom Infrared Telescope.
Unfortunately, an initial fault with this new visual photometer rendered the visual part of our data unuseable (Section 2.3.1), and although our observations made during the commissioning run helped to correct the instrumental fault, the long wavelength based colours hoped for could not be produced.
However, infra-red photometry was obtained for two of the systems presented here, providing valuable long wavelength light curves against which to test the system and spot parameters suggested from the analysis of other visual data.
; . ' - L ■' ' ■ '
1.6 R eferen ces
Bell, S.A., 1987. PhD thesis, University of St. Andrews.
Biermann, P., & Thomas, H.C., 1972. Astr. Astrophys., 16, 60.
Biermann, P., & Thomas, H.C., 1973. Astr. Astrophys., 23, 55.
Binnendijk, L., 1965. Kleini Ver. Bam. 4, 40, 36.
Binnendijk, L., 1970. Vistas Astr., 12, 217.
Blanco, C., Bodo, G., Catalano, S., Cellino, A., Marilli, E., Pazzani, V., Rodono, M., & Sacttriti, P., 1983. lAU Colloquium 71, 387.
Drechsel, H., Rahe, J., Wargau. W., & Wolf. B., 1982. Astr. Astrophys., 110, 246.
Eaton, J.A., Wu, C., & Rucinski, S.M., 1980. Astrophys. J., 239, 919.
Flannery, B.P., 1976 Astrophys. J., 205, 217.
Gershberg, R.E., 1978 Mem. Soc. Astron. Italiana, 49, 781.
HaU, D.S., 1976. lA U Colloquium 29, 287.
Hazlehurst, J., & Myer-Hofmeister, E., 1973. Astr. Astrophys., 24, 379.
Hilditch, R.W., Harland, D.M., & McLean, B.J., 1979. Mon. Not. R. astr. Soc., 187, 797.
Hilditch, R.W., King, D.J., Hill, G., & Poeckert, R., 1984. Mon. Not. R. astr. Soc.,
208, 135.
Hilditch, R.W., & King, D.J., 1986. Mon. Not. R. astr. Soc., 223, 581.
Hilditch, R.W., & King, D.J., 1988. Mon. Not. R. astr. Soc., 231, 397.
44
Hilditch, R.W., King, D.J., & McFarlane, T.M., 1988. Mon. Not. R. astr. Soc., 231, 341.
Hilditch, R.W., 1989. lA U Colloquium 107, 289.
Kaluzny, J., 1983. Acta Astr., 33, 345.
Kaluzny, J., 1985. Acta Astr., 35, 313.
Kaluzny, J., 1986a. Acta Astr., 36, 105.
Kaluzny, J., 1986b, Acta Astr., 36, 113.
Kaluzny, J., 1986c, Acta Astr., 36, 121.
Lucy, L.B., 1968a. Astrophys. J., 151, 1123.
Lucy, L.B., 1968b. Astrophys. J., 153, 877.
Lucy, L.B., 1973. Astrophys. Space Sci., 22, 381.
Lucy, L.B., 1976. Astrophys. J., 205, 208.
Lucy, L.B., & Wilson, R.E., 1979. Astrophys. J., 231, 502.
McFarlane, T.M., 1986. PhD thesis, University of St. Andrews.
McFarlane, T.M., Hilditch, R.W., & King, D.J., 1986. Mon. Not. R. astr. Soc., 223, 595.
Mochnacki, S.W., 1981. Astrophys. J., 245, 650.
Mullan, D.J., 1975. Astrophys. J., 198, 563.
Mullan, D.J. 1976a. Irish Astronomical Journal, 12, 161.
Mullan, D.J., 1976b. Irish Astronomical Journal, 12, 277.